
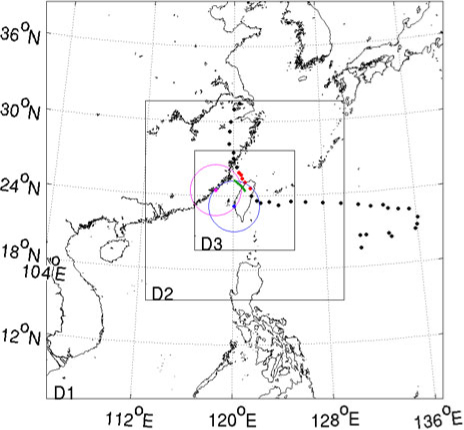
Fig. 1
The two-way interactive, triple-nested domains. The black and red dots mark the best track of Typhoon Morakot (2009) with a 6-hour interval provided by the Central Weather Bureau (CWB). The red dots correspond to the period (0000 UTC 8 to 0000 UTC 9 Aug) of the nature run, whose track is indicated by the green line. The blue dot and circle mark the location and maximum unambiguous range of the RCCG radar, and the magenta ones represent an imaginary radar at Kinmen.
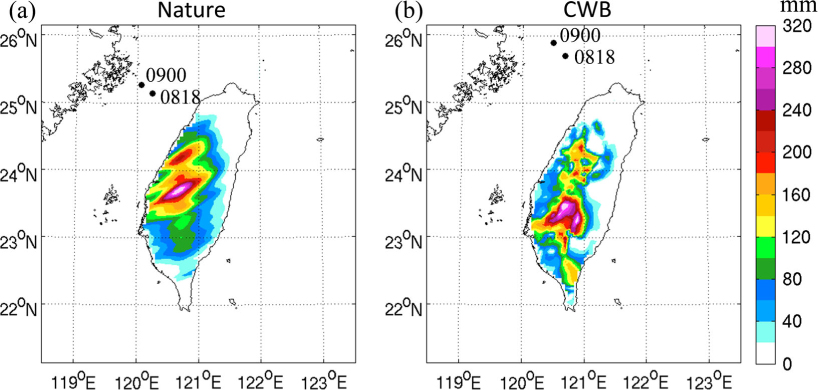
Fig. 2
(a) The 700-hPa circulation centre (black dots) and 6-hour rainfall accumulation (colour shading) for the nature run and (b) the best track and 6-hour rainfall accumulation for the Central Weather Bureau (CWB) observations from 1800 UTC 8 to 0000 UTC 9 Aug.
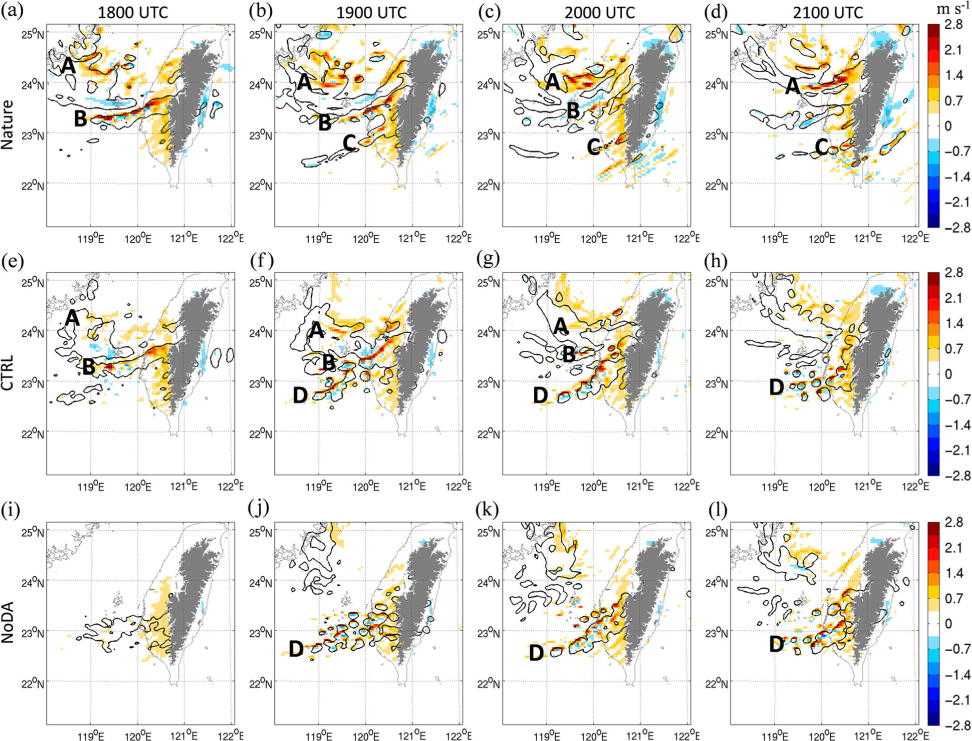
Fig. 3
The field of w (colour shading) at an altitude of 1 km and the composite of the maximum q r at all levels (contours at 1 g kg−1). Columns from left to right: 1800, 1900, 2000 and 2100 UTC 8 Aug. Rows from top to bottom: the nature run, CTRL and NoDA. The grey shading indicates the mountain areas higher than 1 km. The upper-case letters mark the spiral rainbands discussed in the text. The RCCG radar is situated in the centre (120.0860°E, 23.1467°N).
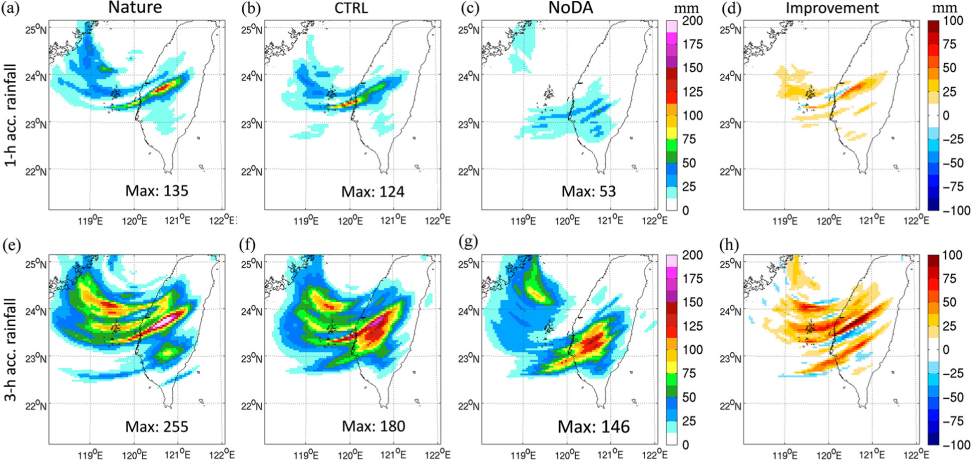
Fig. 4
The (a–c) 1-hour and (e–g) 3-hour rainfall accumulations since 1800 UTC 8 Aug for the nature run, CTRL and NoDA and (d and h) the improvement, which is computed by subtracting the absolute error in CTRL from that in NoDA. The RCCG radar is situated in the centre (120.0860°E, 23.1467°N).

Fig. 5
The schematic design of the OSSEs. The black dots represent the simulated observations of the RCCG radar. The single and triple arrows represent single and ensemble simulations, respectively.
Table 1. The list of the assimilation experiments
NameAssimilated observationsLength of the assimilation periodAnalysis cycle intervalHorizontal covariance localisation radius
CTRLV r , Z h (RCCG)2 hours15 minutes12 km (all variables)VRV r (RCCG)***ZHZ h (RCCG)***VZ0V r , Z h , 0-dBZ Z h (RCCG)***KMV r , Z h (RCCG, Kinmen)***P1*1 hour**P3*3 hours**I7.5**7.5 minutes*I30**30 minutes*UV24***24 km (u, v), 12 km (others)UV36***36 km (u, v), 12 km (others)NoDANo data assimilation
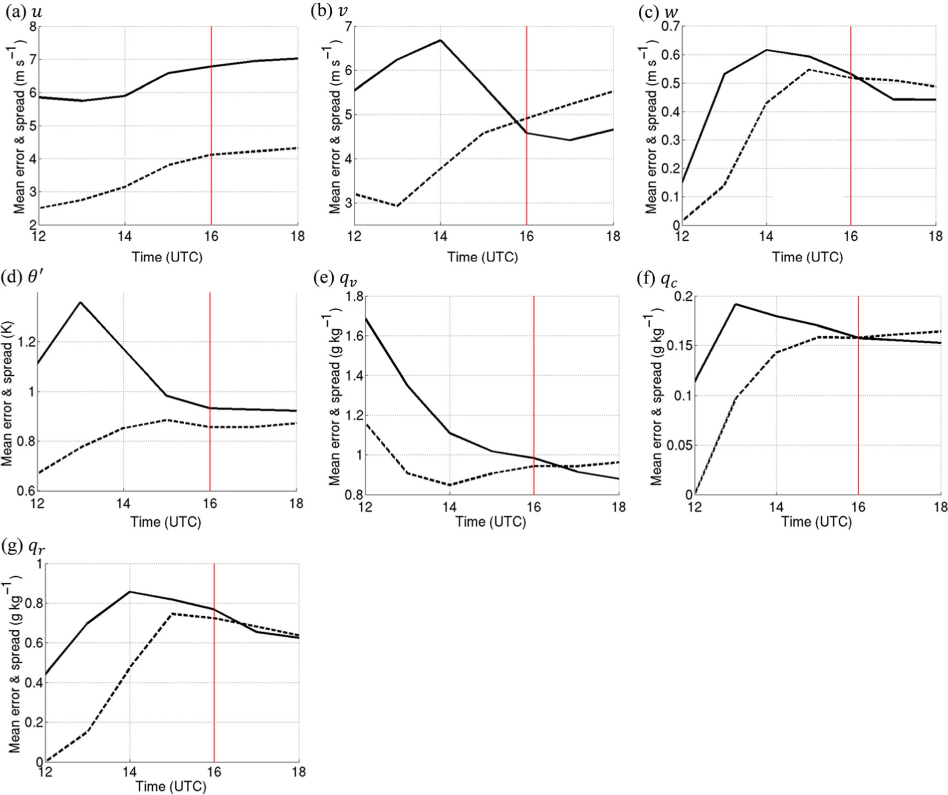
Fig. 6
The ensemble mean errors (solid) and ensemble spreads (dashed) of (a) u, (b) v, (c) w, (d) θ′, (e) q v , (f) q c and (g) q r from 1200 to 1800 UTC 8 Aug for NoDA, computed by performing a root-mean-square operation on the grid points located at the lowest 14 levels and within RCCG's maximum unambiguous range.
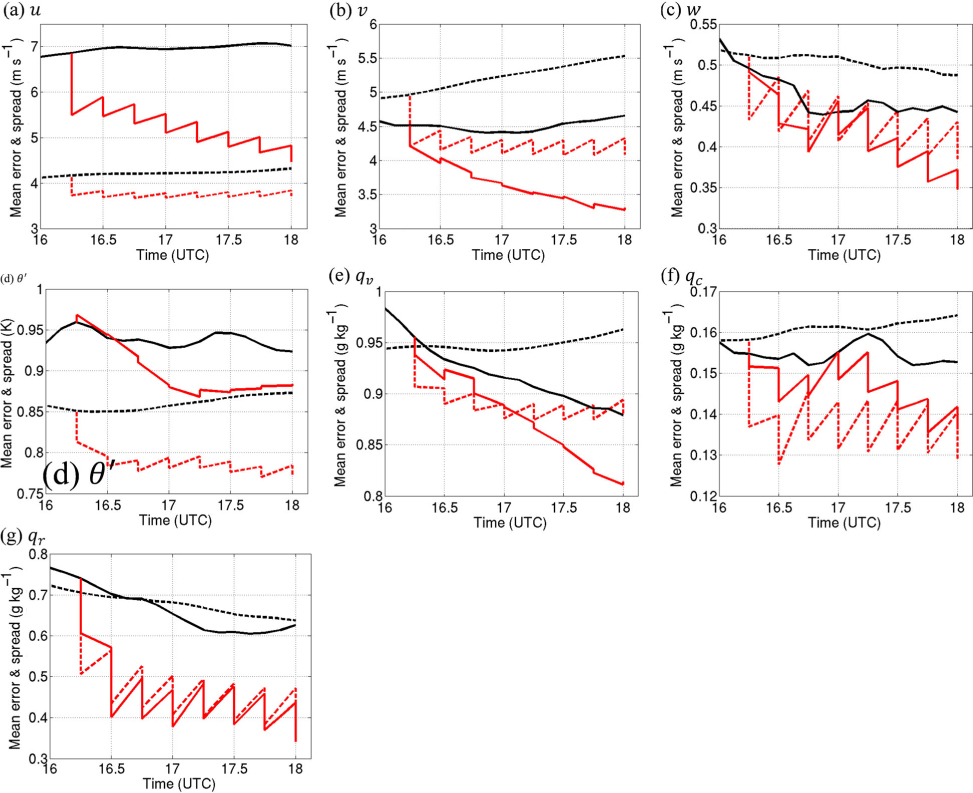
Fig. 7
As in Fig. 6, but the time interval is zoomed into 1600–1800 UTC (after the red line in Fig. 6). The ensemble mean errors (red solid) and ensemble spreads (red dashed) from CTRL are included.
{ label needed for table-wrap[@id='UT0002'] }
Table 2. The final analysis mean errors of u, v, w, θ′, q v , q c and q r at 1800 UTC 8 Aug for all the assimilation experiments, computed by performing a root-mean-square operation on the grid points located at the lowest 14 levels and within RCCG's maximum unambiguous range, and their improvement percentages compared with NoDA
Nameu (m s−1)%v (m s−1)%w (m s−1)%θ′ (K)%q v (g kg−1)%q c (g kg−1)%q r (g kg−1)%
CTRL4.5363.3290.35210.8840.8170.14110.3445VR4.9304.1130.4174Co-action 70.8710.1460.578ZH6.3113.8190.39120.97--50.8710.1470.3839VZ04.535Co-action 3.2Co-action 31Co-action 0.33Co-action 26Co-action 0.87Co-action 60.827Co-action 0.13Co-action 13Co-action 0.31Co-action 51KMCo-action 3.6Co-action 49Co-action 2.7Co-action 42Co-action 0.31Co-action 31Co-action 0.84Co-action 9Co-action 0.78Co-action 11Co-action 0.12Co-action 19Co-action 0.27Co-action 57P15.1273.9170.3717Co-action 0.87Co-action 60.8620.1480.3741P3Co-action 4.2Co-action 40Co-action 3.2Co-action 32Co-action 0.34Co-action 23Co-action 0.86Co-action 7Co-action 0.80Co-action 9Co-action 0.13Co-action 12Co-action 0.33Co-action 47I7.5Co-action 4.2Co-action 40Co-action 3.2Co-action 30Co-action 0.32Co-action 270.9200.8710.1411Co-action 0.30Co-action 52I305.0293.8190.3814Co-action 0.88Co-action 50.8440.1470.4332UV24Co-action 4.1Co-action 42Co-action 3.2Co-action 31Co-action 0.34Co-action 230.8940.8260.1410Co-action 0.34Co-action 46UV36Co-action 4.0Co-action 433.427Co-action 0.35Co-action 220.8930.8530.1490.3741NoDA7.04.70.440.920.880.150.63
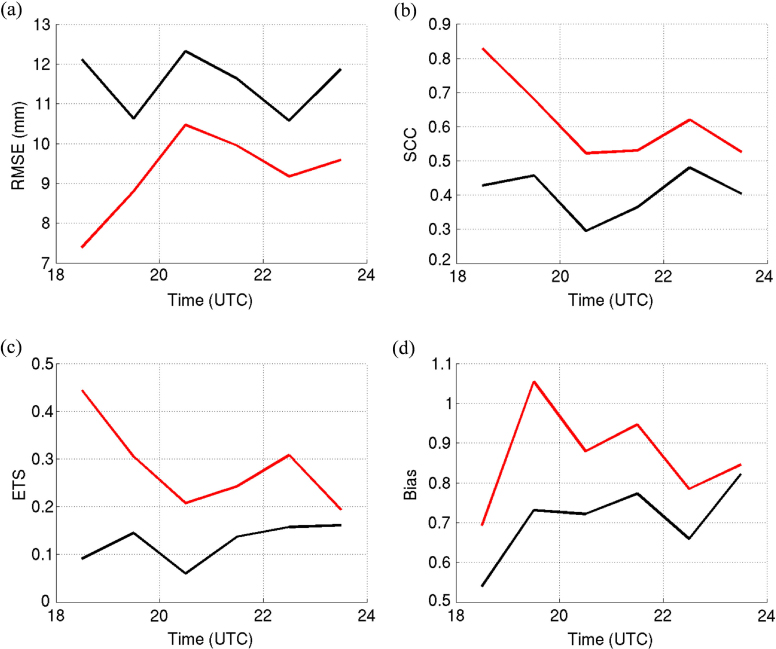
Fig. 8
The (a) RMSE, (b) SCC, (c) ETS and (d) Bias of the predicted hourly rainfall compared with the nature run from 1800 UTC 8 to 0000 UTC 9 Aug for CTRL (red) and NoDA (black), computed within RCCG's maximum unambiguous range. The hourly rainfall threshold of the ETS and Bias is 15 mm.
{ label needed for table-wrap[@id='UT0003'] }
Table 3. The RMSEs of the predicted 1-, 2-, 3-, 4-, 5- and 6-hour rainfall accumulations since 1800 UTC 8 Aug for all the assimilation experiments, computed within RCCG's maximum unambiguous range, and their improvement percentages compared with NoDA
Name1-hour rain (mm) %2-hour rain (mm) %3-hour rain (mm) %4-hour rain (mm) %5-hour rain (mm) %6-hour rain (mm) %
CTRL7.43912.53816.73922.03526.83130.632VR11.5517.31422.61727.51931.81936.519ZH8.23214.22920.12725.92331.51936.818VZ0Co-action 6.7Co-action 4412.63717.83522.83227.82931.929KMCo-action 6.2Co-action 49Co-action 11.1Co-action 45Co-action 15.6Co-action 43Co-action 18.5Co-action 45Co-action 21.9Co-action 44Co-action 26.8Co-action 40P19.02614.32918.43323.03227.92833.126P3Co-action 7.2Co-action 4113.03517.23722.234Co-action 26.5Co-action 32Co-action 30.3Co-action 32I7.5Co-action 6.9Co-action 43Co-action 12.0Co-action 4016.73922.33427.72931.230I308.52914.13017.83523.13228.12832.328UV24Co-action 7.0Co-action 42Co-action 12.2Co-action 3916.93822.53327.72931.031UV36Co-action 7.2Co-action 40Co-action 12.1Co-action 4017.03822.63327.33031.530NoDA12.120.127.433.739.044.8
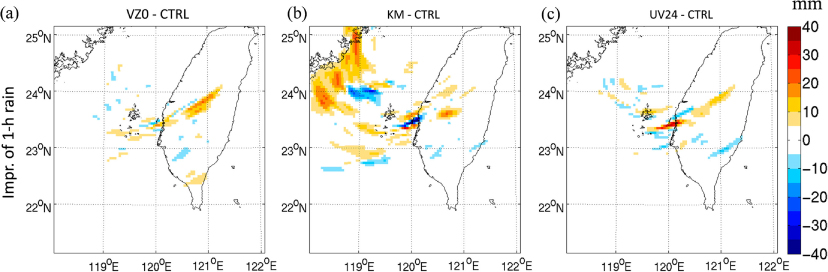
Fig. 9
The improvement of the predicted 1-hour rainfall accumulation since 1800 UTC 8 Aug for VZ0, KM and UV24 compared with CTRL. The RCCG radar is situated in the centre (120.0860°E, 23.1467°N), and the imaginary Kinmen radar is situated at the northwest corner (118.4181°E, 24.4615°N).
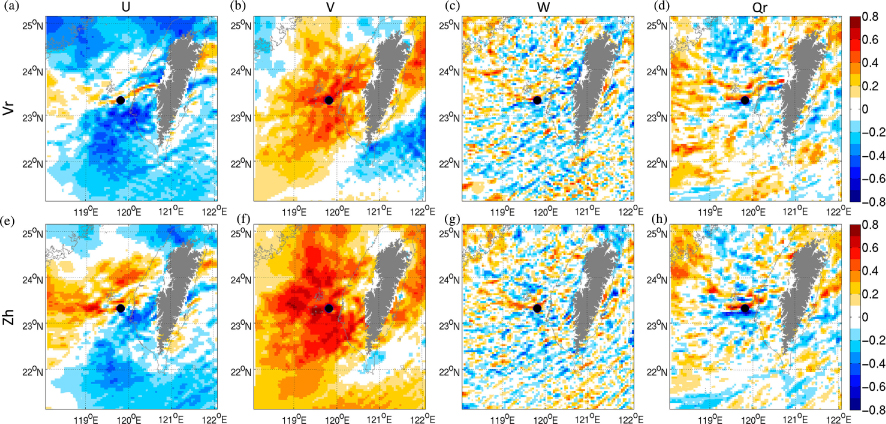
Fig. 10
The background error correlations at 1800 UTC for CTRL, between the fields of the prognostic variables (u, v, w and q r from left to right) at an altitude of 1 km and the observation variables (V r and Z h from top to bottom) at a point (black dot) in the area of rainband B. The coordinates of the point are 119.8138°E, 23.3372°N, 1 km. The grey shading indicates the mountain areas higher than 1 km. The RCCG radar is situated in the centre (120.0860°E, 23.1467°N).