
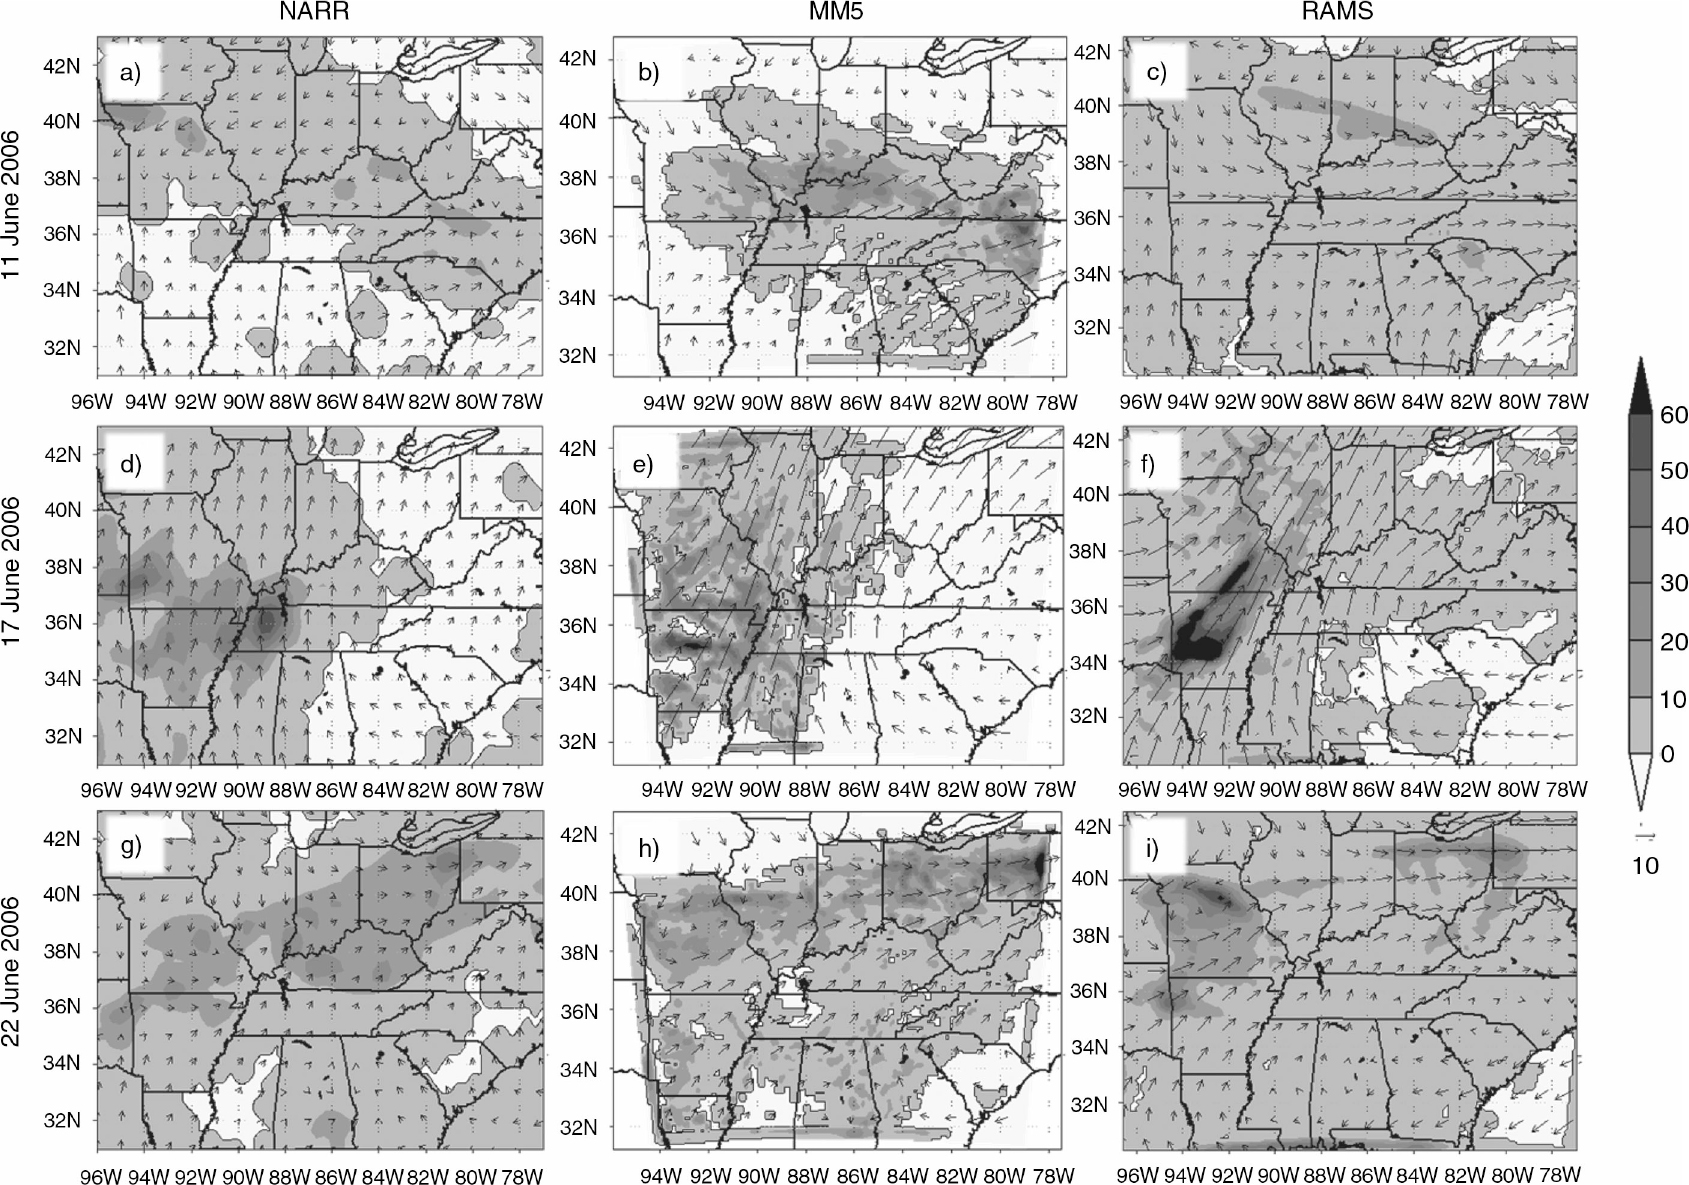
Fig. 1
NARR, MM5, and RAMS CTRL experiments 12-hour precipitation accumulation and horizontal wind velocities centred at 0000 UTC for each event.
Table 1. Summary of model specifications and parameterisations
Cumulus parameterisationModified Kuo (Tremback, 1990)Kain and Fritsch (1993)Cloud microphysicsWalko et al. (2000)1989)Radiation1987)1989)PBLPielke et al. (1992)Hong and Pan (1996)Cotton et al. (2003)Land surface modelLEAF2 (Walko et al., 2000)NOAH-LSM (Chen and Dudhia, 2001)Grid structureArakawa CArakawa CProjectionRotated polar stereographyLambert conformal
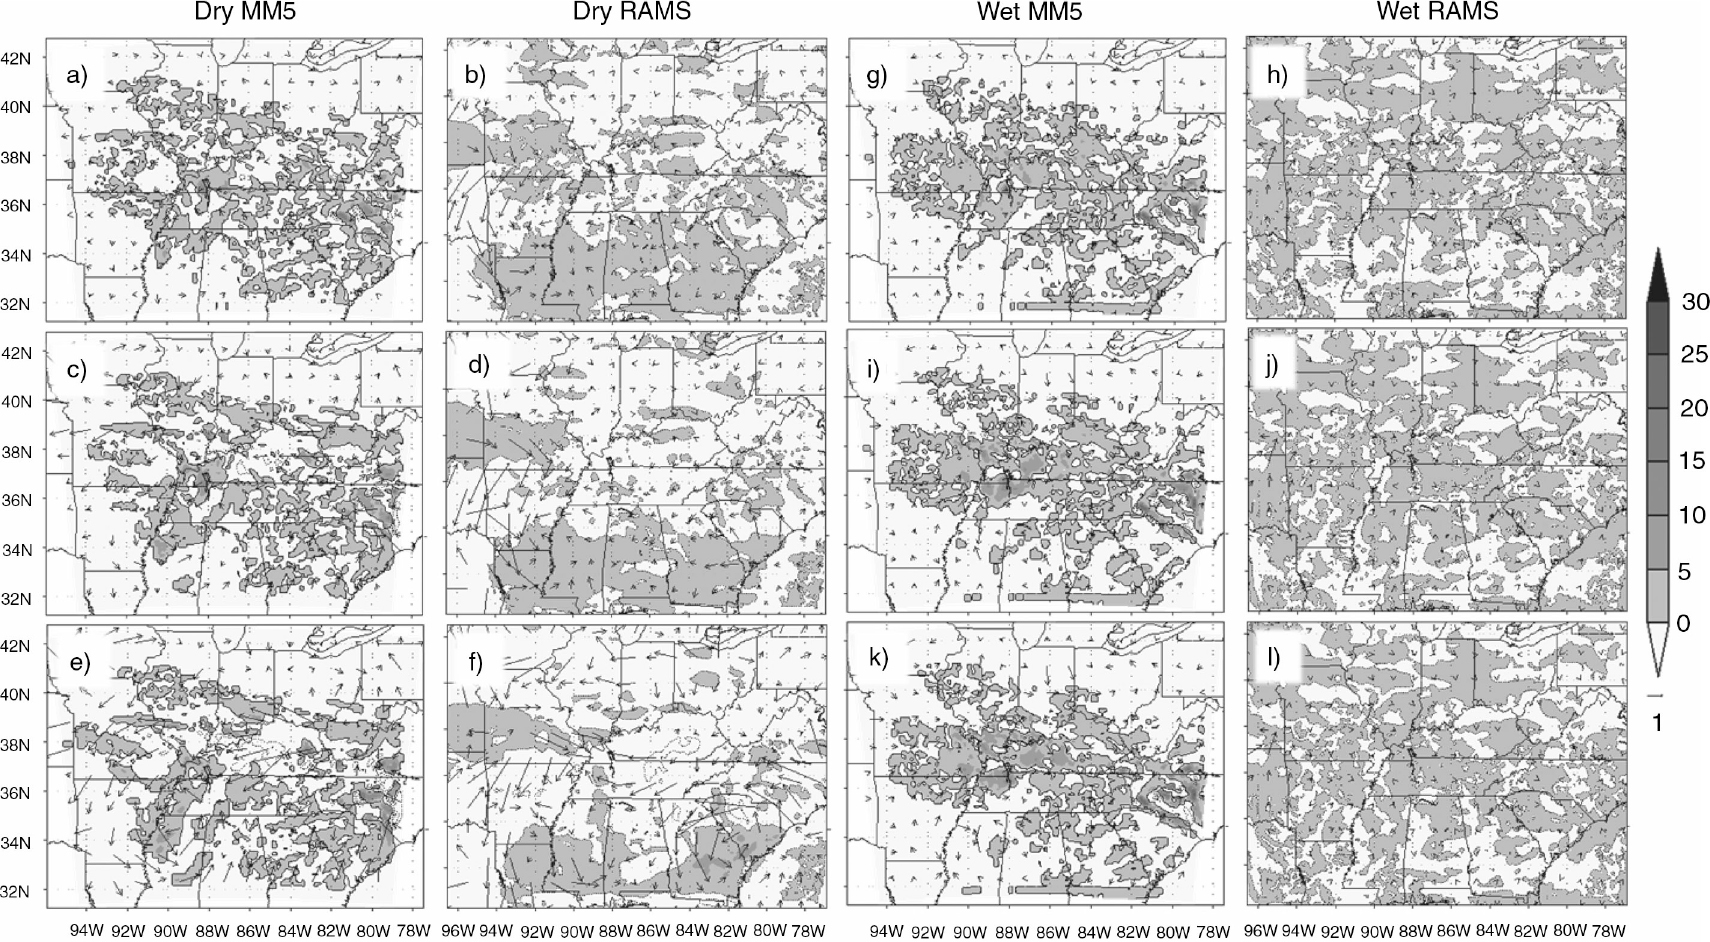
Fig. 2
MM5 and RAMS CTRL 12-hour precipitation accumulation difference (EXP minus CTRL) and horizontal wind velocities (m s−1) centred at 0000 UTC 12 June for DP05 (a, b), DP10 (c, d), DP15 (e, f), WP05 (g, h), WP10 (i, j) and WP15 (k, l).
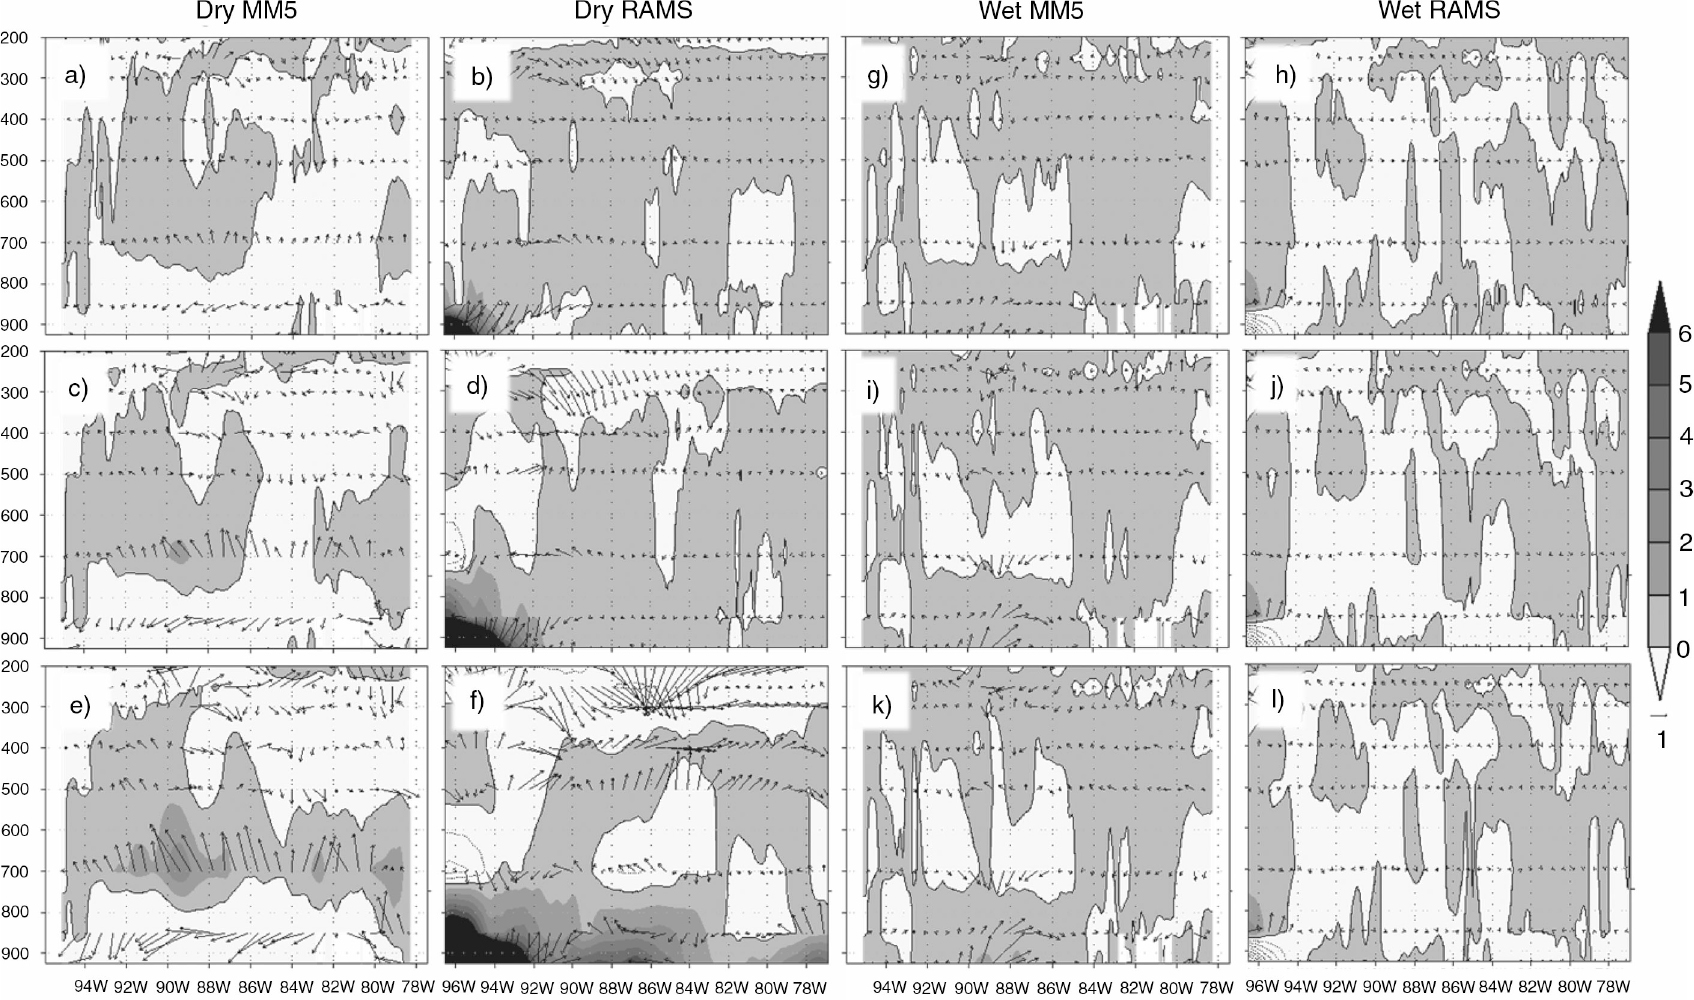
Fig. 3
MM5 EXP minus CTRL and RAMS EXP minus CTRL cross-sections for DP05 (a, b), DP10 (c, d), DP15 (e, f), WP05 (g, h), WP10 (i, j) and WP15 (k, l) 12-hour average θ e (negative values contoured, K) and horizontal wind velocities (m s−1) for 37°N latitude centred at 0000 UTC on 12 June. Pressure levels are shown in millibars.
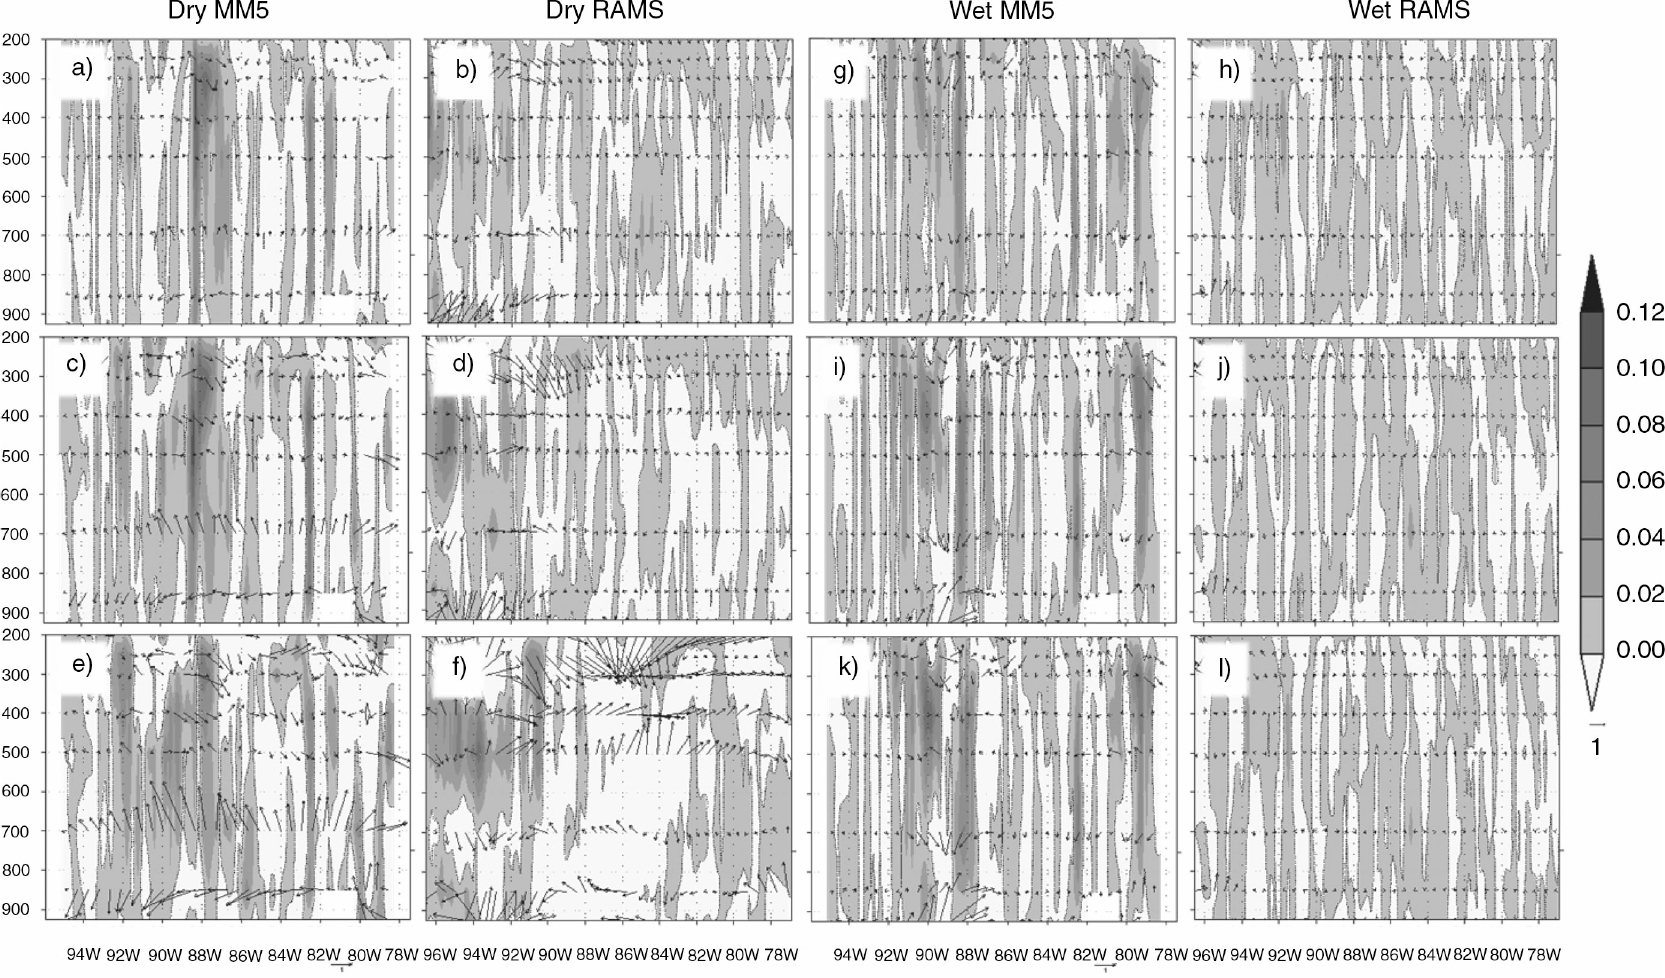
Fig. 4
MM5 EXP minus CTRL and RAMS EXP minus CTRL cross-sections for DP05 (a, b), DP10 (c, d), DP15 (e, f), WP05 (g, h), WP10 (i, j) and WP15 (k, l) 12-hour average vertical and horizontal wind velocities (m s−1) for 37°N latitude centred at 0000 UTC on 12 June. Pressure levels are shown in millibars.
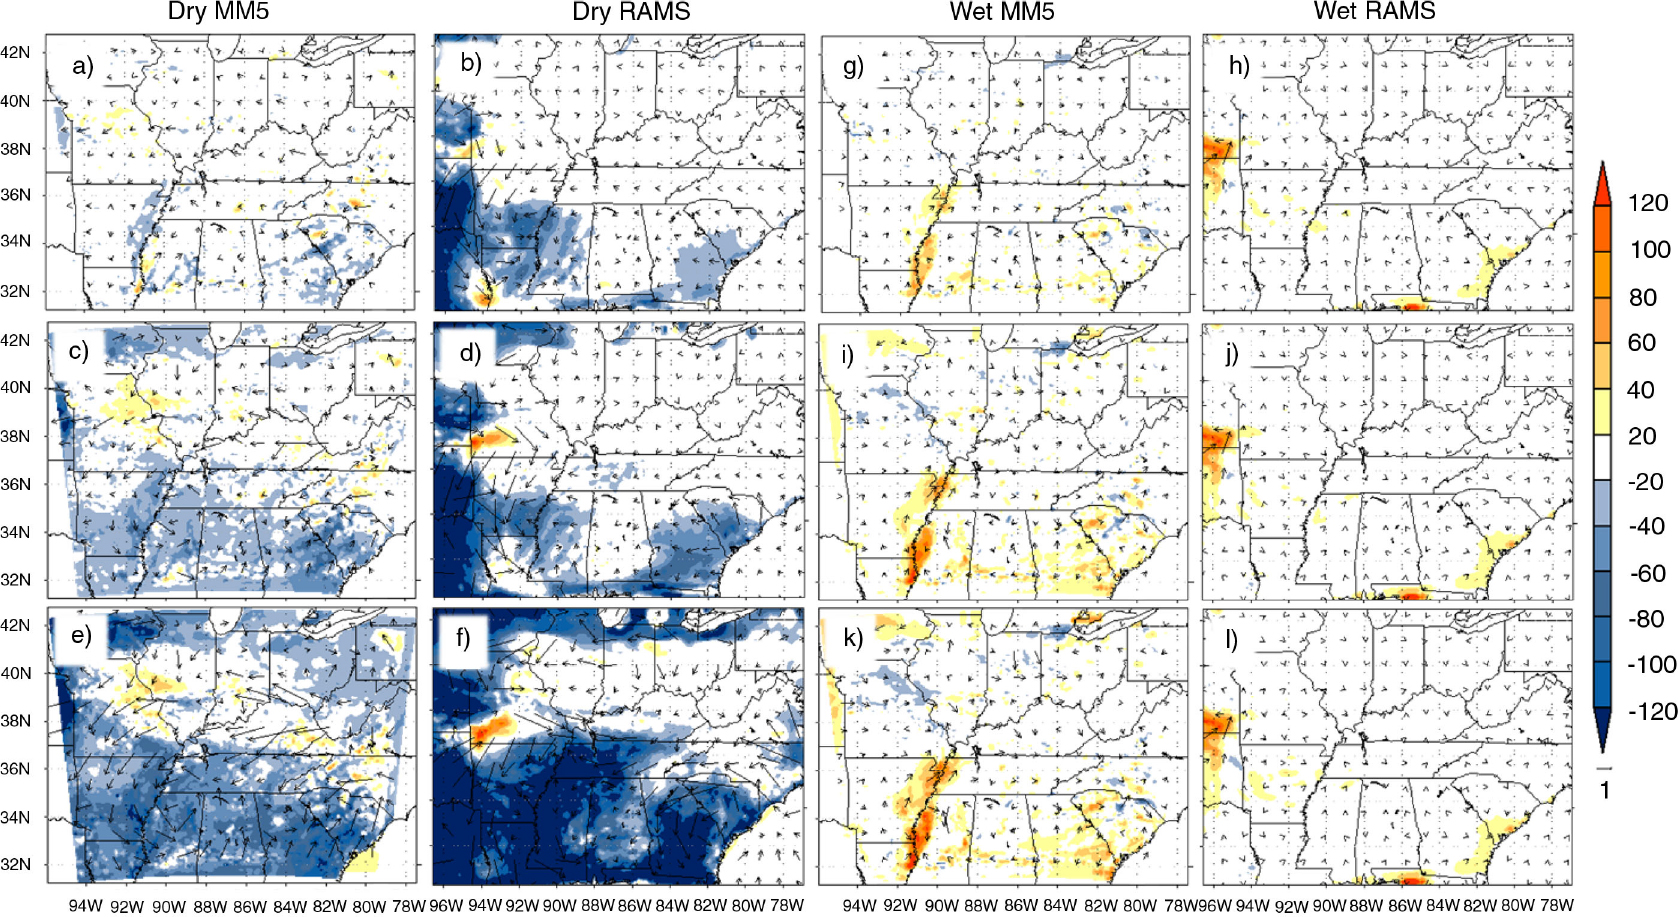
Fig. 5
MM5 EXP minus CTRL and RAMS EXP minus CTRL for DP05 (a, b), DP10 (c, d), DP15 (e, f), WP05 (g, h), WP10 (i, j) and WP15 (k, l) 12-hour average latent heat fluxes (Wm−2) and horizontal wind velocities (m s−1) centred at 0000 UTC on 12 June.
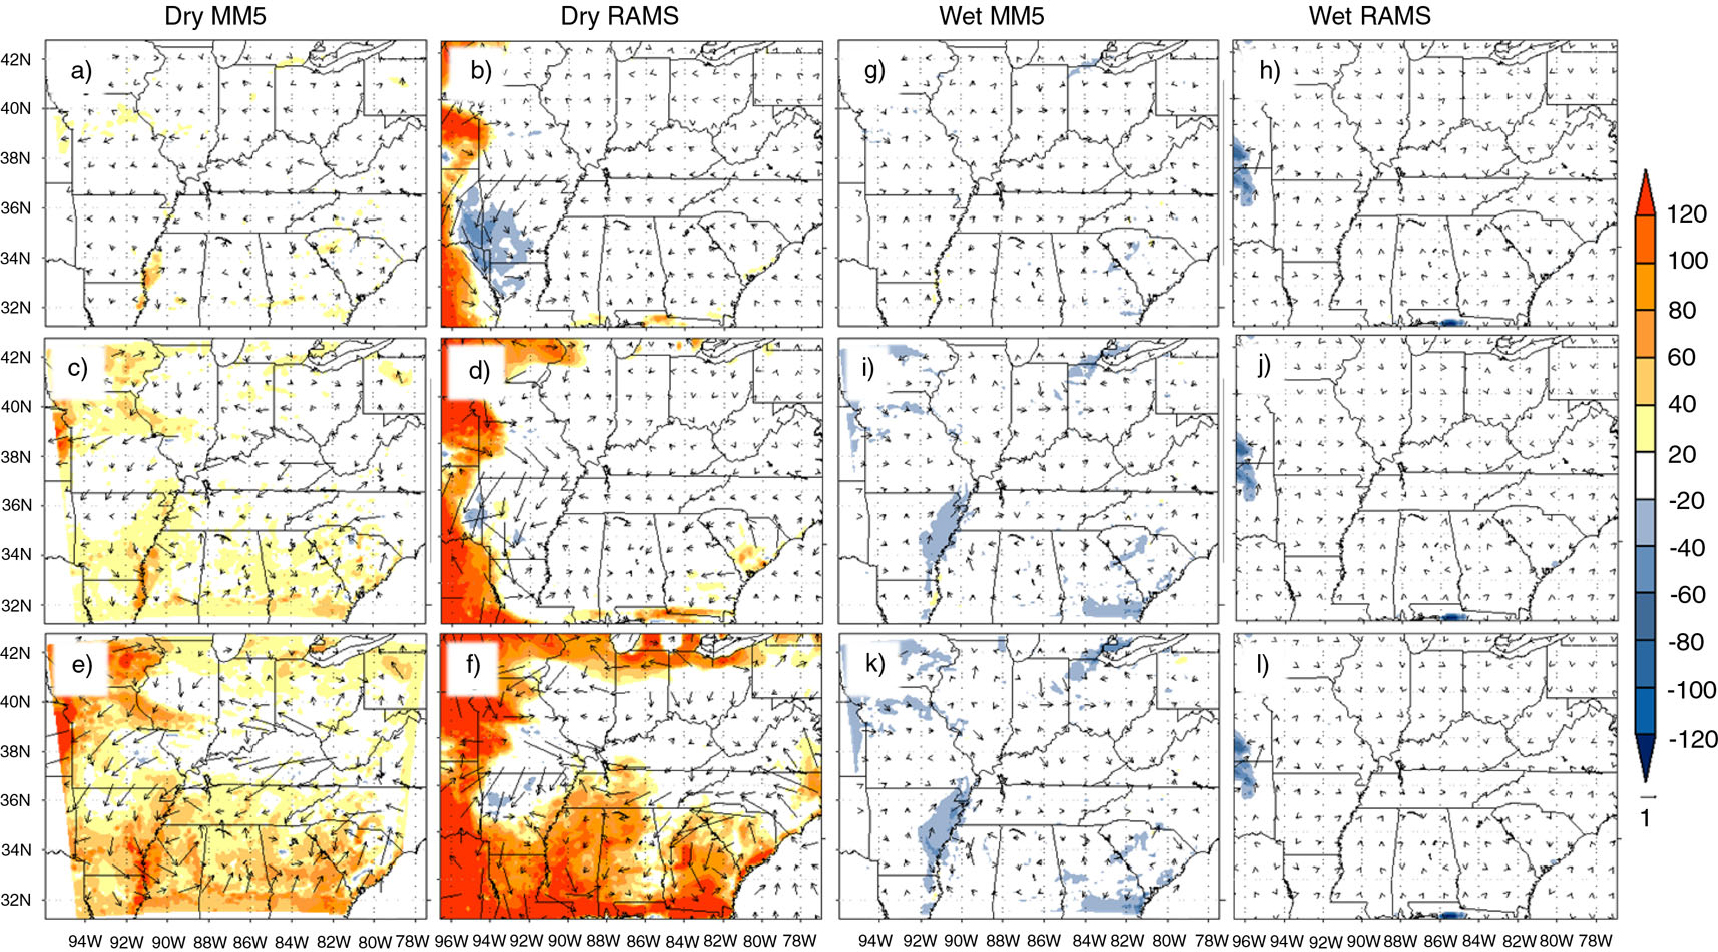
Fig. 6
MM5 EXP minus CTRL and RAMS EXP minus CTRL for DP05 (a, b), DP10 (c, d), DP15 (e, f), WP05 (g, h), WP10 (i, j) and WP15 (k, l) 12-hour average sensible heat fluxes (Wm−2) and horizontal wind velocities (m s−1) centred at 0000 UTC on 12 June.
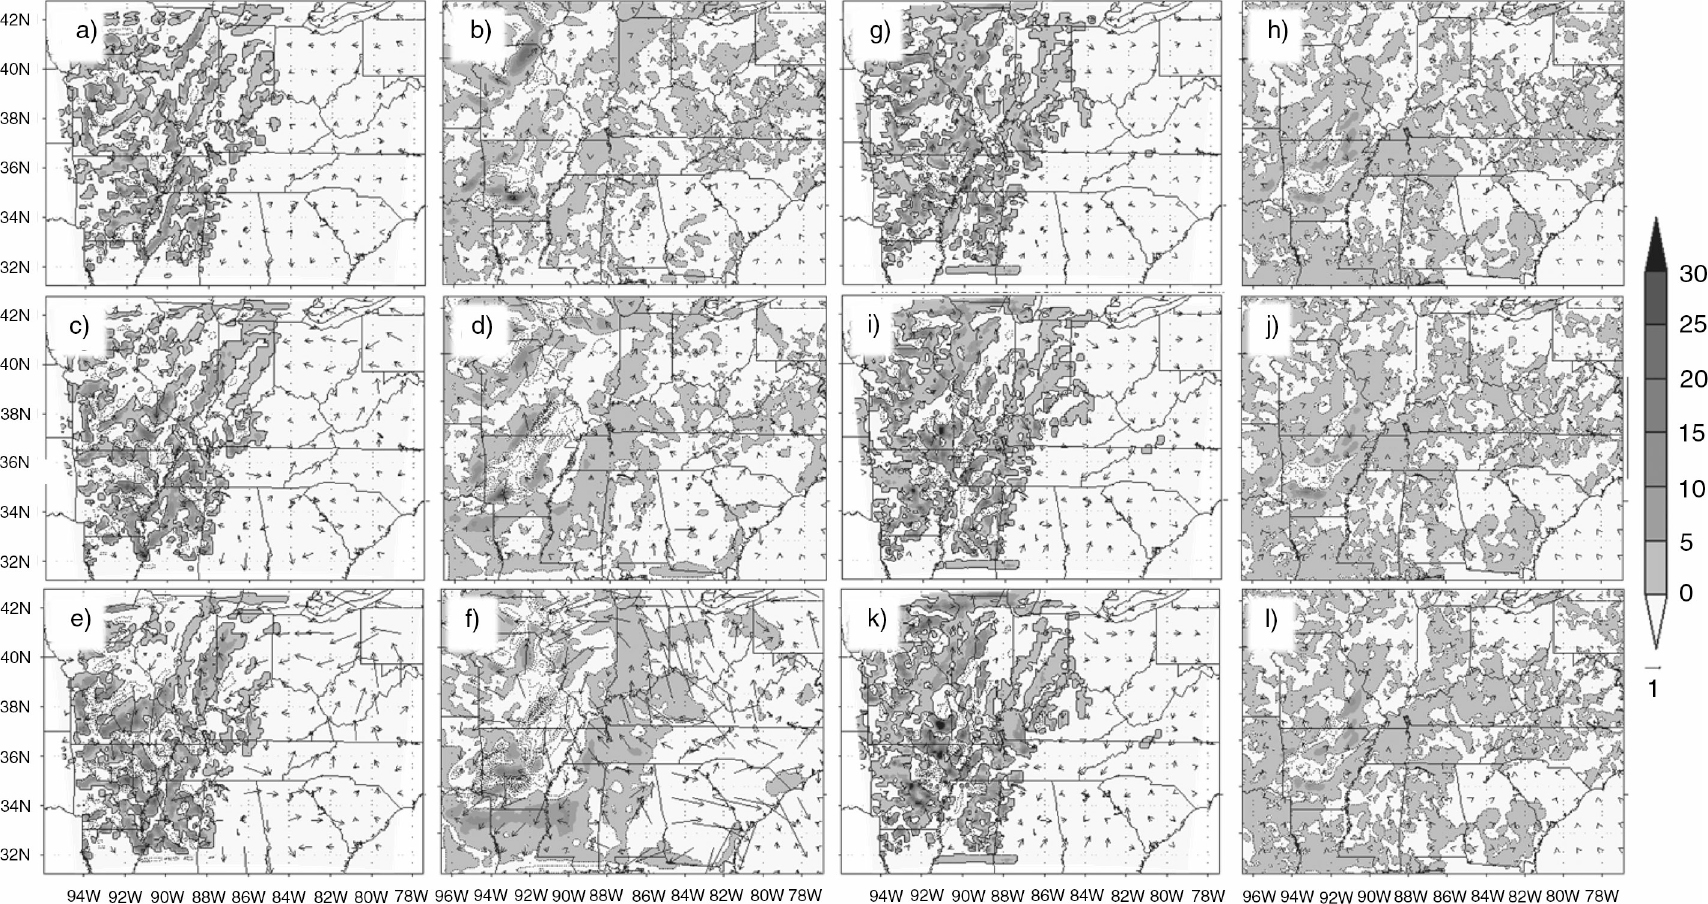
Fig. 7
MM5 and RAMS CTRL 12-hour precipitation accumulation difference (EXP minus CTRL) and horizontal wind velocities (m s−1) centred at 0000 UTC 18 June for DP05 (a, b), DP10 (c, d), DP15 (e, f), WP05 (g, h), WP10 (i, j) and WP15 (k, l).
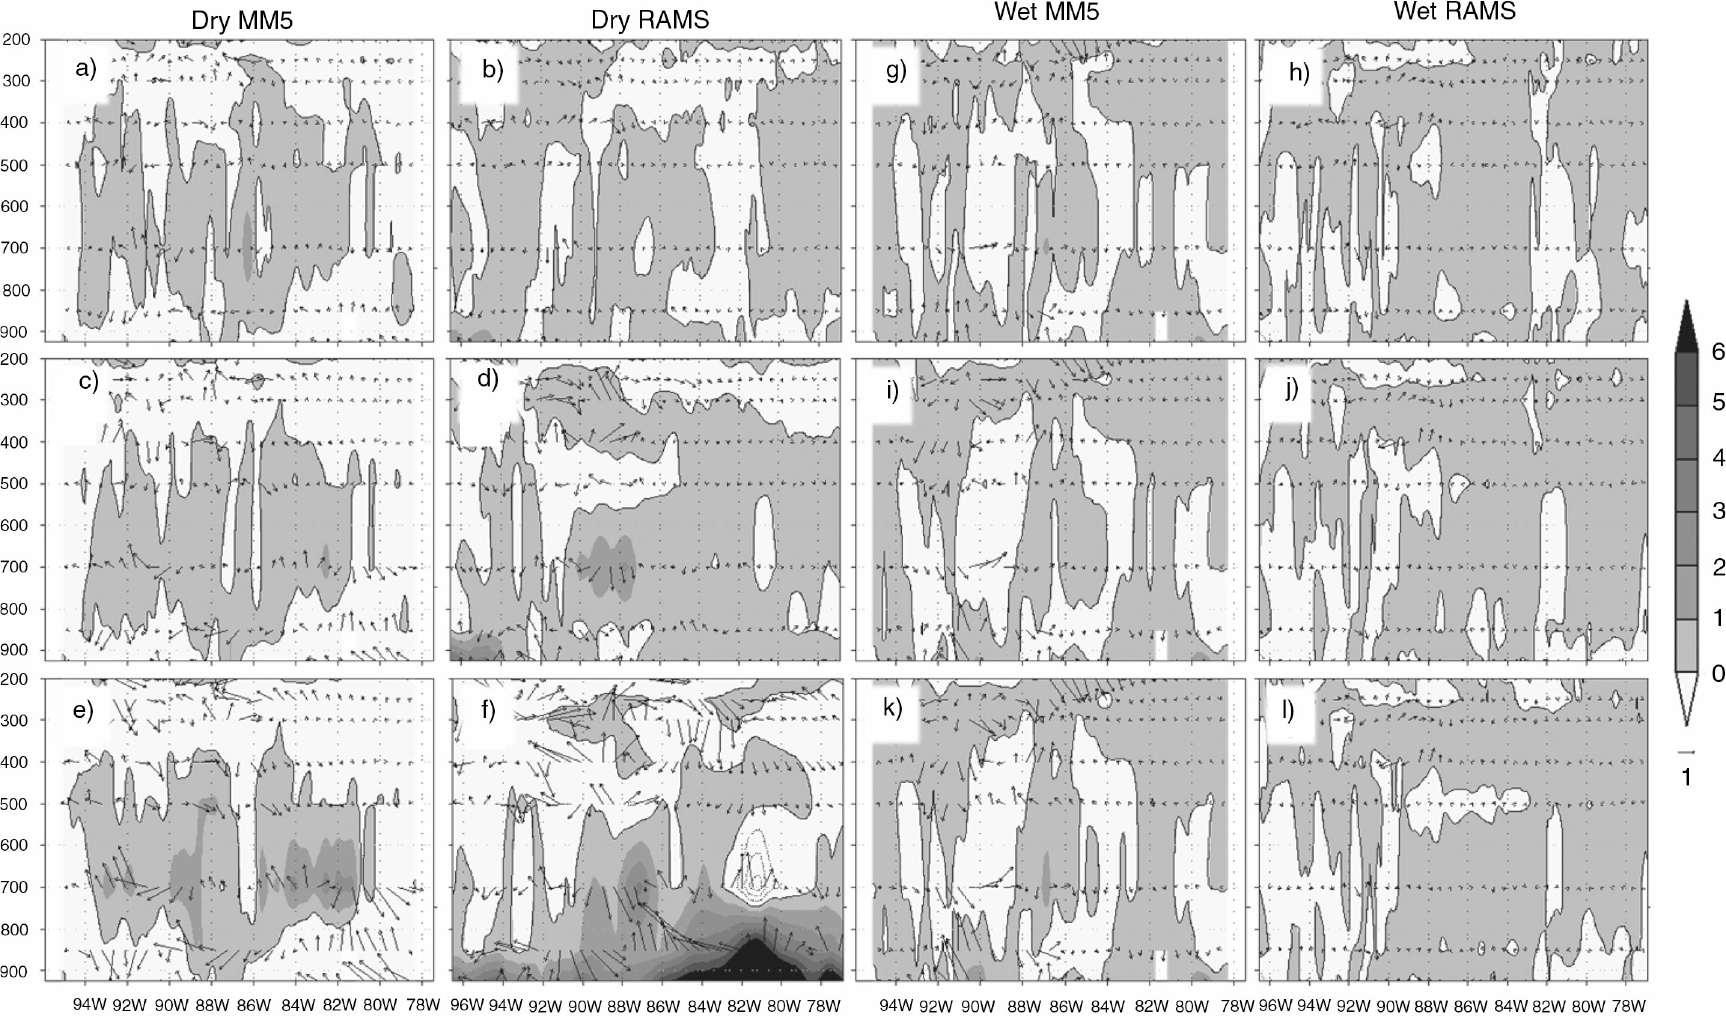
Fig. 8
MM5 EXP minus CTRL and RAMS EXP minus CTRL cross-sections for DP05 (a, b), DP10 (c, d), DP15 (e, f), WP05 (g, h), WP10 (i, j) and WP15 (k, l) 12-hour average θ e (negative values contoured, K) and horizontal wind velocities (m s−1) for 37°N latitude centred at 0000 UTC on 18 June. Pressure levels are shown in millibars.
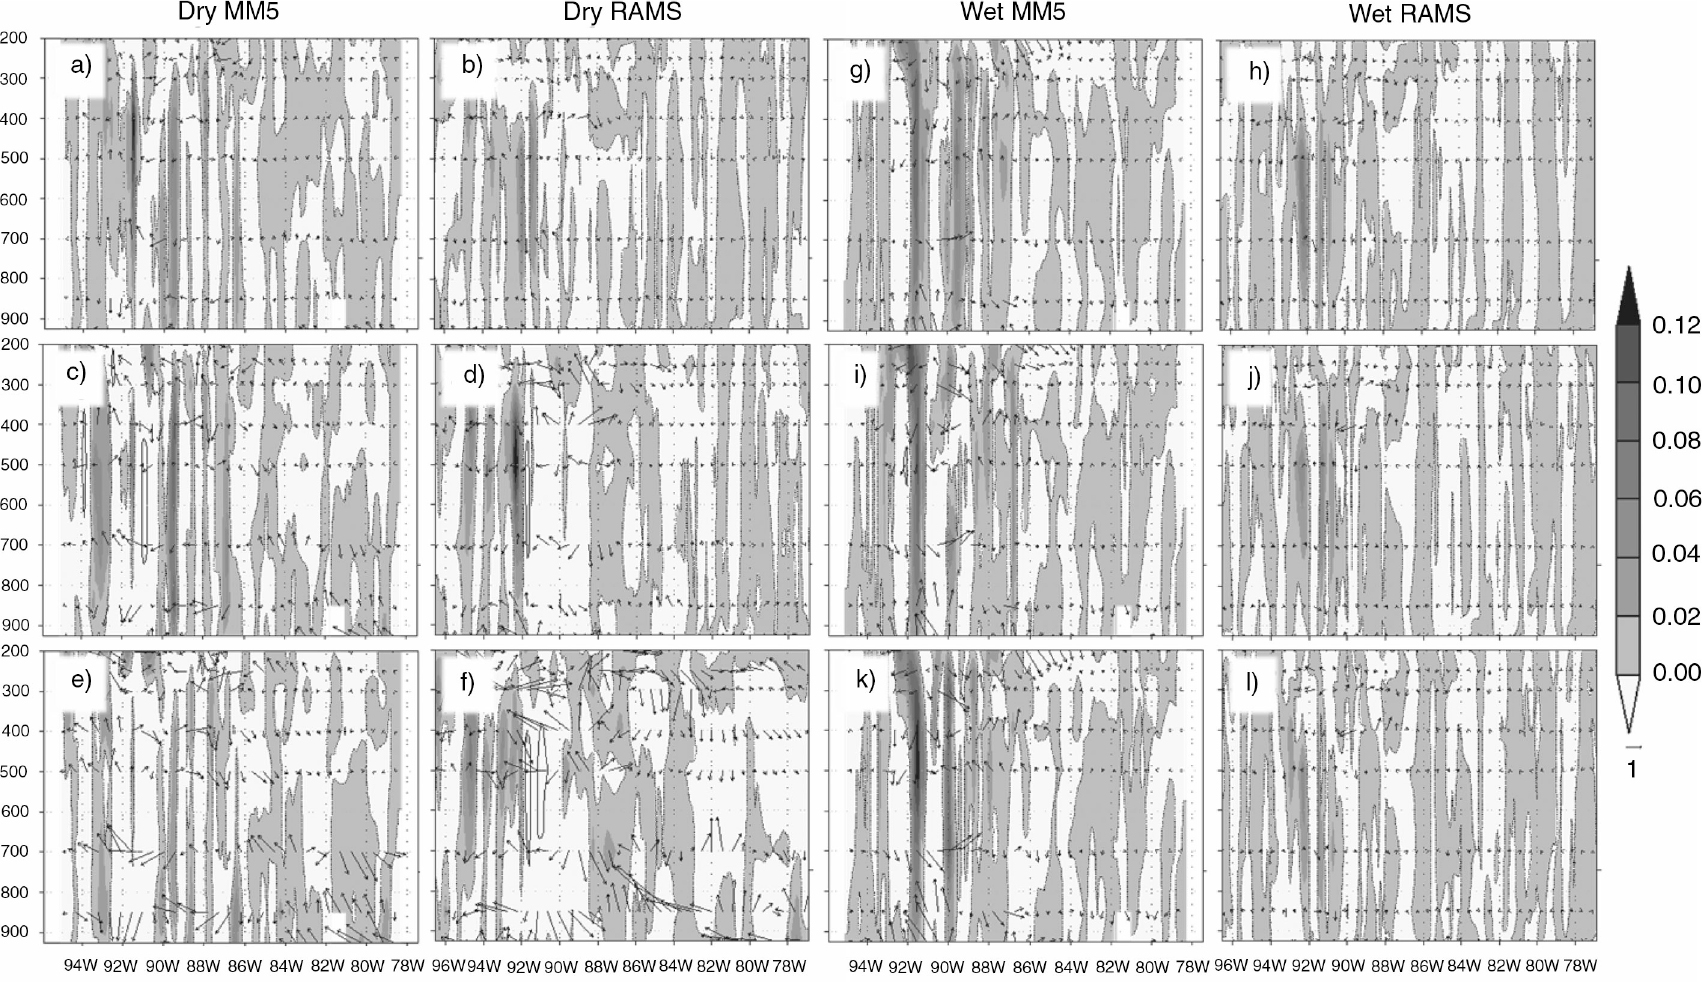
Fig. 9
MM5 EXP minus CTRL and RAMS EXP minus CTRL cross-sections for DP05 (a, b), DP10 (c, d), DP15 (e, f), WP05 (g, h), WP10 (i, j) and WP15 (k, l) 12-hour average vertical (negative values contoured) and horizontal wind velocities (m s−1) for 37°N latitude centred at 0000 UTC on 18 June. Pressure levels are shown in millibars.
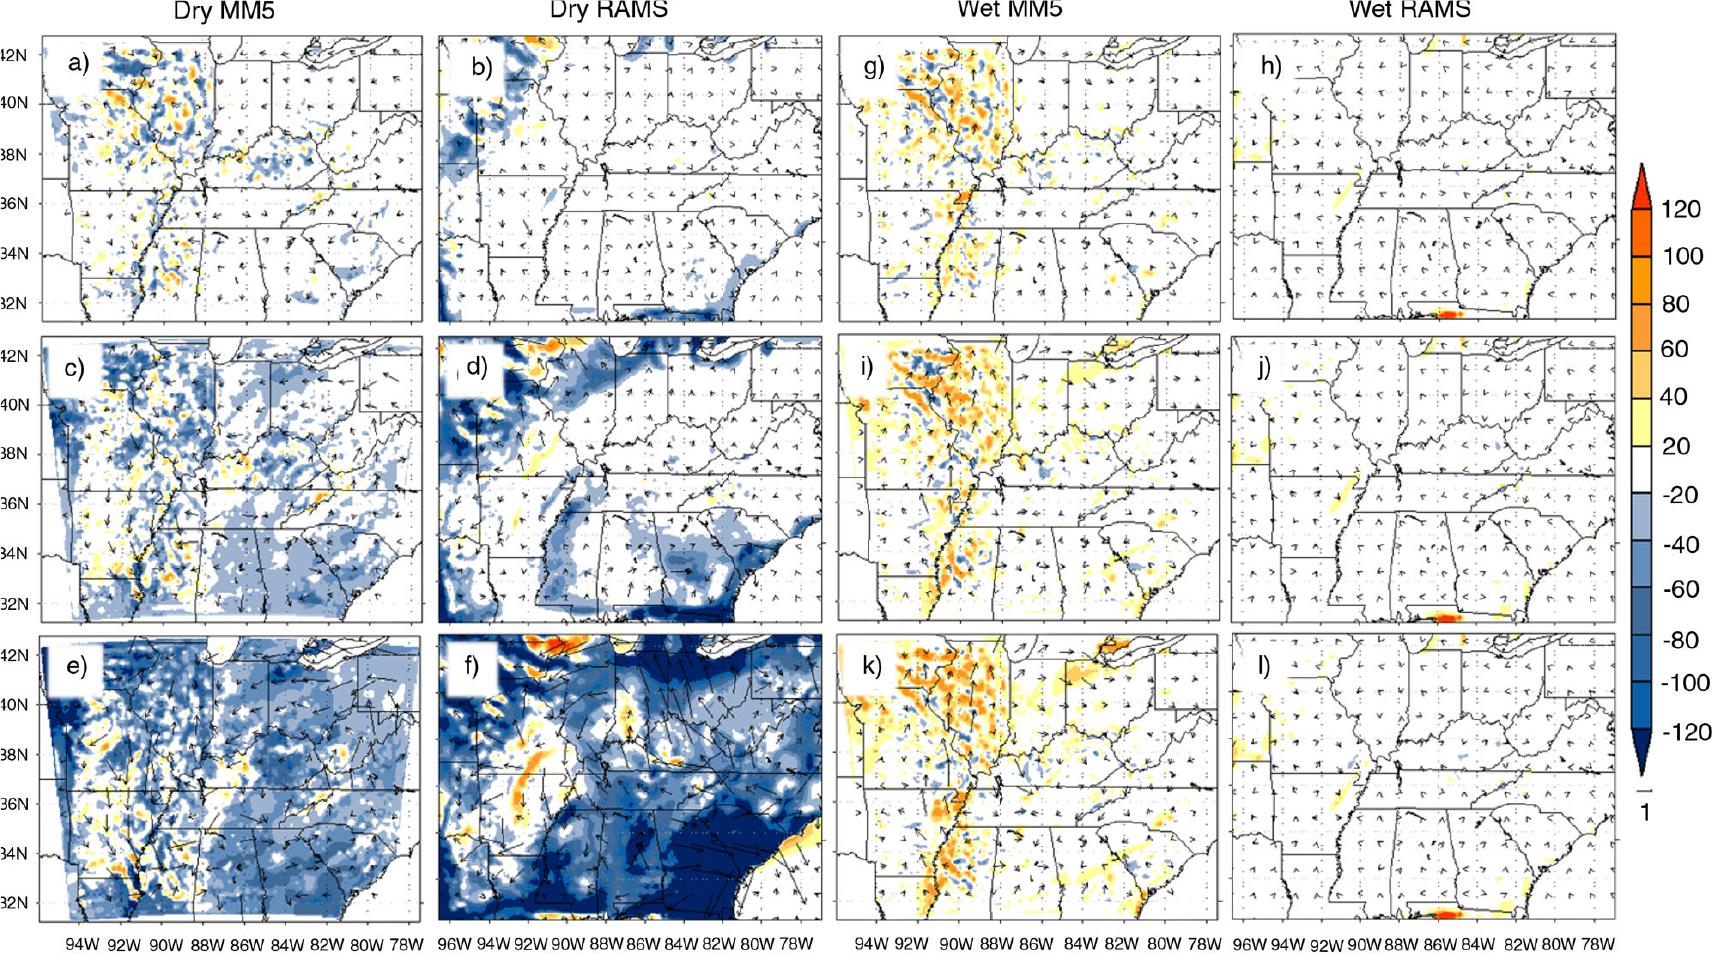
Fig. 10
MM5 EXP minus CTRL and RAMS EXP minus CTRL for DP05 (a, b), DP10 (c, d), DP15 (e, f), WP05 (g, h), WP10 (i, j) and WP15 (k, l) 12-hour average latent heat fluxes (Wm−2) and horizontal wind velocities (m s−1) centered at 0000 UTC on 18 June.
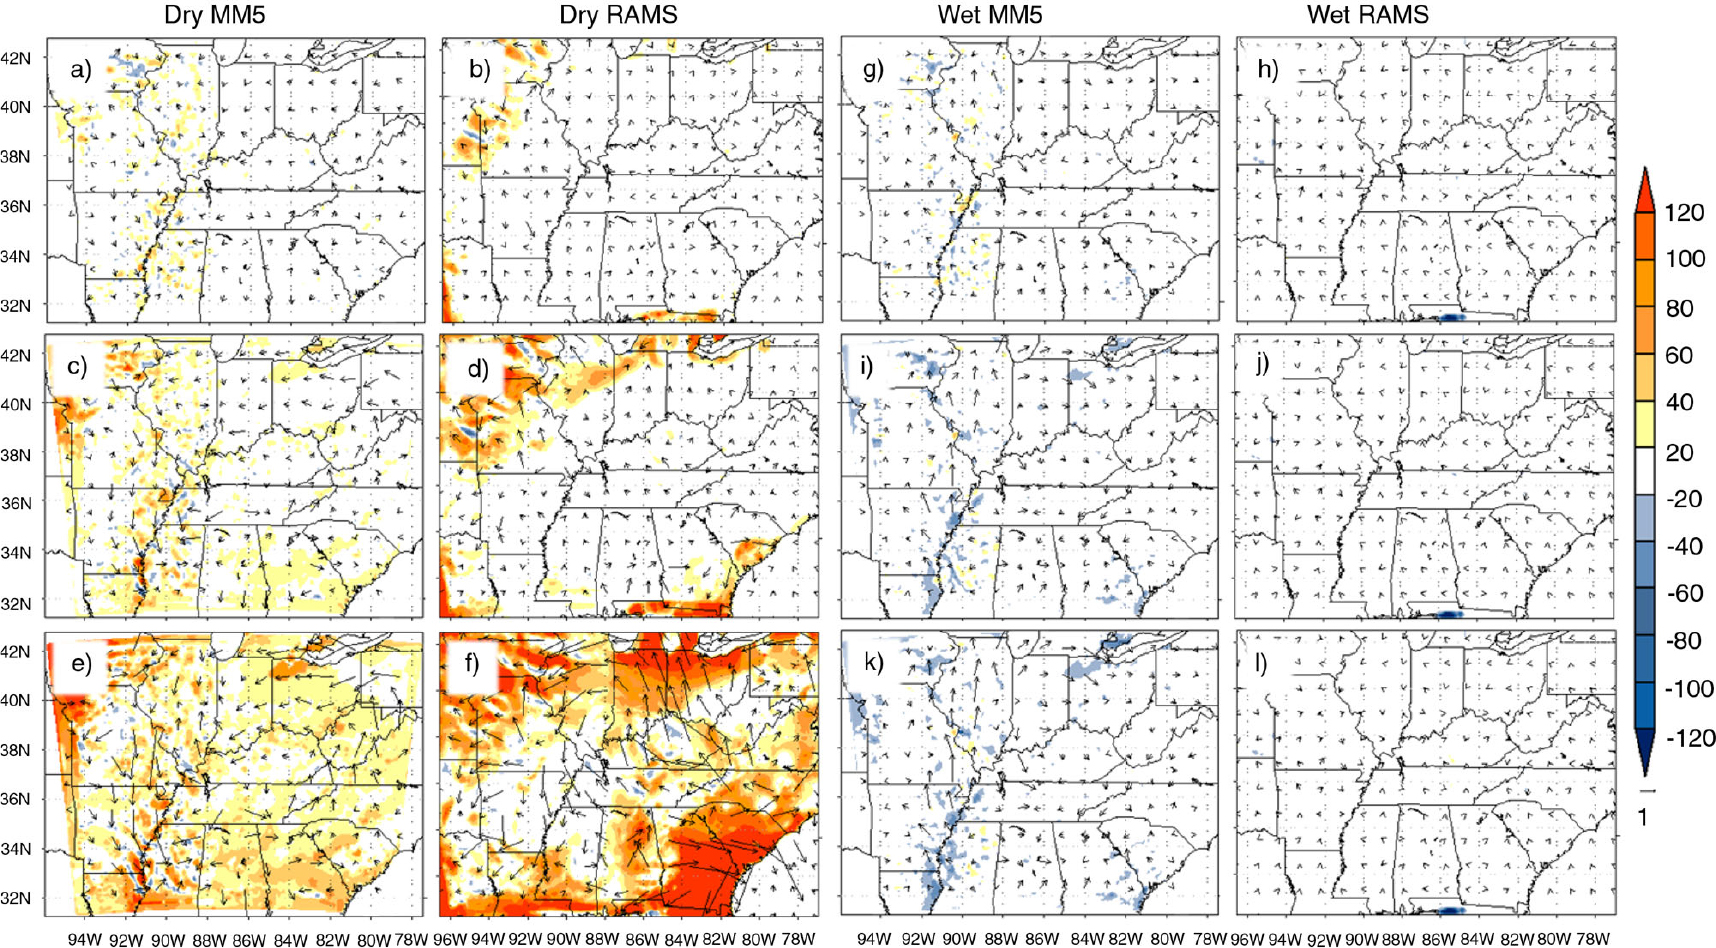
Fig. 11
MM5 EXP minus CTRL and RAMS EXP minus CTRL for DP05 (a, b), DP10 (c, d), DP15 (e, f), WP05 (g, h), WP10 (i, j) and WP15 (k, l) 12-hour average sensible heat fluxes (Wm−2) and horizontal wind velocities (m s−1) centered at 0000 UTC on 18 June.
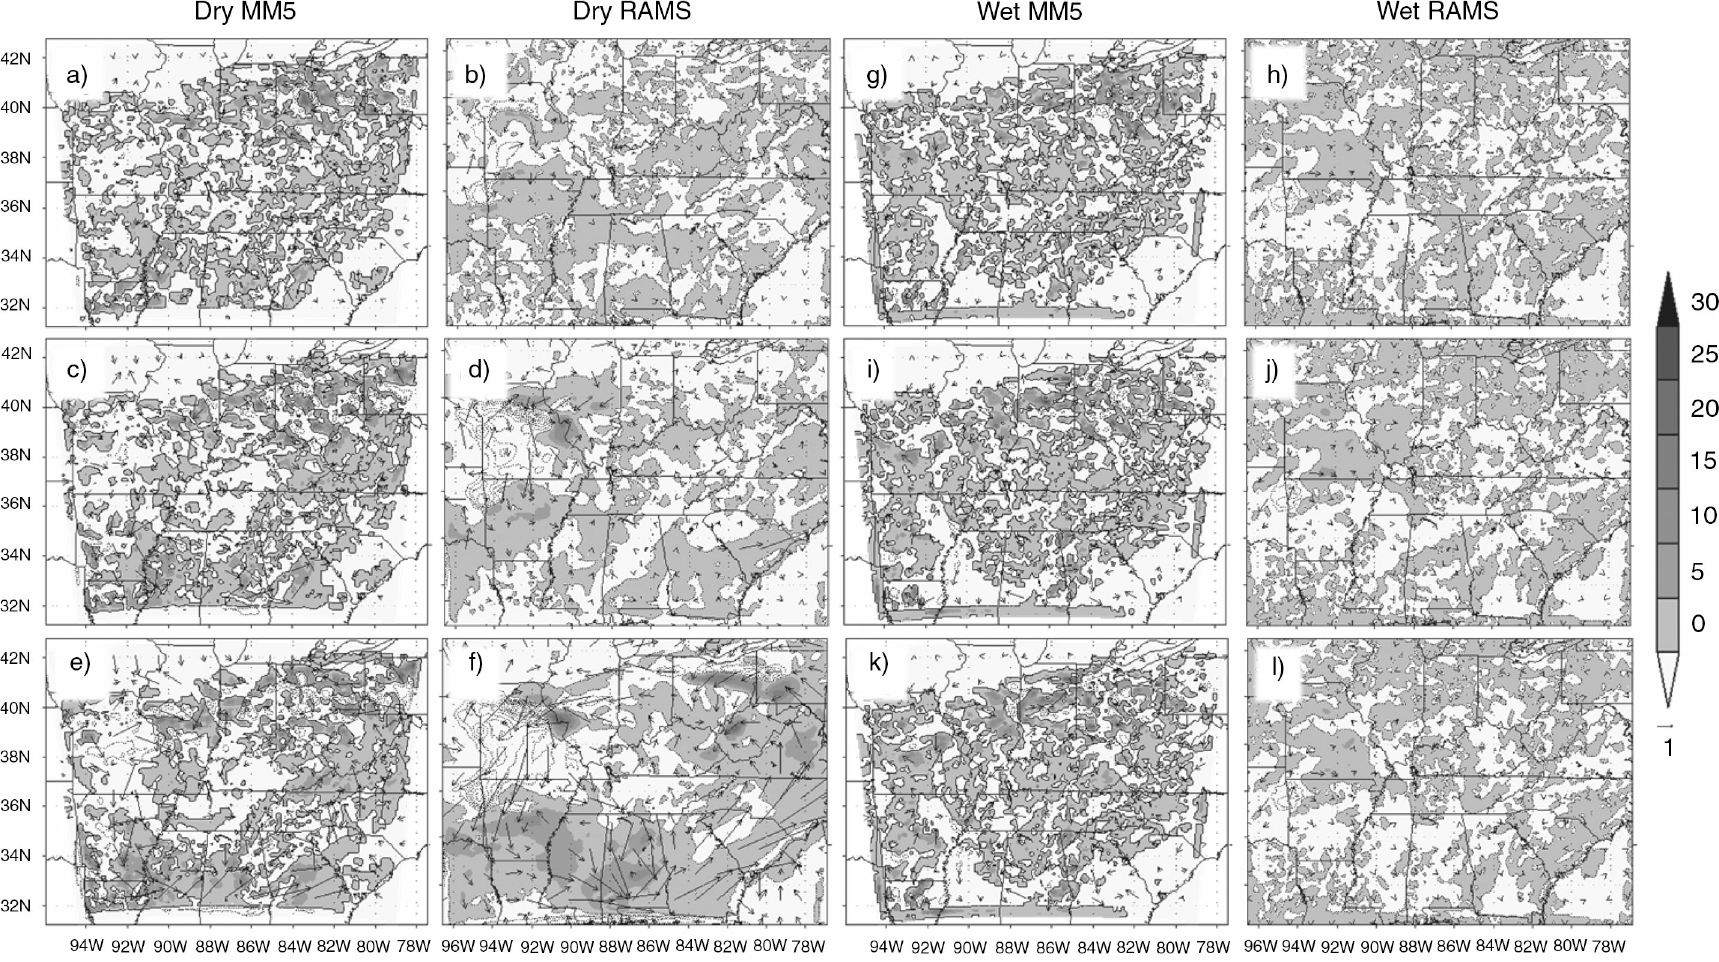
Fig. 12
MM5 and RAMS CTRL 12-hour precipitation accumulation difference (EXP minus CTRL) and horizontal wind velocities (m s−1) centred at 0000 UTC 23 June for DP05 (a, b), DP10 (c, d), DP15 (e, f), WP05 (g, h), WP10 (i, j) and WP15 (k, l).
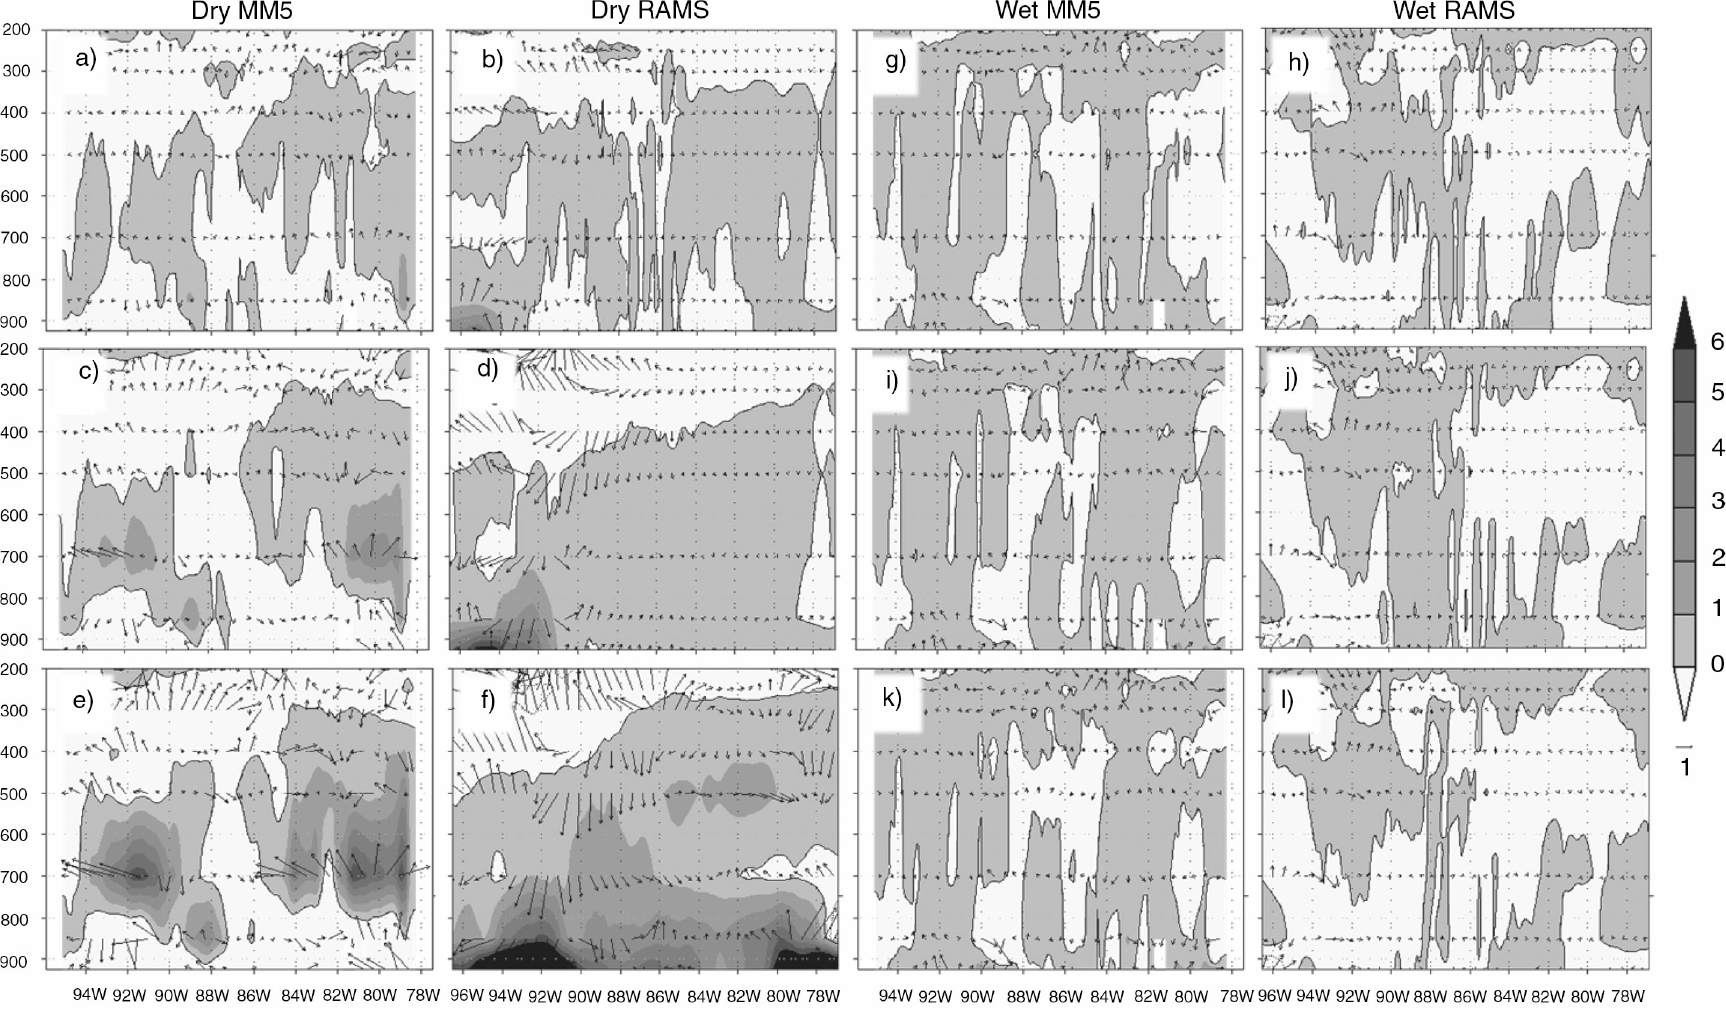
Fig. 13
MM5 EXP minus CTRL and RAMS EXP minus CTRL cross-sections for DP05 (a, b), DP10 (c, d), DP15 (e, f), WP05 (g, h), WP10 (i, j) and WP15 (k, l) 12-hour average θ e (negative values contoured, K) and horizontal wind velocities (m s−1) for 37°N latitude centred at 0000 UTC on 18 June. Pressure levels are shown in millibars.