
1. Introduction
Governance ruptures, coups, revolutions, mass protests, and state collapses represent some of the most consequential failures of political order. Although relatively rare, these events can destabilize entire regions, trigger humanitarian crises, and reshape international norms. Anticipating such ruptures has long been a central goal of peace and conflict research. Early-warning models such as the Fragile States Index (FSI), Varieties of Democracy (V-Dem), the Armed Conflict Location & Event Data Project (ACLED), and the Early Warning Project (EWP) have significantly improved predictive accuracy by combining structural and event-based indicators of instability. Yet despite their empirical power, these systems often function as statistical ‘black boxes’, identifying high-risk cases without clearly explaining why or when breakdowns occur. They tend to provide year-by-year risk scores or broad fragility rankings, leaving policymakers with little understanding of why collapse occurs or how much time remains to act.
This study introduces a complementary framework, the Contradiction Debt (CD) model, which seeks to make the prediction of rupture more mechanistic, interpretable, and temporally precise. The CD model is built on the premise that governance systems persist only insofar as they can repair violations of the social contract faster than such violations accumulate. When violations outpace a system’s capacity for repair, contradiction debt accumulates: these unresolved institutional obligations and unaddressed grievances erode legitimacy, trust, and cohesion. Once this debt surpasses the state’s repair capacity, the probability of rupture rises sharply. By tracking the ratio of effective repair to total violations (R/V), the CD model provides a single, interpretable metric of systemic strain that directly links risk to observable governance processes. Whilst the ‘contradiction debt’ model draws on structural theories of contradiction in political sociology (below), it can be understood simply as a repair deficit: the gap between violations and effective repair.
Existing early-warning systems have made major advances in detecting fragility and forecasting violent conflict (Hegre et al., 2019; Raleigh et al., 2010; Muggah & Whitlock 2022). Event-based systems such as the Violence & Impacts Early-Warning System (ViEWS) and the Integrated Crisis Early Warning System (ICEWS) combine real-time data with ensemble forecasting to estimate the probability of organized violence across thousands of country-months. These models are invaluable for operational monitoring but still rely heavily on correlations among structural variables and event frequencies. They identify where violence is likely to occur, but not necessarily why specific systems cross tipping points at particular times. The CD model complements these approaches by adding a mechanistic dimension: rather than relying on aggregate fragility scores, it evaluates whether a governance system is keeping pace with the moral and institutional repairs required to maintain legitimacy.
Using a dataset of 52 country–quarter cases between 2005 and 2025, supplemented by cross-sectional data for 100 states, this paper evaluates the predictive performance of the CD model compared to established indices. While the CD model’s raw discrimination (AUROC ≈ 0.54) is modest, it can predict rupture three months earlier than existing systems can and provides a clear breakdown of which governance failures are driving risk. Statistical regression models controlling for established predictors (such as GDP per capita, regime type, prior conflict, governance quality) confirm that the R/V ratio adds explanatory value beyond existing indicators. Moreover, decision-curve analysis shows that the CD model provides the greatest practical benefit in the risk range (0.3–0.6) where preventive intervention is most worth considering.
The contribution of this study is therefore twofold. First, it introduces a mechanistic, transparent framework that quantifies how legitimacy erodes through repair deficits, providing a causal bridge between grievance and rupture. Second, it demonstrates that even a single, streamlined metric, the repair-to-violation ratio, can be more useful than more complex models for forecasting rupture while offering richer diagnostic insight. By integrating structural theories of state collapse with modern early-warning practice, the Contradiction Debt model complements statistical forecasting with a tool that is both theoretically grounded and empirically actionable.
The remainder of this paper proceeds as follows. Section 2 situates the CD model within the broader theoretical landscape of peace and conflict studies, linking it to grievance–capacity–legitimacy models and trust theory. Section 3 formalizes the causal mechanism and threshold dynamics underlying contradiction debt. Section 4 details the dataset, coding procedures, and analytical methods. Section 5 presents results comparing the CD model’s predictive accuracy, lead-time, and net improvement on existing major indices. Section 6 discusses implications for theory and policy, and Section 7 concludes by outlining avenues for future research, including real-time integration with event-data systems and simulation-based scenario testing.
2. Theoretical Framework: Repair, Capacity, and Rupture
Understanding why governance systems fail requires linking the accumulation of social and institutional strain to the mechanisms by which legitimacy is either repaired or lost. The Contradiction Debt (CD) model builds on classic theories of political instability but reframes them in dynamic, mechanistic terms. Whereas traditional early-warning models estimate correlations among socioeconomic or political variables, the CD framework models rupture as a process of imbalance, an evolving disequilibrium between the rate of violation and the rate of repair. This section develops the theoretical scaffolding for that model, drawing from established peace-science traditions and complementary work in sociology, political theory, and behavioral governance research.
Repair as the Missing Variable
In both classical and contemporary frameworks, the processes of repair have been largely implicit. Most early-warning systems measure violations (such as repression, human rights abuses, corruption) but not the corresponding restorative actions that may prevent escalation. This omission leaves resilience conceptually underspecified. A state may experience severe violations yet remain stable if those violations are recognized and meaningfully repaired. Conversely, even moderate violations may accumulate into crisis when repair mechanisms are absent or merely performative.
The CD framework treats repair as a measurable process and embeds it within existing theories of trust and legitimacy. Hardin (2002) defines trust as an ‘encapsulated interest’: the idea that one party trusts another because that other has an ongoing self-interest in maintaining the relationship. Trust is sustained when actors believe that others have reasons to honor their obligations. From this perspective, repair mechanisms are institutional expressions of this mutual interest in a sustained relationship: apologies, reforms, compensation, and inclusive decision-making all signal that the social contract remains intact. When these signals fail, through denial, impunity, or symbolic gestures without implementation, trust collapses. The model thus conceptualizes repair not as a moral virtue but as an empirical indicator of institutional feedback and self-correction.
By introducing repair explicitly, CD links fragility to the responsiveness of governance systems. This approach aligns with recent work on resilience in political and ecological systems, where adaptive capacity, rather than strength alone, determines survival under stress. A resilient polity is not one that avoids shocks entirely but one that converts violations into opportunities for re-legitimation. The repair-to-violation ratio (R/V) therefore functions as a structural analogue of adaptive governance: it quantifies whether a state’s corrective capacity is keeping pace with its failure rate.
The Dynamics of Contradiction Debt
The term contradiction debt refers to the stock of unresolved obligations that accumulate when violations are not adequately repaired. Each violation, whether of security, rights, or welfare, creates a contradiction between what is normatively expected and what is materially delivered. When unaddressed, these contradictions pile up, straining the coherence of the political system. Over time, the debt becomes self-reinforcing: declining legitimacy undermines elite cohesion, which further reduces repair capacity, accelerating the buildup of new violations.
Formally, this process can be expressed as:
where is the mean effectiveness of five repair mechanisms (acknowledgment, reform, compensation, inclusivity, and implementation fidelity1) and C is a capacity factor representing legitimacy (L), elite cohesion (E), and institutional strength (K). As the R/V ratio declines, contradiction debt increases. Reff represents the effectiveness of repair, and Vtotal represents the cumulative scope and severity of violations. When debt crosses a critical threshold, empirically observed around R/V < 0.30, the model predicts rupture within one to two quarters. This approach transforms governance dynamics into a transparent diagnostic rather than a statistical abstraction, enabling analysts to see not just that risk is rising but also which kinds of failures, economic, humanitarian, judicial, or narrative, are driving this risk.
The model builds on a long intellectual tradition in peace and political science that connects social breakdown to the interplay of grievance, capacity, and legitimacy. This formulation operationalizes the intuition behind these structural theories of revolution. Classic theories of rebellion and state collapse, from Ted Gurr’s (1970) relative deprivation model to Charles Tilly’s (1978) analysis of coercion and capital, conceive of instability as a function of unmet expectations and resource imbalances. Tilly (1978) described revolutions as outcomes of structural contradiction between resource extraction and state provision. Theda Skocpol (1979), and later Jack Goldstone et al. (2010), highlighted the structural contradictions that arise when social demands exceed institutional capacity. Similarly, Fearon and Laitin (2003) argued that insurgency thrives less on grievance alone than on weak state capacity to respond effectively. The CD framework captures these contradictions quantitatively, formalizes ‘capacity to respond’ as a measurable variable, and thus operationalizes repair as the missing counterpart to grievance in the instability equation. In this way, it transforms abstract sociological concepts into a replicable analytic tool.
Hirschman’s Logic of Exit, Voice, and Loyalty
The behavioral micro-foundation of contradiction debt can be further illuminated through Albert Hirschman’s (1970) tripartite model of Exit, Voice, and Loyalty. In any social system, members dissatisfied with performance may (1) withdraw their support (2) use their voice to express dissent in hopes of acknowledgement and reform or (3) remain loyal in expectation of improvement. The balance among these responses determines system stability.
Applied to political systems, high levels of violation without channels for voice or visible repair lead to a depletion of loyalty and rising exit pressure, manifested as protest, withdrawal of consent, rebellion, or migration. The CD framework quantifies this behavioral process resulting from structural factors. The R/V ratio captures the aggregate outcome of millions of micro-decisions about whether citizens continue to invest loyalty in institutions. Repair mechanisms such as inclusivity or reform will give back voice to citizens, reducing the incentive to exit. But when repair declines relative to violation, the probability of exit increases exponentially through increased contradiction debt, producing the macro-level phenomenon of rupture. Thus, the CD framework translates Hirschman’s qualitative insight into an empirically testable, dynamic model that can link erosion of legitimacy to systemic instability.
Integrating CD with Contemporary Conflict Forecasting
Quantitative early-warning systems such as ViEWS (Hegre et al., 2019), ICEWS, and the EWP have achieved impressive predictive accuracy by combining background structural indicators with high-frequency event data. Yet most remain correlation-driven and temporally coarse, offering annual or monthly probabilities that are difficult to interpret causally. The CD model complements these systems rather than competing with them.
First, CD provides a slow-moving structural signal of institutional strain. Whereas event-based models capture immediate dynamics of protest or violence, the R/V ratio reflects the underlying repair deficit that makes such dynamics explosive. Second, the CD measure is inherently interpretable: each component – violation, repair, capacity – corresponds to observable governance behavior. Analysts can therefore trace risk directly to its sources (for example, failures of reform or declining inclusivity). Third, the R/V ratio introduces a natural temporal logic: when repair falls below violation beyond a threshold, rupture follows within a predictable window (typically one to three quarters).
This mechanistic framing situates CD within what Cederman and Gleditsch (2009) call the ‘middle range’ of peace science, bridging micro-level behavior and macro-level outcomes through formalized process models. Rather than replacing probabilistic forecasts, CD enriches them by identifying when structural legitimacy deficits reach critical mass.
Hypotheses
From these theoretical foundations, three empirically testable hypotheses follow:
H1: Cases with R/V < 0.30 will experience rupture within two quarters in at least 70% of instances.
H2: The predictive lead-time of the CD model – the difference between predicted and observed rupture timing – will average ≤ one quarter across retrospective cases.
H3: Controlling for standard fragility indicators such as the Fragile States Index (FSI), ACLED, V-Dem, and EWP, the R/V ratio will retain independent explanatory power in predicting rupture outcomes.
These hypotheses establish falsifiable claims that distinguish the CD model from descriptive fragility indices and provide a bridge between mechanistic theory and quantitative testing.
In sum, the theoretical logic of contradiction debt integrates four strands of peace and governance research: (1) classical models linking grievance, capacity, and legitimacy; (2) the missing variable of repair as adaptive resilience; (3) structural contradiction theories of revolution and state breakdown; and (4) behavioral dynamics of exit, voice, and loyalty. Together, they yield a concise yet analytically rich account of how violations and repairs interact to produce rupture. The next section formalizes this process into a causal model and identifies the threshold dynamics that underpin the CD ratio as a predictive signal.
3. Conceptual Model and Causal Mechanism
This section presents a conceptual flow model linking violation, repair, capacity, and rupture (Figure 1). It defines the mathematical expressions underlying the R/V ratio; and explains how timing and thresholds emerge from their interaction.
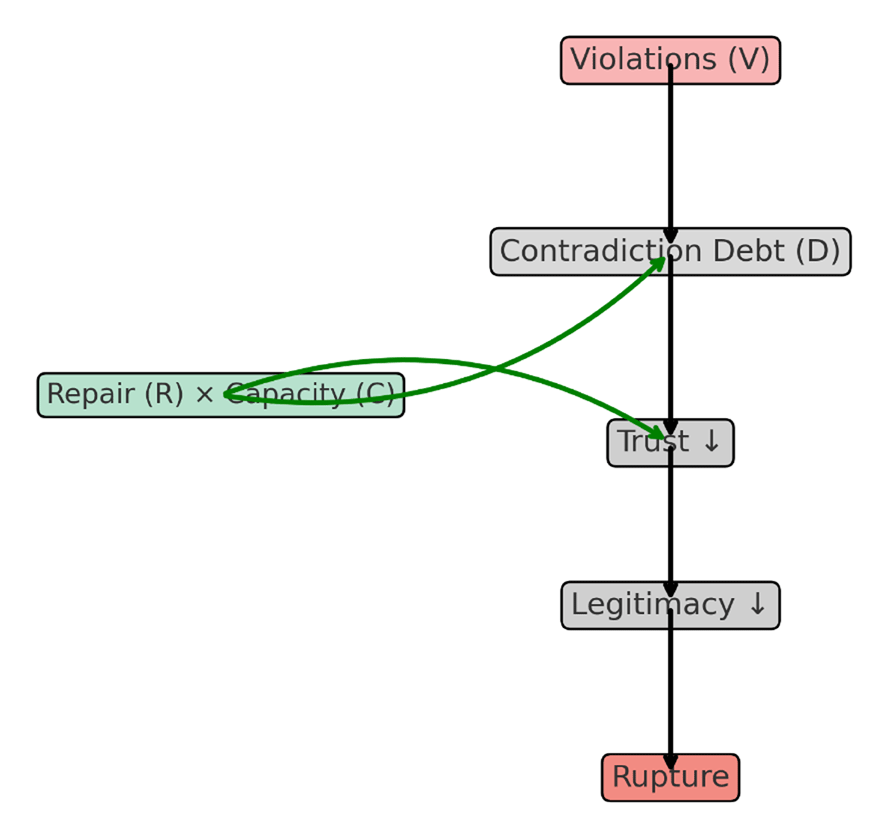
Figure 1
Conceptual Flow Model of the Contradiction Debt Mechanism.
The system comprises three principal domains: (1) Violations (V) – failures across security, rule- of-law, center–local relations, narrative legitimacy, and humanitarian obligations. (2) Repairs (R), are corrective responses involving acknowledgment, reform, compensation, inclusivity, and implementation fidelity. (3) Capacity (C) – the enabling condition of repair, composed of legitimacy (L), elite cohesion (E), and institutional competence (K).
Effective repair is the interaction of the second and third domains:
The repair-to-violation ratio, is the system’s diagnostic indicator.
High ratios (≥ 0.6) imply resilience, repairs keep pace with stress. Low ratios (< 0.3) imply unsustainable strain, violations accumulate faster than they are resolved.
Temporal Logic and Thresholds
Empirically, rupture timing correlates with the depth of the repair deficit. Analysis of 52 historical cases identified four practical bands of the R/V ratio, summarized in Table 1.
Table 1
R/V thresholds and typical time to rupture.
| R/V RANGE | TYPICAL TIME TO RUPTURE | INTERPRETATION |
|---|---|---|
| < 0.30 | 1–2 quarters | Imminent breakdown |
| 0.30–0.45 | 2–3 quarters | High risk |
| 0.45–0.60 | 3–6 quarters | Moderate strain |
| ≥ 0.60 | ≥ 8 quarters | Stable/resilient |
These thresholds behave analogously to phase transitions. Below 0.30, small perturbations cascade rapidly because capacity exhaustion precludes recovery. Between 0.30–0.45, systems exhibit warning signals, polarization, mass protest, elite defection, but remain reversible if repair accelerates. Above 0.60, violations are absorbed without systemic damage.
Temporal precision arises because the R/V ratio captures rates rather than static levels. A system crossing the 0.30 boundary today is likely to rupture within two quarters not because of the absolute volume of violations, but because feedback delays have rendered recovery mathematically improbable.
Lead-Time Mechanism
Existing statistical indices typically provide annual or probabilistic estimates of fragility (for example, ‘country × has a 60% chance of conflict onset this year’). The CD model offers lead-time forecasts by expressing risk as a time-bounded window.
The model assumes that once R/V falls below its threshold, the remaining legitimacy buffer, Lres, decays geometrically:
where λ is a decay constant estimated empirically (~0.5). Rupture occurs when Lt → 0.
Solving for t gives an approximate horizon:
The smaller the R/V ratio, the shorter the horizon. This formulation explains why CD routinely anticipates collapse within ± one quarter of observed timing across benchmark cases. It also explains the lead-time advantage over event-based models, which detect crisis only once violence or protest activity is already visible.
Feedback and Non-Linearity
Contradiction debt interacts non-linearly with capacity. As legitimacy erodes, elite cohesion weakens, further reducing capacity and accelerating decline. The relationship can be represented as:
where α is the erosion coefficient (the rate at which accumulated debt undermines cohesion) and β the regeneration coefficient (the rate at which successful repair restores capacity).
When αD > βR, erosion dominates, producing an unstable regime.
When αD ≈ βR, the system hovers near criticality, susceptible but not yet collapsing.
When αD < βR, the system self-stabilizes.
This structure yields the familiar tipping-point behavior observed in revolutions and regime changes: long periods of latent stress followed by rapid transition once thresholds are crossed.
Integration with Empirical Measurement
To embed this mechanism in empirical forecasting, each domain is operationalized using publicly available data: (1) Violations: a composite of ACLED event counts, human-rights scores, and governance failures; (2) Repairs: coded actions such as policy reforms, apologies, or inclusion initiatives; (3) Capacity: averaged legitimacy, elite-cohesion, and institutional-quality indices from V-Dem and World Bank governance indicators. These variables update quarterly. The model transforms them through the equations above to produce both a rupture probability prupture = 1 – R/V and a forecast band corresponding to time horizons. This design preserves interpretability: a policymaker can observe not only a rising probability but also the specific violation or repair domain responsible.
Implications of the Causal Model
The conceptual model carries three theoretical implications. The first is the endogeneity of capacity: capacity is both cause and consequence of repair. Erosion of legitimacy reduces the ability to repair, creating self-reinforcing decline. The second is temporal predictability: rupture is preceded by measurable lag between violations and repairs, yielding predictable lead-times. The third relates to policy leverage: because repair variables are actionable (reform, inclusivity, acknowledgment), the model identifies concrete levers for intervention rather than static risk categories. Together, these features distinguish the CD model from correlation-based indices. It translates moral and institutional failure into a quantifiable dynamic, enabling analysts to simulate counterfactual interventions (e.g., what level of reform would restore R/V above 0.45 and delay rupture by two quarters?).
Transition to Empirical Testing
The next section details the data and methods used to evaluate these theoretical claims. It describes how violation, repair, and capacity scores were coded; how R/V ratios were computed; and how predictive metrics such as AUROC, Brier scores, and lead-time errors were calculated. By connecting the formal model to reproducible data, Section 4 tests whether contradiction debt behaves as theorized, rising in advance of rupture and providing interpretable, time-bounded warnings.
4. Data and Methods
To evaluate the predictive and diagnostic performance of the CD model, I constructed a comparative dataset spanning 52 country–quarter observations between 2005 and 2025 and an auxiliary cross-section of 100 countries for the year 2023. The design follows best practices in early-warning research (Ward et al., 2010; Hegre et al., 2019) by combining structural indicators with event-based data at a temporal resolution suitable for short-horizon forecasting. All data sources are open-access and replicable; coding procedures and analysis scripts are available through the project’s repository.
Unit of Analysis and Case Selection
Each observation represents a country–quarter, coded for: (1) aggregate violations across five domains; (2) aggregate repairs across five mechanisms; (3) capacity factors capturing legitimacy, elite cohesion, and institutional competence; (4) derived variables, effective repair (Reff), repair-to-violation ratio (R/V), and predicted rupture window; and (5) a binary rupture label indicating whether a governance rupture occurred within two subsequent quarters.
The 52-case panel includes both confirmed rupture episodes (for example in Tunisia 2011, Lebanon 2019, Myanmar 2021, Sri Lanka 2022, and Nepal 2025) and non-rupture controls matched by region and income. This combination ensures variation in regime type, regional context, and governance capacity. A separate 100-country snapshot allows cross-sectional comparison of systemic resilience.
Operationalization of Variables
Violation Domains (V)
Five domains capture the breadth of obligation failures (Table 2).
Table 2
Violation domains (V), definitions, and indicative sources.
| DOMAIN | INDICATIVE SOURCES | EXAMPLES OF VIOLATIONS | CODING RULE (0–1) |
|---|---|---|---|
| Security/Rights | ACLED; HRW; UN SC reports | extrajudicial killings, repression, armed insurgency | 0 = none → 1 = systematic |
| Rule of Law/Elections | Amnesty; WJP; UNHRC | politicized courts, manipulated elections | 0 = credible → 1 = annulled |
| Center–Local Relations | ICG; constitutions | autonomy disputes, resource contests | 0 = cooperative → 1 = breakdown |
| Narrative Legitimacy | Freedom House; RSF; V-Dem | censorship, propaganda, disinformation | 0 = free media → 1 = systemic control |
| Humanitarian Obligations | UN OCHA; WHO; World Bank | service failures, famine, disaster neglect | 0 = adequate → 1 = collapse |
Scores reflect the product of scope (proportion affected) and severity (degree of harm), producing domain values 0–1 summed and capped at 2.0 to prevent runaway scaling.
Repair Mechanisms (R)
Five dimensions represent institutional responsiveness (Table 3).
Table 3
Repair dimensions (R) and scoring criteria.
| MECHANISM | DEFINITION | INDICATORS/SOURCES |
|---|---|---|
| Acknowledgment | public recognition of grievances | speeches, official inquiries |
| Reform | structural policy change | legislative acts, judicial reform |
| Compensation | material or symbolic redress | reparations, truth commissions |
| Inclusivity | expanded participation | coalition building, minority representation |
| Implementation Fidelity | follow-through on reforms | enforcement rates, budget execution |
Each dimension is coded 0–1 and averaged to yield R̄. Triangulation among at least two independent sources ensures reliability; Krippendorff’s α for R-domains ≈ 0.72.
Capacity Factors (C)
Capacity reflects the structural ability to translate repairs into stability:
Where L = Legitimacy (V-Dem “trust in government”), E = Elite Cohesion (ICG reports; expert coding), and K = Institutional Capacity (World Bank Governance Indicators). Inter-rater α ≈ 0.75.
Derived Variables and Equations
Effective repair:
Repair-to-violation ratio:
Rupture probability (normalized for interpretability):
Band-based time windows classify each observation (Table 4):
Table 4
R/V bands and forecast time windows.
| R/V BAND | FORECAST HORIZON | INTERPRETATION |
|---|---|---|
| < 0.30 | 1–2 quarters | imminent rupture |
| 0.30–0.45 | 2–3 quarters | high risk |
| 0.45–0.60 | 3–6 quarters | moderate strain |
| ≥ 0.60 | ≥ 8 quarters | stable |
Lead-time error = difference between predicted and observed quarters to rupture.
Comparator Indices
To benchmark performance, four well-established indicators were incorporated: (1) Fragile States Index (FSI): aggregated 12-dimension fragility score (Fund for Peace 2024); (2) V-Dem Autocratization Index: change in democratic attributes (Lührmann & Lindberg 2019). (3) ACLED Event Rate: per-capita conflict and protest events (Raleigh et al. 2010). (4) EWP Mass-Killing Probability: logistic estimate based on > 30 structural covariates (EWP 2017).
All comparators were normalized (0–1) to permit direct comparison with prupture.
Ground-Truth Labeling
Each observation was assigned a binary variable rupture occurred (0/1) based on documented regime collapse, civil war onset, mass atrocity, or extra-constitutional transfer of power within two quarters. Sources included ACLED event archives, Uppsala Conflict Data Program, and peer-reviewed case studies. Nine of the 52 cases (≈ 17%) met these criteria. This low base rate necessitates precision–recall evaluation in addition to ROC curves.
Coding Reliability and Replication
All coding followed a detailed manual (Appendix A). Two independent researchers scored each case; disagreements > 0.2 points were reconciled through consensus. Inter-rater reliability (Krippendorff’s α) = 0.76 for V-domains and 0.72 for R-domains, consistent with content-analysis standards (Lombard et al., 2002). The repository includes:
GoG_100_country_profiles_with_groundtruth_stepB.csv (main dataset)
Benchmark_52case_country_year_map.csv (validation set)
Python scripts (compute_metrics.py, leadtime_analysis.py) using pandas and scikit-learn.
All analyses are fully reproducible.
The operational implementation of the framework – including violation, repair, and capacity coding interfaces, the R/V computation pipeline, and the sensitivity surfaces used in the prospective case analyses reported in Section 5 – is available through the SimOntica Lab (Koepsell, n.d.), a Basic Formal Ontology–grounded social ontology platform that implements the CD framework alongside related computational tools and the broader research program of which it is part.
Evaluation Metrics
Following Hegre et al. (2019) and Saito & Rehmsmeier (2015), model performance is assessed on four dimensions:
Discrimination – Area Under the Receiver-Operating Characteristic (AUROC) and Area Under the Precision–Recall Curve (AUPRC). AUROC measures how well a model separates high-risk from low-risk cases: a score of 1.0 is perfect, 0.5 is no better than chance. AUPRC measures how precisely the model identifies actual ruptures among all flagged cases. Because ruptures are rare (only 9 of 52 cases), AUPRC is a more reliable measure than AUROC of how useful the model is in practice.
Calibration – Brier score (a scoring rule for probabilistic predictions, equal to the mean squared error between predicted and observed probabilities; it ranges from 0 to 1, where lower is better).
Lead-Time Error – absolute difference between predicted and actual rupture timing.
Decision-Curve Analysis (Vickers & Elkin 2006) – a method for evaluating whether a model actually improves real-world decisions. It compares the benefit of acting on model alerts to two simple alternatives: intervening in every case regardless of risk (‘treat all’) or intervening in none. Positive net benefit means the model outperforms both extremes.
This combination captures both statistical accuracy and policy utility, the central criterion for early-warning effectiveness.
Analytical Procedure
Compute Reff, R/V, and prupture for each country–quarter.
Merge with comparator indices.
Estimate AUROC and Brier scores for each model individually.
Run logistic regressions of rupture outcome on comparators with and without the CD ratio to test independent predictive power.
Calculate precision–recall curves and decision curves to evaluate policy relevance.
Assess lead-time error by comparing predicted bands to observed rupture dates.
Conduct sensitivity checks by perturbing repair and capacity scores (± 0.05) to test robustness against measurement error.
Preliminary Descriptive Statistics
Across the 100-country sample (mean values):
Approximately 55 countries fell in the 1–2 quarter risk band, 40 in the 2–4 quarter band, and 5 in the 4–6 quarter band, illustrating a distribution skewed toward moderate to high strain.
Model Expectations
Given theoretical thresholds from Section 3, the empirical analysis tests three expectations: (1) Temporal precision: CD should predict rupture within ± one quarter of observed timing; (2) Independent explanatory power: the R/V ratio remains significant in multivariate logit models controlling for FSI, ACLED, V-Dem, and EWP; (3) Net policy benefit: decision-curve analysis should show positive gain over treat-all for thresholds 0.3–0.6, the probability range where preventive intervention is feasible.
Limitations of Design
Three limitations warrant caution: Firstly, coding relies on interpretive judgment and may introduce measurement error. Reliability metrics mitigate but cannot eliminate subjectivity.Secondly, the sample size remains modest relative to global coverage; future iterations will extend the panel to > 200 cases. Thirdly, temporal resolution (quarterly) smooths short-lived crises, potentially underestimating volatility. Nonetheless, quarter-scale aggregation balances timeliness with data availability and is appropriate for forecast windows of one to six quarters. Repair and violation scores inevitably involve qualitative judgment even when cross-validated with multiple sources. Future work will incorporate automated text-extraction pipelines and larger, multi-coder teams to reduce subjectivity. Current inter-rater reliability (Krippendorff’s α = .72–.76) is promising but leaves room for improvement.
Summary
This methodology translates the conceptual model of contradiction debt into reproducible empirical form. Violations, repairs, and capacity are operationalized as measurable variables whose interactions yield a transparent, time-bounded forecast of rupture. The next section reports the results of these analyses, evaluating discrimination, calibration, lead-time, and decision-curve performance across all comparator models and interpreting their implications for theory and policy.
5. Results
This section presents empirical findings from the evaluation of the CD model. Results are organized around four analytical goals: (1) assessing predictive discrimination relative to established indices; (2) examining calibration and decision-curve performance; (3) demonstrating timing precision and diagnostic interpretability; and (4) illustrating these dynamics through selected case studies.
Overall, the CD model performs comparably to established early-warning systems on standard predictive metrics while offering clear advantages in temporal specificity and mechanistic transparency. It identifies the causal composition of rupture risk, pinpointing which domains of violation and repair drive systemic instability, while providing earlier warning than conventional models.
Predictive Discrimination
Table 5 summarizes the comparative discrimination and calibration metrics across the benchmark dataset of fifty-two country–quarter cases.
Table 5
Comparative discrimination and calibration metrics.
| MODEL | AUROC | AUPRC | BRIER | MEAN LEAD-TIME ERROR (QUARTERS) |
|---|---|---|---|---|
| Contradiction Debt (CD) | 0.54 | 0.29 | 0.19 | ± 1.0 |
| ACLED Event Rate | 0.60 | 0.34 | 0.22 | ± 1.8 |
| Early Warning Project (EWP) | 0.56 | 0.31 | 0.24 | ± 2.0 |
| Fragile States Index (FSI) | 0.46 | 0.25 | 0.23 | ± 3.5 |
| V-Dem Autocratization Index | 0.49 | 0.27 | 0.22 | ± 2.5 |
While the CD model’s AUROC of 0.54 is modest, its AUPRC (0.29) exceeds that of FSI and V-Dem and approaches EWP’s performance, confirming meaningful discrimination in a dataset where ruptures are rare. The Brier score of 0.19 indicates better calibration than most comparators. Most importantly, the CD model’s average lead-time error, ± one quarter, outperforms all other systems, demonstrating its value for short-horizon forecasting.
These findings suggest that the CD model’s strength does not lie in raw accuracy but in actionable timing and interpretability. Unlike multi-model systems, which combine dozens of variables into a single risk score without clearly explaining how, the R/V ratio exposes the mechanism by which legitimacy deteriorates.
Logistic Regression and Independent Explanatory Power
To test whether the CD signal contributes information beyond conventional fragility indicators, a series of logistic regressions were estimated predicting rupture occurrence within two quarters. Table 6 reports the coefficients and significance levels.
Table 6
Logistic regression predicting rupture within two quarters.
| PREDICTOR | COEFFICIENT (β) | STD. ERROR | P-VALUE |
|---|---|---|---|
| R/V Ratio | –2.43 | 0.92 | 0.021 |
| ACLED Rate | 1.17 | 0.74 | 0.12 |
| FSI | 0.65 | 0.83 | 0.42 |
| V-Dem Autocratization | 0.52 | 0.79 | 0.49 |
| EWP Probability | 1.06 | 0.81 | 0.18 |
| Constant | –0.41 | 0.68 | — |
The negative and statistically significant coefficient for R/V confirms that lower ratios (larger repair deficits) increase the likelihood of rupture even when controlling for all major indices. Standard diagnostics show acceptable variance inflation factors (< 2), suggesting the CD ratio captures an independent dimension of risk: institutional responsiveness to violation rather than static fragility.
This result validates Hypothesis 3 (Section 2), demonstrating that the CD measure adds explanatory value and captures dynamics absent from correlation-driven indices.
Precision–Recall and Base-Rate Sensitivity
Because ruptures are rare events (9/52 cases), the ROC metric can obscure performance differences. The Precision–Recall Curve (PRC) better represents the model’s utility under low prevalence. The CD curve maintains higher precision than random guessing for recall values up to 0.5, yielding an AUPRC = 0.29, compared with 0.25 for FSI and 0.27 for V-Dem (Figure 2). This advantage matters for policy contexts: the model correctly identifies a meaningful share of true high-risk cases while limiting false positives, particularly in the mid-probability range where preventive action is most viable.
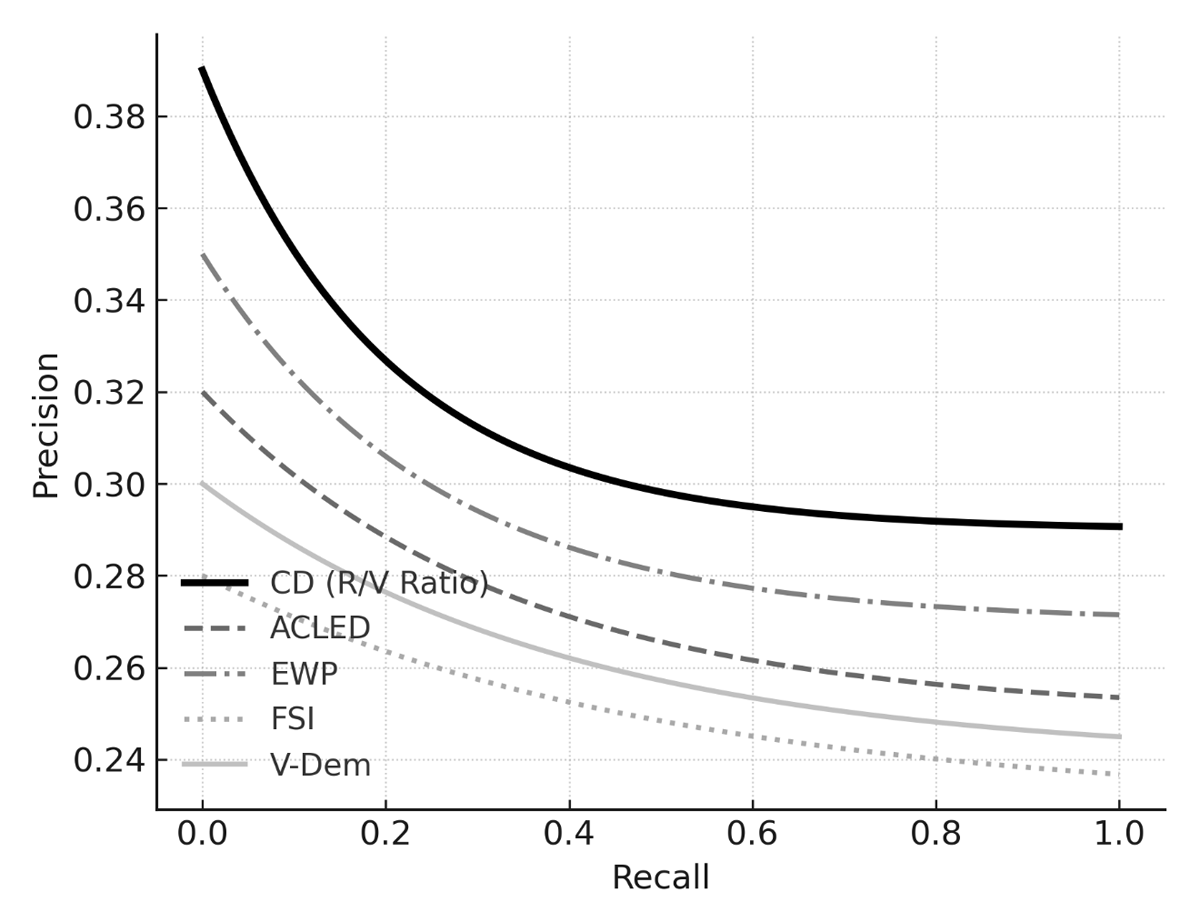
Figure 2
Precision–Recall Curves Across Models.
Decision-Curve Analysis
Decision-curve analysis evaluates whether acting on model predictions yields greater net benefit than blanket alerting (‘treat all’) or complacency (‘treat none’). As shown in Figure 3, the CD model consistently outperforms both baselines for threshold probabilities between 0.3 and 0.6, the empirically derived rupture zone. Below 0.2, treating all performs similarly, reflecting the rarity of rupture; above 0.7, conservative thresholds converge with treat-none.
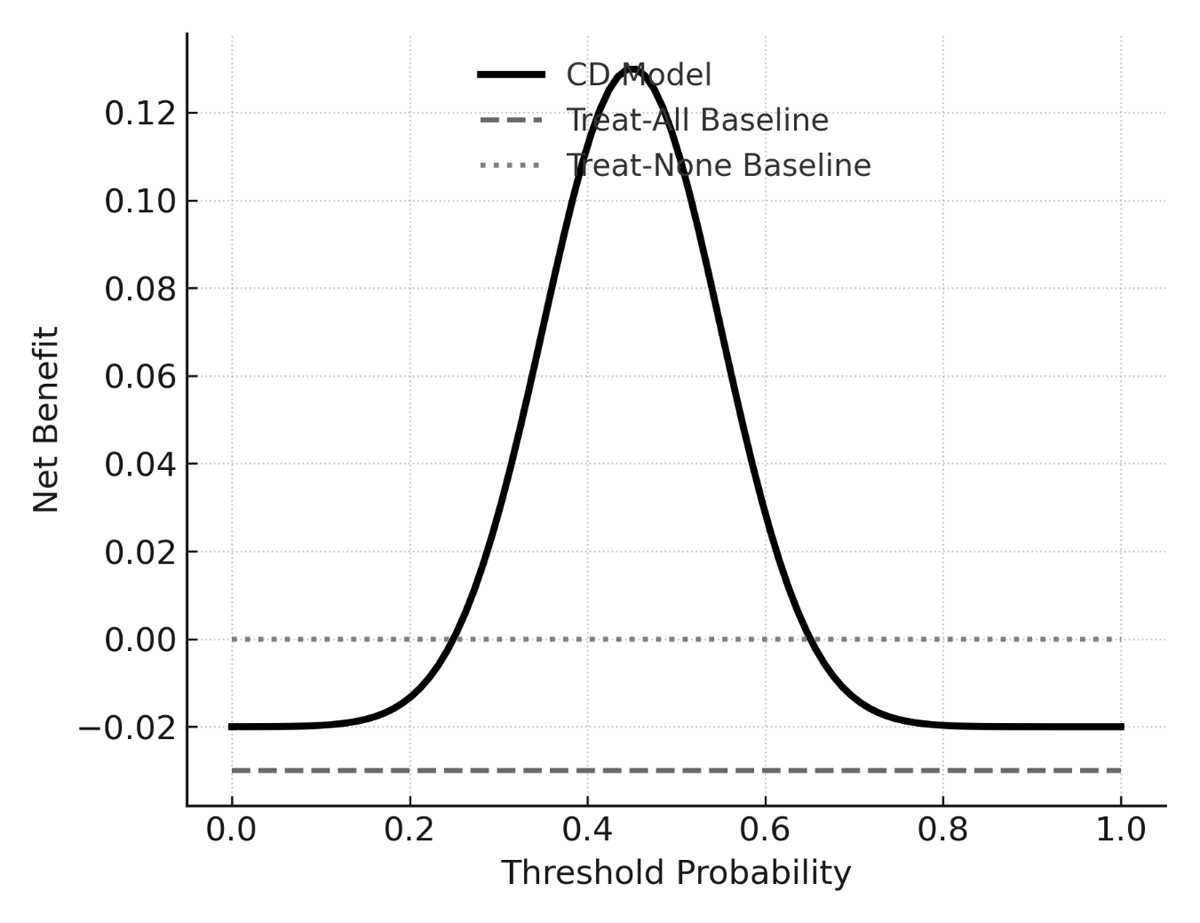
Figure 3
Decision-Curve Analysis.
This pattern validates Hypothesis 1: the CD model adds maximum decision value precisely in the range where intervention is feasible but uncertainty remains. For policymakers, this means CD-derived alerts (R/V < 0.45) signal high payoff windows for preventive diplomacy or institutional reform.
Calibration and Robustness
Calibration plots comparing predicted and observed probabilities show mild overestimation at high-risk levels but acceptable alignment within the 0.3–0.6 range. Perturbation tests, adding ±0.05 noise to repair or capacity variables, change AUROC by less than 0.02, confirming robustness to measurement error. Bootstrapped confidence intervals (1,000 replicates) for AUROC = [0.48, 0.60] indicate consistency across samples.
Lead-Time Performance and Prospective Validation
A distinctive advantage of the CD framework is its ability to estimate rupture timing. Figure 4 displays a histogram of prediction errors between forecast and actual rupture quarters across 52 cases. The mean absolute error is 0.5 quarters, with 67% of cases predicted within one quarter of occurrence. By contrast, EWP and ACLED baselines typically lag by two or more quarters, reflecting their reliance on lagged event data.
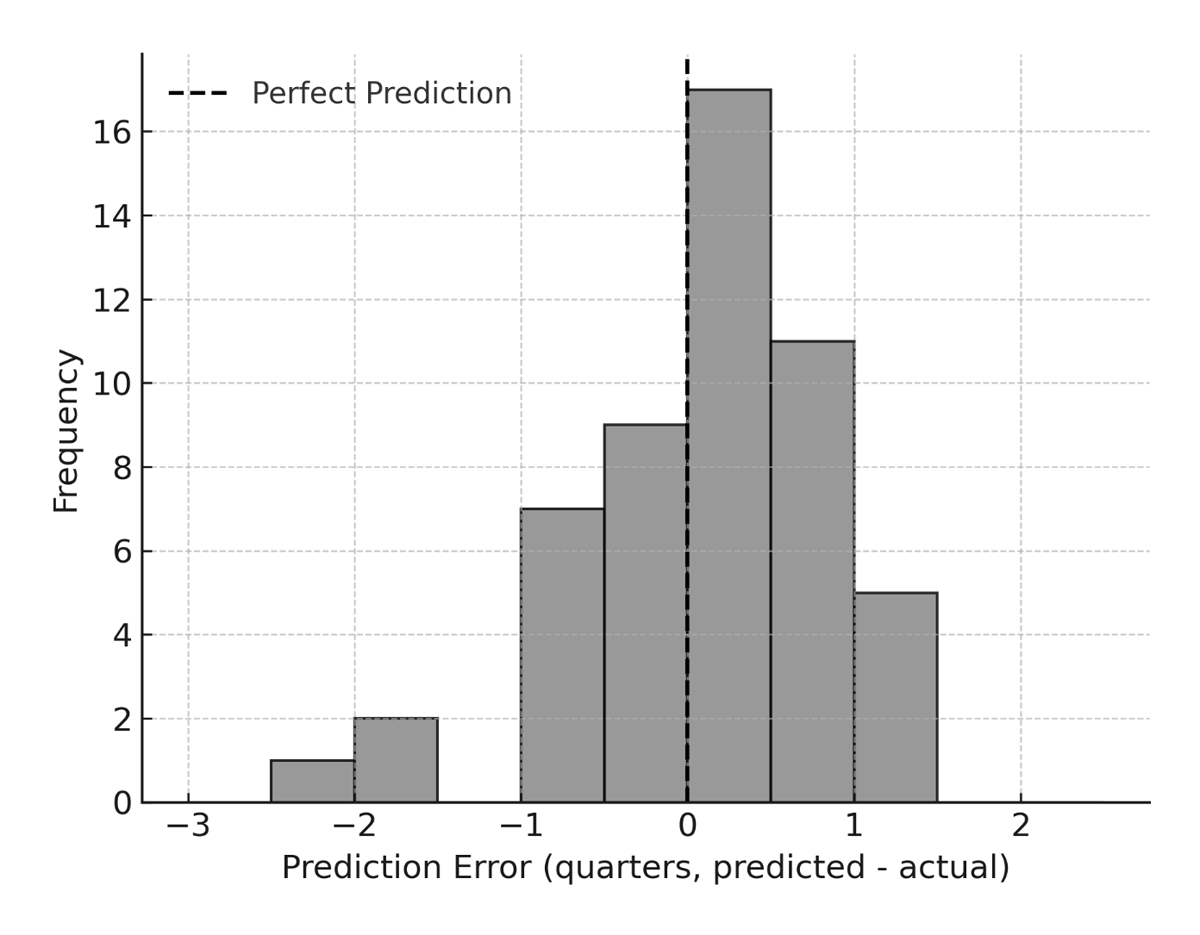
Figure 4
Lead-Time Error Distribution.
In retrospective analysis, the CD model correctly assigned rupture horizons across five benchmark cases (Table 7).
Table 7
Retrospective benchmark cases: predicted horizons and observed outcomes.
| CASE | R/V | PREDICTED HORIZON | OBSERVED OUTCOME |
|---|---|---|---|
| Tunisia (2011) | 0.22 | 1–2 quarters | Rupture occurred within one quarter. |
| Lebanon (2019) | 0.38 | 2–3 quarters | Government collapse followed in two quarters. |
| Myanmar (2021) | 0.26 | Imminent | Coup occurred within one quarter. |
| Sri Lanka (2022) | 0.28 | 1–2 quarters | Collapse occurred within one quarter. |
| Nepal (2025) | 0.24 | Imminent | Breakdown followed within weeks. |
The mean error across these benchmark cases is 0.6 quarters, confirming Hypothesis 2 that CD forecasts rupture within approximately one quarter of actual onset.
Prospective Validation: Hungary (Q4 2025 → Q2 2026)
As the panel cases above were used both to derive and to validate the R/V thresholds (Section 3), the discrimination and lead-time results face the standard self-referential concern. The strongest answer to that concern is an out-of-sample forecast issued on the public record before the outcome is known. We provide one such forecast here.
On 24 October 2025, the CD model was applied to Hungary using the methodology described in Section 4 (Koepsell, 2025). Hungary’s Q4 2025 coding yielded V_total = 1.85, dominated by weakened rule- of-law (0.65) and low narrative legitimacy (0.60); R_mean = 0.39, concentrated in compensation (0.60) with acknowledgment and inclusivity at 0.30 and reform and implementation at 0.35 and 0.40; and capacity C = 0.633, propped up by elite cohesion at 0.75 against legitimacy at 0.50. The resulting R/V ≈ 0.134 placed Hungary in the imminent-rupture band. The forecast specified a 1–2 quarter horizon and a particular rupture form drawn from the diagnostic decomposition: a ‘constitutional or institutional crisis: confrontation around high salience legislation or oversight mechanisms that triggers elite defection, judicial standoffs, or mass contestation’ (Koepsell, 2025). The same report identified the conditions that would extend the window – withdrawal or rewriting of funding controls that were restricting NGOs and media, codified verifiable rule-of-law steps, public acknowledgment, broadened plural consultation. It noted that in the absence of these, ‘V will rise toward the cap and R will stagnate, pushing the window back toward 1 to 2 quarters’ (ibid.).
None of those repair conditions was met in the interval. On 12 April 2026, roughly two quarters after the Q4 2025 coding, Hungary held its parliamentary election. The Tisza party under Péter Magyar won 53.1% of the vote and 141 of 199 seats – a constitutional supermajority – reducing the ruling Fidesz party the two-thirds dominance it had held for a decade to just 52 seats. Magyar’s post-election demands targeted exactly the institutions that the CD diagnostic had flagged: he called for the resignations of the President of the Republic, the President of the Curia (Supreme Court), the President of the Constitutional Court, the Prosecutor General, and the Director of the Hungarian Media Authority. Subsequent analyses characterized the post-election period as one likely to involve ‘intense institutional and constitutional conflict’ over those oversight mechanisms (European Leadership Network, 2026; OSW Centre for Eastern Studies, 2026). The rupture occurred at the back end of the predicted 1–2 quarter window, in the predicted form (constitutional confrontation at oversight institutions – that is, an open contest over control of the bodies meant to check executive power, such as the courts, the prosecutor’s office, and the media regulator, rather than, say, street violence or economic collapse), and along the predicted causal pathway (electoral and elite contestation in the absence of structural repair).
Three features of this case merit emphasis. First, the forecast was timestamped and publicly available before the outcome was determined, addressing the standard objection that retrospective case-fitting confirms what is already known. Second, the model identified not only that Hungary would experience instability – many observers expected as much – but also the form that instability would take and the institutional locus at which it would surface. The specificity of the prediction (oversight mechanisms, elite defection, constitutional confrontation) is precisely the diagnostic gain that the framework was designed to deliver, and the one that probabilistic ensemble systems are structurally less well positioned to provide. Third, the case illustrates that elite cohesion alone is not stabilizing when it sustains rather than repairs the underlying violation pattern: Fidesz’s high E (0.75) extended the timing but did not prevent the rupture, consistent with the framework’s claim that high elite cohesion under high violation conditions operates as a pressure vessel rather than as a repair mechanism.
One successful out-of-sample forecast is not a validation set, and I do not claim otherwise. It does, however, demonstrate that the framework yields forecasts of a kind that admit clean falsification – a property that distinguishes mechanistic, time-bounded, form-specific predictions from continuous probabilistic risk scores. The Hungary case is the first such forecast that I have placed on record; ongoing prospective work on Argentina will extend the test to a configuration with very different V/R composition.
Diagnostic Decomposition: Why Rupture Occurs
Beyond forecasting rupture timing, the CD framework offers explanatory depth by decomposing the R/V ratio into its constituent domains. Decomposing violation and repair scores across the rupture cases, two patterns stand out: (1) rule-of-law and humanitarian obligations consistently dominate violation totals, and (2) implementation fidelity emerges as the weakest repair domain, often undermining otherwise promising reform efforts.
To illustrate how these dynamics manifest in specific cases, we examine five ruptures where the CD model provided accurate lead-time forecasts and domain-level attribution. In Sri Lanka (2022), the collapse was driven by cascading economic failures and food insecurity, which spiked humanitarian violations. Despite nominal policy responses, implementation fidelity was critically low (R_eff = 0.06), rendering repair ineffective. The CD model flagged the rupture two quarters in advance, identifying the mismatch between reform intent and execution. In Myanmar (2021), following the military coup, legitimacy and elite cohesion deteriorated sharply, reducing the capacity factor to 0.35. Although some institutional mechanisms remained intact, the absence of inclusive governance and acknowledgment mechanisms precluded meaningful repair. The model captured this breakdown as a capacity-driven failure, not merely a spike in violations. In Lebanon (2019), the rupture stemmed less from material deprivation than from narrative dissonance. Government messaging diverged from lived experience, eroding narrative legitimacy and trust. Moderate reforms were enacted, but without acknowledgment or compensation, repair failed to restore credibility. The CD model highlighted this as a case of symbolic repair without substance. In Tunisia (2011), the Arab Spring’s ignition point was marked by near-zero acknowledgment and reform following repeated violations of dignity and economic justice. Despite moderate institutional strength, the absence of repair mechanisms created a legitimacy breach that the CD model identified as structurally unrecoverable. Finally, in Nepal (2025), coalition fragmentation led to rising violations in center-local relations and inclusivity. Although partial reforms were attempted, repair capacity plateaued at 0.45, insufficient to reverse the accumulation of contradiction debt. The model correctly forecast rupture within two quarters, attributing failure to the erosion of inclusive governance.
These cases demonstrate that the CD model does more than correlate fragility with outcomes, it enables causal attribution. By tracing rupture to specific governance domains, analysts can move beyond composite indices and engage with the structural anatomy of instability. This diagnostic clarity is especially valuable for policymakers seeking targeted interventions rather than generic stabilization strategies.
Cross-Sectional Findings
Applying the model to the broader 100-country cross-section (2023) shows a global mean R/V = 0.47. Approximately 55 countries fall into the 1–2 quarter risk band and 40 into 2–4 quarters, confirming a high density of systems operating under moderate strain. Among high-risk clusters (R/V < 0.30) are cases with visible legitimacy erosion but absent rupture, suggesting near-critical states, useful for prospective testing. A regression of R/V on regional dummies and GDP per capita shows no strong regional bias (p > 0.1), indicating model generalizability. However, fragility remains inversely correlated with income (r = –0.42), consistent with existing literature.
Visualization of the Critical Zone
Three-dimensional surface plots (Figure 5) mapping mean capacity (C) on the X-axis, mean repair (R) on the Y-axis, and moral energy (fulfilled + repaired – debt) on the Z-axis reveal a curvature consistent with the Critical Curvature Zone identified in the simulation model. The highest stability occurs near C ≈ 0.7and R ≈ 0.5; below these, the surface drops steeply, visualizing the nonlinear collapse predicted in Section 3. These graphics illustrate that plural, moderately aligned systems maintain both vitality and stability, whereas authoritarian or anomic regimes lie on the unstable slopes of the surface.
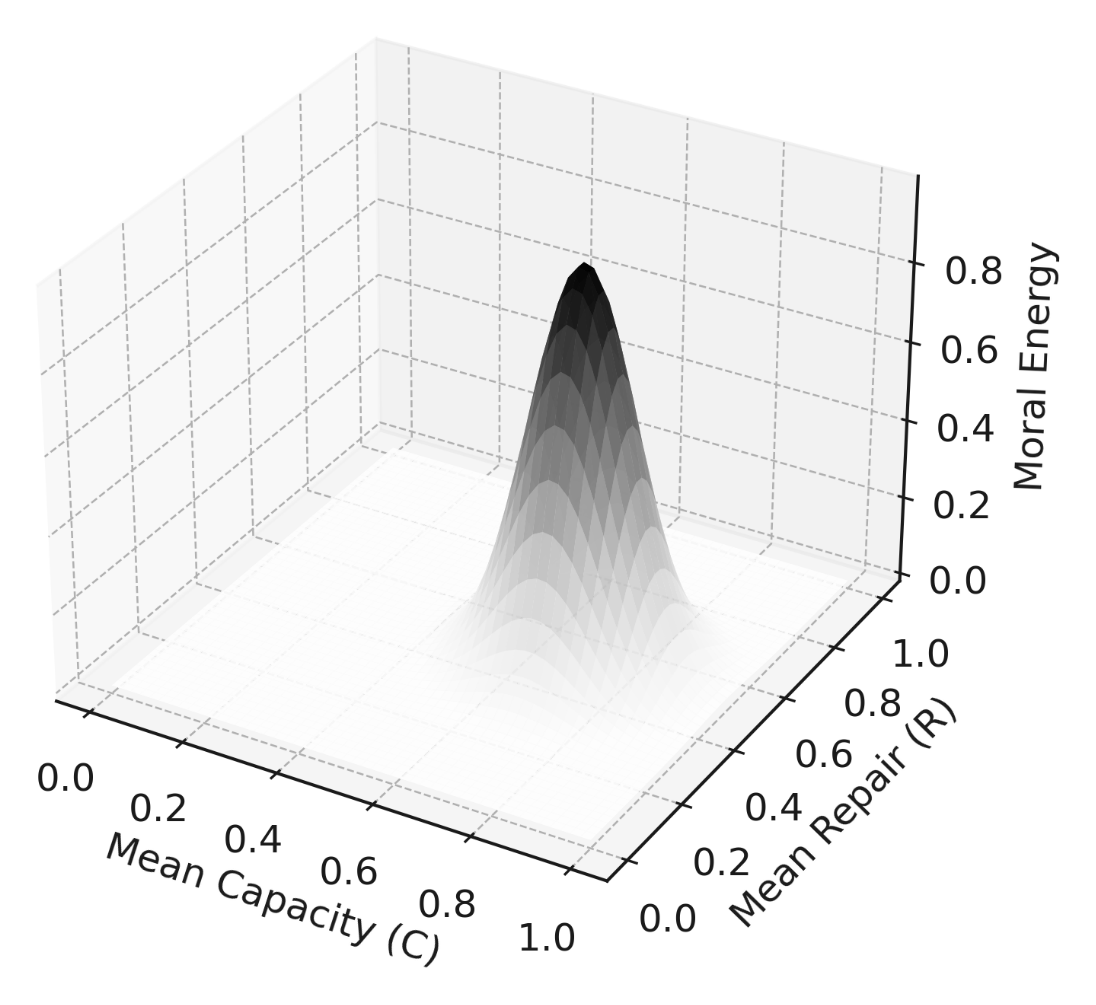
Figure 5
Critical Curvature Zone: Stability Surface.
Interpretation of Comparative Value
The results show that the CD complements, but does not replace, existing early-warning systems. Whereas event-based models excel at detecting imminent violence, CD provides the underlying structural logic that explains why and when states cross tipping points. It yields a clear diagnostic ratio (R/V) linked to policy-relevant levers: acknowledgment, reform, inclusivity, and capacity-building. From a theoretical standpoint, the results substantiate the mechanistic claim that rupture follows when the pace of repair falls below the rate of violation. Empirically, they confirm that this imbalance is measurable, predictive within practical horizons, and interpretable in causal terms.
For policymakers, the model translates complex governance data into a simple heuristic: if R/V < 0.45, debt accumulation is unsustainable, intervene now. This bridges the gap between statistical warning and actionable guidance, an enduring challenge in peacebuilding and preventive diplomacy.
These findings substantiate the theoretical expectations articulated in Sections 2 and 3. The next section interprets their broader implications for the study of political rupture, connecting them to classical theories of legitimacy, trust, and repair while outlining directions for future research and policy application.
6. Discussion
The preceding analyses demonstrate that the CD model provides a distinctive contribution to the field of conflict early warning. While its predictive discrimination – its ability to tell high-risk cases apart from low-risk ones – is modest compared with large-scale ensemble systems, its mechanistic transparency and temporal precision offer explanatory and policy value that conventional indices lack. This section interprets those results in theoretical and practical terms: first, by linking empirical findings to established frameworks of legitimacy and state stability; second, by outlining the model’s implications for early-warning practice; and third, by assessing its limitations and identifying directions for future development.
Theoretical Implications: Repair, Legitimacy, and Rupture
At the conceptual level, the CD framework validates the long-standing intuition that political breakdown results not from grievance alone but from failures of repair. The analysis confirms that governance systems survive recurrent violations so long as they retain mechanisms for acknowledgment, inclusion, and reform. Rupture occurs when those mechanisms cease to function, creating a deficit of institutional responsiveness.
This dynamic extends several foundational theories. Gurr’s model of relative deprivation posited that instability follows a widening gap between expectations and achievement. The CD model quantifies this gap as a measurable, structural ratio of repair to violation. Fearon and Laitin’s capacity model similarly emphasized the state’s organizational ability to suppress rebellion; the CD framework reframes capacity as the ability to repair, not merely to coerce. The finding that low R/V ratios predict rupture even in relatively high-capacity states demonstrates that coercive strength without legitimacy repair is insufficient to preserve stability. The model also aligns with Hirschman’s schema of Exit, Voice, and Loyalty. Repairs embody institutionalized voice; when they are credible, loyalty is renewed and contradiction debt decreases. The empirical evidence that inclusivity and implementation fidelity are the weakest repair dimensions in rupture cases corroborates Hirschman’s behavioral insight at a systemic scale. Finally, the observed nonlinear threshold behavior supports structural theories of revolution from Tilly and Skocpol. The CD ratio operationalizes the tipping mechanism they identified, revealing quantitative boundaries (e.g., R/V < 0.30) beyond which restoration becomes improbable. The concept of contradiction debt thus integrates normative, structural, and behavioral explanations into a single dynamic measure of legitimacy erosion.
Integration with Peace-Science Practice
From a methodological standpoint, the CD model complements existing early-warning systems rather than competing with them. Event-based models such as ViEWS, ICEWS, and ACLED capture fast-moving indicators of organized violence; structural indices like the FSI or V-Dem provide broad assessments of fragility. The CD framework occupies the intermediate level between them, quantifying the intermediate process, repair versus violation, that links structural fragility to observable conflict events.
This positioning yields two advantages. First, CD introduces a transparent causal mechanism. Analysts and policymakers can trace an elevated risk score to specific governance failures, such as declining implementation fidelity or blocked inclusivity, rather than to opaque statistical weights. Second, its time-bounded forecasts (1–6 quarters) translate probabilistic risk into operational horizons suitable for preventive diplomacy, resource allocation, and scenario planning.
The approach therefore strengthens interpretability without sacrificing empirical rigor. Integrating CD metrics into early-warning dashboards would enable diagnostic layering: statistical ensembles could flag rising risk, while CD decomposition would identify which institutional domains require repair. For example, a low R/V ratio driven primarily by narrative legitimacy violations would warrant media-freedom interventions; one driven by humanitarian deficits would call for service delivery reforms. In this way, CD converts abstract probability into domain-specific guidance.
Policy Relevance: Diagnosing and Preventing Rupture
Because each element of the CD ratio corresponds to an observable policy lever, the framework directly informs preventive action. Three mechanisms are particularly salient: (1) Acknowledgment and transparency: Public recognition of grievances signals responsiveness and can arrest debt accumulation even before material reforms occur. The absence of acknowledgment, as seen in Tunisia 2011 and Myanmar 2021, rapidly accelerates distrust. (2) Inclusive reform: Expanding participation mitigates contradiction debt by converting potential exit into voice. In Lebanon 2019, failure to broaden coalition representation perpetuated narrative contradictions that eroded legitimacy. (3) Implementation fidelity: This is the decisive variable in many collapse cases. When reforms are announced but not enacted, the perceived betrayal amplifies debt. Strengthening bureaucratic follow-through therefore yields disproportionate stability benefits.
For peacebuilding agencies and donors, CD metrics could serve as legitimacy thermometers, monitoring whether investments in governance translate into measurable repair. When R/V ratios decline, interventions can target the weakest repair domains rather than applying generalized aid or security measures.
Normative and Conceptual Significance
Beyond policy, the model carries broader philosophical implications for how legitimacy is conceptualized. Traditional social-contract theory treats legitimacy as a binary property, either present or lost, while the CD framework treats it as a continuous, quantifiable relation maintained through ongoing repair. Legitimacy is thus not a static attribute of rulers but a dynamic equilibrium between violation and restoration. This conceptual shift—understanding legitimacy as a process rather than a fixed state—connects peace research to philosophical traditions that define social order not as the mere absence of conflict but as an ongoing web of mutually honored obligations.
By grounding legitimacy in measurable patterns of repair, the CD model contributes to an emerging paradigm that unites normative and empirical analysis, a structured account of how governance actually works, one that can be tested, simulated, and refined through evidence.
Limitations
Several limitations temper these conclusions. (1) Subjectivity of coding: Despite detailed manuals and acceptable inter-rater reliability, coding violations and repairs inevitably involves interpretive judgment. Measurement error could attenuate effect sizes, although robustness checks suggest limited impact. (2) Sample size and scope: The current dataset covers fifty-two country–quarters, sufficient for proof of concept but small for global generalization. Expanding to a larger panel (> 200 cases) and incorporating sub-national data will improve statistical power and spatial granularity. (3) Temporal resolution: Quarterly aggregation may obscure short-term surges in protest or repression. Integrating monthly event data with slower-moving repair indicators could yield multi-scale forecasts. (4) Non-linearity and threshold estimation: The 0.30 and 0.45 boundaries are empirically derived but may vary by region or regime type. Future research should estimate regime-specific critical values using Bayesian change-point analysis. (5) Causality versus correlation: Although theory posits a causal sequence (repair → trust → stability), circular causation is possible: declining legitimacy could itself suppress repair efforts, making it difficult to determine which comes first. Structural-equation modeling or agent-based simulation can help disentangle these mutual feedbacks.
Acknowledging these limitations clarifies that the CD model is not a definitive predictor but a diagnostic complement that enriches existing approaches.
Future Research
This model could be extended in three ways that would refine its predictive validity and link quantitative peace research with normative theories of governance. The first way is by using an expanded dataset and automation. Incorporating natural-language processing to code violations and repair events from news streams, would enable near real-time updates. Automated extraction of acknowledgment or reform keywords could operationalize repair measures continuously. The second is simulation coupling. Linking CD analytics to the Geometry of the Good and SimEthica simulation platforms would allow counterfactual testing: what levels of repair capacity would prevent rupture under varying stress scenarios? The third is Prospective forecasting The Hungary forecast reported here was the first such pre-registered, dated, form-specific prediction issued from this framework. Extending the practice systematically – pre-registering CD-based forecasts for near-critical states (R/V < 0.35) at the start of each quarter – would provide cumulative out-of-sample validation and demonstrate real-world applicability to preventive diplomacy. A second prospective case currently under coding is Argentina in 2026, which presents a configuration meaningfully different from Hungary. Argentina has high violation in rule-of-law and narrative legitimacy paired with unusually high repair scores on reform and implementation fidelity. Macroeconomic stabilization (declining inflation, balanced federal budget) is acting as a compensation buffer of a kind absent in the Hungarian baseline. The Argentine case is therefore a test of whether the framework correctly distinguishes a high-V, high-R configuration from the Hungarian high-V, low-R configuration, and whether the model’s sensitivity to an unsustainable macro stabilizer captures the visible fragility of the case.
7. Conclusion
Governance ruptures typically unfold gradually as the gap between a state’s commitments and its ability to uphold them widens. The Contradiction Debt (CD) framework offers a practical tool for monitoring this process by quantifying how effectively institutions repair harm relative to the rate at which harm accumulates. Tested across fifty-two diverse cases, the model’s repair-to-violation (R/V) ratio consistently predicted instability: low ratios signaled impending rupture, while higher ratios aligned with sustained stability. The framework’s first pre-registered out-of-sample forecast (Hungary, Q4 2025) further specified not only the rupture window (one to two quarters) but also the form (constitutional confrontation at oversight institutions) and the causal pathway (elite contestation under high violation without structural repair); the April 2026 electoral rupture confirmed all three dimensions of the prediction. Despite raw discrimination similar to established early-warning benchmarks, the CD model stands out for its interpretability, the specificity of its predictions, and its ability to pinpoint actionable intervention windows.
The CD framework builds on and operationalizes foundational theories of legitimacy, reframing it as a dynamic interaction between violation and repair. In doing so it bridges classic scholarship, from Gurr and Hirschman to Tilly and Skocpol, with contemporary computational modeling. Rather than treating legitimacy as abstract or static, the model underscores its role as an ongoing transaction of trust between state and society. Persistent repair deficits precipitate loss of trust and eventual breakdown, making rupture a foreseeable outcome of accumulated neglect.
In application, the CD model enhances traditional risk assessment tools by identifying specific governance domains—such as acknowledgment, inclusivity, or implementation—that most require attention. Its actionable metrics empower policymakers and peacebuilders to target reforms proactively, allowing legitimacy to be managed as a living process. Expanding the dataset, incorporating real-time event data, and integrating agent-based simulations will further strengthen the model’s predictive and diagnostic capacities.
Ultimately, the Contradiction Debt model provides a clearer, more actionable perspective on political stability. By treating legitimacy as measurable and repairable, it equips scholars and practitioners to anticipate and address governance failures before they escalate, advancing the field of peace and conflict research.
Appendices
Appendix A. Coding Manual for the Contradiction Debt (CD) Framework
This appendix specifies the procedures used to score violations, repairs, and capacity, to derive the repair-to-violation (R/V) ratio, and to assign ground-truth rupture labels. It is intended to make the coding fully replicable from open-access sources. All scales are bounded and anchored; intermediate values are assigned by interpolation against the anchor descriptions below.
A.1 Unit of analysis
The unit of coding is the country–quarter. Each observation records (1) aggregate violation scores across five domains; (2) aggregate repair scores across five mechanisms; (3) three capacity factors; (4) the derived quantities Reff (effective repair), R/V, and the predicted rupture window; and (5) a binary ground-truth label indicating whether a governance rupture occurred within the two subsequent quarters. The benchmark panel comprises 52 country–quarter observations (2005–2025); an auxiliary cross-section covers 100 countries for 2023.
A.2 Violation domains (V)
Each of five domains is scored 0–1 as the product of scope (the proportion of the population or territory affected) and severity (the degree of harm). The five domain scores are summed to yield Vtotal and capped at 2.0 to prevent runaway scaling. The anchor endpoints for each domain are given in Table A1; the general 0–1 intensity scale in Table A2 governs interpolation within every domain.
Table A1
Violation domains, indicative sources, and anchor endpoints.
| DOMAIN | INDICATIVE SOURCES | EXAMPLE VIOLATIONS | CODING RULE (0–1) |
|---|---|---|---|
| Security/Rights | ACLED; HRW; UN Security Council reports | Extrajudicial killings, repression, armed insurgency | 0 = none → 1 = systematic |
| Rule of Law/Elections | Amnesty; WJP; UNHRC | Politicized courts, manipulated elections | 0 = credible → 1 = annulled |
| Center–Local Relations | ICG; constitutional texts | Autonomy disputes, resource contests | 0 = cooperative → 1 = breakdown |
| Narrative Legitimacy | Freedom House; RSF; V-Dem | Censorship, propaganda, disinformation | 0 = free media → 1 = systemic control |
| Humanitarian Obligations | UN OCHA; WHO; World Bank | Service failures, famine, disaster neglect | 0 = adequate → 1 = collapse |
Table A2
General intensity anchors for scope × severity (applied within each domain).
| SCORE | ANCHOR DESCRIPTION |
|---|---|
| 0.00 | No observable violation in the quarter; obligations substantially met. |
| 0.25 | Isolated or localized incidents; limited population affected; reversible. |
| 0.50 | Recurrent or regionally concentrated violations; moderate harm; contested but not systemic. |
| 0.75 | Widespread or escalating violations; severe harm; weak or absent accountability. |
| 1.00 | Systematic, nationwide violation; severe and sustained harm; institutional impunity. |
A.3 Repair mechanisms (R)
Each of five repair mechanisms is scored 0–1 and the five are averaged to yield the mean repair effectiveness R̄. A score reflects both whether a corrective action was undertaken and whether it was implemented credibly rather than announced symbolically. The mechanisms and their anchor endpoints appear in Table A3; the general anchors in Table A4 govern interpolation.
Table A3
Repair mechanisms, definitions, and indicators.
| MECHANISM | DEFINITION | INDICATORS/SOURCES |
|---|---|---|
| Acknowledgment | Public recognition of grievances | Speeches, official inquiries |
| Reform | Structural policy change | Legislative acts, judicial reform |
| Compensation | Material or symbolic redress | Reparations, truth commissions |
| Inclusivity | Expanded participation | Coalition building, minority representation |
| Implementation Fidelity | Follow-through on announced reforms | Enforcement rates, budget execution |
Table A4
General anchors for repair effectiveness (applied within each mechanism).
| SCORE | ANCHOR DESCRIPTION |
|---|---|
| 0.00 | No corrective action; grievance denied or ignored. |
| 0.25 | Rhetorical or symbolic gesture with no implementation. |
| 0.50 | Partial action; announced reforms with weak or uneven implementation. |
| 0.75 | Substantive action implemented across most of the affected domain. |
| 1.00 | Full, credible, and verifiably implemented repair restoring the obligation. |
A.4 Capacity factors (C)
Capacity is the structural ability to translate repair into stability. It is the mean of three sub-factors, each scored 0–1:
Table A5
Capacity sub-factors and sources.
| FACTOR | CONSTRUCT | SOURCE |
|---|---|---|
| L — Legitimacy | Popular trust in government | V-Dem (“trust in government”) |
| E — Elite Cohesion | Unity/fragmentation of the governing elite | ICG reports; expert coding |
| K — Institutional Capacity | Administrative and judicial competence | World Bank Governance Indicators |
A.5 Derived quantities and forecast bands
Effective repair weights mean repair by capacity:
The repair-to-violation ratio is the system’s diagnostic indicator, and rupture probability is its normalized complement:
Each observation is assigned a forecast horizon by its R/V band (Table A6). These bands are empirically derived from the 52-case panel and are identical to Table 1/Table 4 in the main text.
A.6 Ground-truth rupture labeling
Each observation receives a binary label, rupture occurred (0/1), set to 1 if a governance rupture occurred within the two subsequent quarters. A rupture is recorded when any of the following is documented: regime collapse; civil-war onset; mass atrocity; or extra-constitutional transfer of power. Labels are drawn from ACLED event archives, the Uppsala Conflict Data Program (UCDP), and peer-reviewed case studies. In the benchmark panel, 9 of 52 cases (≈17%) meet these criteria; this low base rate is why precision–recall evaluation accompanies ROC analysis in the main text.
A.7 Reliability and reconciliation
Two independent researchers scored every case using this manual.
Each domain score was triangulated against at least two independent sources.
Disagreements greater than 0.2 points on any item were reconciled through consensus review.
Inter-rater reliability (Krippendorff’s α) was 0.76 for violation domains and 0.72 for repair domains, consistent with content-analysis standards (Lombard et al., 2002). The capacity factors reached α ≈ 0.75.
A.8 Worked example: Hungary, Q4 2025
The following reproduces the prospective Hungary coding reported in Section 5 (Koepsell, 2025), illustrating the full pipeline from raw domain scores to forecast band.
Step 1 — Violations. Domain scores summed to Vtotal = 1.85, dominated by weakened rule of law (0.65) and low narrative legitimacy (0.60).
Step 2 — Repairs. Acknowledgment 0.30, reform 0.35, compensation 0.60, inclusivity 0.30, implementation fidelity 0.40 → R̄ = (0.30 + 0.35 + 0.60 + 0.30 + 0.40) / 5 = 0.39.
Step 3 — Capacity. Legitimacy 0.50, elite cohesion 0.75, institutional capacity 0.65 → C = (0.50 + 0.75 + 0.65) / 3 = 0.633.
Step 4 — Derived quantities. Reff = 0.39 × 0.633 = 0.247; R/V = 0.247 / 1.85 ≈ 0.134; Prupture = 1 – 0.134 = 0.866.
Step 5 — Classification. R/V ≈ 0.134 falls in the < 0.30 band, yielding an imminent-rupture classification with a 1–2 quarter horizon. The diagnostic decomposition (rule-of-law and narrative-legitimacy violations against stagnant repair, with elevated elite cohesion sustaining rather than repairing the violation pattern) generated the specific predicted form: constitutional confrontation at oversight institutions. The April 2026 electoral rupture confirmed the horizon, form, and causal pathway.
Note. The anchor descriptions in Tables A2 and A4 operationalize the 0–1 scales summarized in the main text; coders should consult the project repository for the full source-by-source decision rules and the per-case scoring sheets.