
Introduction
This comparative and exploratory study investigates the acculturation of Russian speakers in Finland and Latvia. The study explores the relationship between acculturation and the self-reported language use of Russian speakers in Latvia and Finland from the viewpoint of the Russian speakers themselves. The findings contribute to our understanding of the potential relationship between language use and acculturation, as well as the nuances concerning the nature of ‘accidental diasporas’ versus ‘classical diasporas’.
Migration is a major factor in human history and a defining feature of the dynamics of many contemporary societies. This is also in the case of Latvia and Finland. In traditional terms, the process immigrants go through in their new living environment is usually referred to as ‘acculturation’. According to a classic definition, acculturation is ‘… those phenomena which appear when groups of individuals having different cultures come into first-hand contact that is continuous, with subsequent change in the heritage culture patterns of either or both groups’ (Redfield, Linton & Herskovits 1936: 149). Acculturation has not only been studied in relation to migration, but also i n terms of minority populations. There, studies have proposed a nuanced understanding of acculturation processes, for example, focusing on societal tensions or the possibility of peaceful coexistence (Kolstø 1999a; Manaev 2013; Muiznieks, Rozenvalds, & Birka 2013; Musaev 2017).
Living in and learning the language(s) of a society (sometimes called a destination country or the host culture) has often had a place in the way acculturation has been theorized (Carlson & Guler 2018; Jasinskaja-Lahti 2000). Studies into acculturation have identified a strong relationship between language acquisition and acculturation (Grigoryev & Berry 2017; Jasinskaja-Lahti 2008; Pisarenko 2006). Today, with increasing mobility, the use of information and communication technologies, and the evolving use of different lingua francas such as business and administrative English (Balič 2016; House 2003) continue to challenge our understanding of how language-related questions tie to acculturation. Indeed, this development has highlighted the need to understand the lived reality especially in bilingual or multilingual countries where English is not one of the official languages.
Exploring the acculturation of Russian speakers in the given contexts today necessitates a look back at the historical migration and formation of the Russian-speaking population within the Finnish and Latvian context, where we can see both similarities as well as differences (see Khalimzoda 2022; Khalimzoda 2023). Both Finland and Latvia neighbor Russia and have a significant Russian-speaking population, with a long and multifaceted history of immigration from Russia.
Existing research not only focused on the Russian speakers, but also on the majority population’s acculturation preferences toward Russian speakers (Nshom & Khalimzoda 2020). Russian-speaking minorities’ perspectives (Jasinskaja-Lahti 2008), and the overall historical situation of Russian speakers as well as their sociocultural adaptation and media use (Khalimzoda & Siitonen 2022; Manaev 2013; Musaev 2017; Voronov 2009).
The term ‘Russian speakers’ is deliberately chosen here to address participants, recognizing the lack of consensus in existing literature that uses various designations such as ‘Russophone,’ ‘Russian minority,’ ‘Russian diaspora,’ ‘Russian immigrants,’ or simply ‘Russian speakers,’ (Cheskin 2013; Coolican 2021; Golova 2020; Jasinskaja-Lahti 2008; Kaprāns & Mieriņa 2021; Laitin 1998; Pisarenko 2006; Sencerman 2018). Acknowledging the complex historical context, participants in Latvia and Finland self-identified during pilot data collection as ‘special,’ ‘Slavic,’ and ‘Baltic Russians,’ adding intricacy to the terminology. Our study intentionally employs terms like ‘Russian speakers,’ ‘diaspora,’ and ‘migrants’ to capture varying levels of accuracy when discussing the population in question, urging readers to focus on participants’ background information and self-identification.
Russian speakers in Latvia are described as having low levels of rootedness in the country, along with strong ties to the historic motherland Russia (Kolstø 1999a). According to Voronov (2009) and Musaev (2017), so-called ethnic Russians have had difficulties in accepting their minority position after the collapse of the Soviet Union. In Finland, according to Jasinskaja-Lahti (2000), regardless of ethnic roots or attitudes toward acculturation, the immigrants’ willingness to learn and use the host society’s language(s) appears to be a precondition for being recognized as members of the same ‘imagined community’ and overcoming the cultural and interactional border between the majority as ‘natives’ and the minority as ‘aliens’ (pp. 62–63). However, it is also possible that migrated people or minorities may choose—or end up—living in their own ethnic, informational, and ideological circles. Although this is possible, there is a continuous interest in understanding this dynamic of parallel lives to ensure a common understanding and peaceful coexistence, inclusion, and belonging, and to safeguard and prevent societies from further targeted division on the basis of language, ethnicity, religion, political opinion, or particular conflicting views of historical events. The present study contributes to this emerging understanding by exploring the relationship between acculturation and the self-reported language use of Russian speakers in Latvia and Finland from the viewpoint of the Russian speakers themselves. This study contributes to our understanding of the possible relationship between language use and acculturation, as well as the nuances concerning the nature of ‘accidental diasporas’ versus ‘classical diasporas.’
Theoretical Background
Language Use and Acculturation
Investigating the variables and processes that may impact acculturation, scholars have found language practices to be one of the main elements (Clement 1984; Collier & Thomas 1988). Language, according to Kim (1988), is the primary channel via which cultural knowledge is communicated. Clement’s (1984) socio-contextual model of second language learning proposes that elements of interaction with the second language group, such as frequency and quality of contacts, lead to differences in an individual’s linguistic self-confidence. In other words, when a person’s host language proficiency improves, identification with the target language group should increase as well. Indeed, greater self-confidence in the destination language is linked to more frequent and better-quality contact with receiving society members (Noels, Pon & Clement 1996). Language proficiency has also been demonstrated to affect employment. For example, Dustmann and Fabbri (2003) examined factors that influence language proficiency as well as the impact of language on non-white immigrants’ wages and employment prospects in the context of the United Kingdom. According to their study, language proficiency has a positive impact on career prospects, whereas a lack of local language (English) fluency has a negative impact on earnings. At the same time, contemporary studies on acculturation and language proficiency have highlighted the importance of the right to a heritage language and how it should be acknowledged alongside the need to learn the host country’s language(s) (e.g., Ennser-Kananen & Pettitt 2017; Latomaa 2013). Local language proficiency may indeed play a significant role. Still, other scenarios are also possible where people feel belonging to a society but do not speak the language of the society in question due to the profession, temporarity of their stay, or due to various other reasons such as difficulties in language learning or lack of motivation. This may be the case, especially if everyday life is manageable with the use of languages other than the local. Sometimes, newcomers may end up in different language communities within the country of residence. Most of the existing studies in this field concentrate on the English-speaking world, especially countries like the United States and Canada. Studies in the North American context have long used proficiency in the English language (e.g., Cuellar, Harris & Jasso 1980; Dalisay 2012; Kim & Abreu 2004) and a propensity to use English in interactions (e.g., Kang 2006; Stephenson 2000) as markers of acculturation in society. From this viewpoint, higher levels of English proficiency, a preference for using English in interactions, and more awareness of the host society’s politics are all seen to imply stronger acculturation to the host society (Dalisay 2012: 149). However, there is much less research on the situation in non-English-speaking countries, especially those that are bilingual or multilingual, though the internationally prevalent role of English, oftentimes as a lingua franca, is acknowledged.
The research that does focus on bilingual societies illustrates that in some contexts, a segmentation of language proficiency may be a more valid starting point. For example, in a study by Lapresta-Rey, Janes and Alarcon (2021) located in the Spanish Catalan context, it was illustrated how immigrants’ proficiency in one local language (Spanish) could be beneficial from the viewpoint of immediate employment, while proficiency in another (Catalan) was connected to higher social mobility and increased income in the long run. Grigoryev and Berry’s (2017) study indicated that the language skills of Russian immigrants working in Belgium had a positive impact on their socioeconomic adaptation in two ways: directly (better language skills predicted better socioeconomic adaptation) and indirectly (better language skills promoted the participants’ integration preference). Also, multilingualism in general may have an effect on the acculturation process. For example, Dewaele and Stavans’ (2014) study in the Israeli context illustrated how knowledge and frequency of use of multiple languages were associated with higher levels of social initiative and open-mindedness, as well as higher levels of cultural empathy. This was especially evident for those participants who had one local and one immigrant parent. Overall, there is a clear need for more studies into the relationship between language and different elements of acculturation in bilingual or multilingual contexts.
The Context of the Study: The Situation of Russian Speakers in Latvia and Finland
Both Latvia and Finland were part of the Russian Empire in the era leading into World War I, Latvia from 1710 to 1917, and Finland from 1809 to 1917. Between the two World Wars, both countries experienced a period of independence and also served as a destination for the Russian diaspora of the time. For example, directly after World War I, Finland was a destination for tens of thousands of Russian refugees (some of whom were ethnic Finns or Karelians). In Latvia, the numbers were even higher. During the first independent Latvian republic from 1918 to 1940, the Russian diaspora amounted to more than two hundred thousand. The main difference between the two countries arose as an outcome of World War II. While Finland kept its independence after losing some of its territory, Latvia was incorporated into the USSR. This meant, among other changes, that the number of Russians in Latvia increased from 12% to 42% of the population between 1950 and 1980. It has been argued that only some of them were interested in the local (Latvian) culture (Voronov 2009). Toward the end of the Soviet Union in 1989, Russians made up 34% of the population in Latvia (Ministry of Foreign Affairs of the Republic of Latvia 2015).
Currently, inhabitants with a Russian background make up 25.8% of the Latvian population, making them the largest ethnic minority (Muiznieks, Rozenvalds & Birka 2013; Statistical Yearbook of Latvia 2017). Because the shift in the status of Russians occurred only after the collapse of the USSR, the situation of Russians in the Baltics is rather unique, falling somewhere between migrant and ethnic minorities (Shafir 1995). Latvian is the only official language in the country. Russian is widely spoken in many places, however, effectively playing the role of a second language. In Finland, there were 84,000 people (approximately 1.5% of the population) in 2021 who considered Russian as their native language (Statistics Finland 2021). Most of these Russian speakers have a migrant background, with 55,552 being born in the former Soviet Union and 12,766 being born in the Russian Federation. While the numbers of Russian speakers are much smaller than in Latvia, those with a Russian background still form the single largest group of foreign-language speakers in Finland (Statistics Finland 2021).1
Language and Acculturation in the Context of Finland and Latvia
Studies have considered Russian speakers’ acculturation in the Latvian context from a variety of viewpoints. Kolstø (1999a) for example, describes the Russian speakers in Latvia as having low levels of rootedness in the country, along with strong ties to the so-called historic motherland Russia. According to Voronov (2009) and Musaev (2017), ethnic Russians have sometimes had difficulties in accepting their minority position after the collapse of the Soviet Union. It has also been hypothesized that Russian speakers would end up adapting to the Baltics as a result of negative net migration from Russia (which brings their number down) and relative cultural similarities (Pisarenko 2006; Simonian 2003), depending on their motivation as well as the majority’s attitudes toward their inclusion (Petersons & Khalimzoda 2016).
In a study on language knowledge and acculturation of Russian-speaking adolescents in Latvia, Pisarenko (2006) showed how fluency in the dominant (Latvian) language of the society is positively connected to the acculturation strategies of assimilation and integration, and the preference for a separation strategy is statistically significantly interrelated with a lower level of language knowledge. The study further suggests that citizenship significantly matters in the choice of acculturation strategies, as participants who were noncitizens indicated a stronger preference for the separation strategy than Latvian citizens did (Pisarenko 2006). This reaffirms the positive relationship between acculturation attitudes and knowledge of the language in the country of destination. It can be also added that the younger generation of Russian speakers in Latvia who were born in the country after independence seems to have a more accommodating perspective, and they seem to adapt better to the Latvian-dominated society or at least understand the situation in a less confrontational way (Kaprans & Juzefovics 2019).
In the Finnish context, Russian immigrants have been shown to perceive themselves to be hierarchically higher than some other immigrant groups, while at the same time feeling inferior to Finns (Jasinskaja-Lahti, Liebkind & Perhoniemi 2006). National languages in Finland (Finnish and Swedish) hold a crucial space in acculturation (Arola 2017; Vuori 2015), since the situation is not comparable to the Latvian one, where almost half of the population can speak Russian due to historical reasons. Studying Russian adolescents in Finland, Jasinskaja-Lahti (2000) has shown how the variations in second-language competence across immigrant groups are linked to their duration of stay in the host society: those who arrived earlier had greater Finnish fluency. This skill was shown to raise both self-esteem and a sense of mastery, but surprisingly did not improve life happiness. Despite the present studies on different aspects of immigrant life, understanding that acculturation is a process of change to be studied over time (Murray et al. 2014) remains a constant.
Based on acculturation theorizing and the viewpoint that language proficiency and use in the destination country are an integral part of the acculturation process, this study seeks to answer the following research question:
(RQ1) How are Russian speakers’ cultural preference (CP) and cultural involvement (CI) related to their language proficiency and use?
Methodology
Measures
To measure acculturation, we used Carlson and Güler’s (2018) inventory, which operationalizes acculturation through the dimensions of CI and cultural preference (CP). There are 24 items in this measurement. According to the authors:
Each measure combines data from both origin culture and destination culture scales, retains the continuous properties of these scales, connects Berry’s two of the four-category acculturation outcomes, and has theoretical significance and potential comparability across studies of different immigrant populations. Together they offer a quantitative measure of variations in the structural relation between an immigrant group and its new destination culture and should reveal new insights into the acculturation process. (Carlson & Güler 2018: 625)
The 24 statements are broken down into two measurements each with 12 assertions. The first part (see Table 1) assesses the respondents’ involvement with their so-called culture of origin (in this case, Russian) on a scale of 1 to 9, with 5 serving as a neutral midpoint. The measurement for the destination culture is repeated in the second part (here: Latvian or Finnish, by changing the wording (nationality)). According to Carlson and Güler (2018), the CI measure portrays two of Berry’s four categorical outcomes as polar opposites, ranging from absolute marginalization at the lowest CI score to total integration at the highest cultural engagement score (see Figure 1).
Table 1
Acculturation measure scale items (Carlson & Güler 2018).
| 1. I enjoy (nationality) entertainment (e.g., movies, music). |
| 2. I am interested in having (nationality) friends. |
| 3. I enjoy social activities with (nationality) people. |
| 4. I participate in (nationality) cultural events. |
| 5. I feel comfortable speaking (nationality) language. |
| 6. My thinking is done in the (nationality) language. |
| 7. I have strong ties with the (nationality) community. |
| 8. I enjoy (nationality) jokes and humor. |
| 9. It is important to me to maintain the practices of (nationality) culture. |
| 10. I behave in ways that are typically (nationality). |
| 11. I would be willing to marry a (nationality) person (if single). |
| 12. I enjoy (nationality) food. |
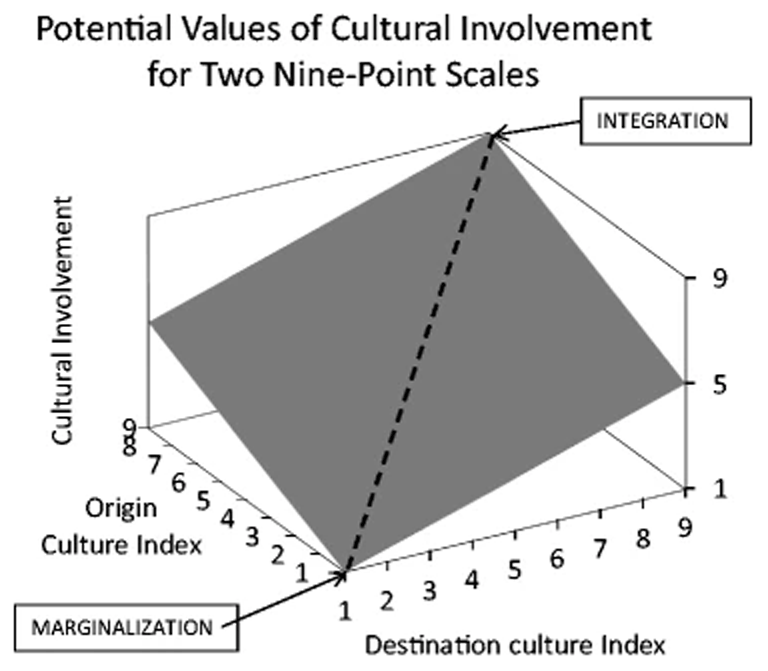
Figure 1
The potential values of cultural involvement (CI) (Carlson & Güler 2018: 629).
Figure 1 illustrates the potential values of CI for two nine-point scales sources (Carlson and Güler 2018; Szapocznik et al. 1980). It is calculated as: origin culture index plus the destination culture index divided by two.
Figure 2 illustrates the potential values of CP for two nine-point scales sources (Carlson and Güler 2018; Szapocznik et al. 1980). It is calculated as: origin culture index minus destination culture index divided by two.
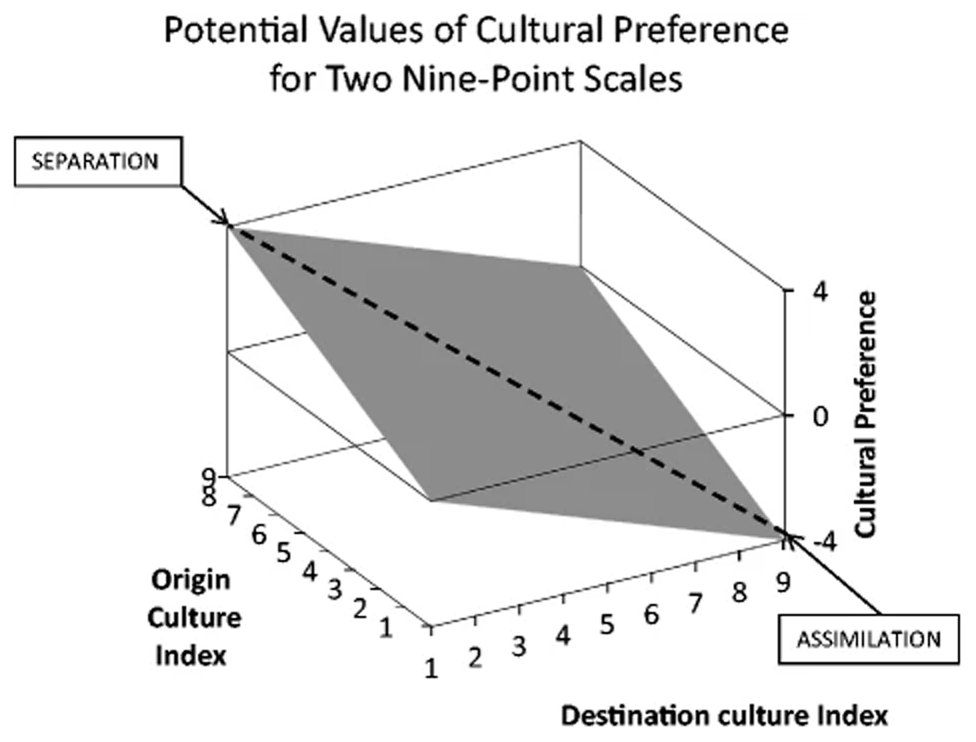
Figure 2
The potential values of cultural preference (CP) (Carlson & Güler 2018: 630).
In addition to the acculturation items from Carlson and Güler (2018), we included several questions into the survey that inquired into the participants’ language proficiency and use. We asked the participants to self-assess their language proficiency, for example, in the local language (Finnish or Latvian) and English. We included Swedish as an option in the Finnish survey since it is the second official language of the country, but no respondents indicated that they spoke Swedish. The participants were also asked to indicate which languages they use the most outside of their homes by putting them into order.
Procedure
The questionnaire was created in English first, as in the original Carlson and Güler (2018) inventory. It was then translated into Russian using back-translation as a way to ensure that the translation worked as intended. The procedure was carried out by three persons, two of whom spoke Russian as their first language.
The responses were gathered over several stages. First, in each nation, we contacted governmental and nongovernmental organizations involved with Russian speakers with the aim of utilizing their networks and email lists as a way to reach potential participants. We contacted around 35 institutions, requesting them to distribute the survey to their members. Unfortunately, this approach did not yield significant results. Some organizations that responded to us cited privacy rules or similar reasons for not disseminating the study further. Second, as a next stage, a link to the survey was shared on social media, utilizing the researchers’ networks and the snowball sampling technique. Third, an inquiry was placed in Latvian and Finnish Russian-speaking social media groups. While this strategy did prove beneficial, sharing the survey in social media groups may also have led to biased results—a matter that we will discuss later on in our evaluation of the study. The survey was answered by 142 respondents from Latvia and 137 respondents from Finland. We checked the data for outliers as part of the first data screening. We discovered 54 respondents who either did not meet the survey’s target audience or did not finish the questionnaire. They were therefore omitted from the rest of the investigation. A scatter plot was used to look for outliers among all the variables, but no critical cases were identified. The total number of complete responses to the survey was 224 (91 from Latvia, 133 from Finland).
Participants and Demographics
In the following paragraphs, the basic demographics are presented, followed by initial calculations related to the CI and CP indices. As this study is part of a larger research project, this section repeats some information published earlier in Khalimzoda and Siitonen (2022). For clarity, we have opted, however, to report key numbers here as well.
In total, 76.5% of the Finnish sample reported to be female, and 23.5% reported to be male. Overall, 57% of Finland’s Russian-speaking population is registered as female (Statistics Finland 2021). With a mean age of 39, the respondents’ ages ranged from 20 to 68. Overall, there are more persons of working age in the Russian-speaking community in Finland than among the total population (Statistics Finland 2021). One hundred and fifteen of the 133 respondents said they were employed. This significantly distinguishes our sample from Finland’s general situation, where speakers of Russian report having an employment rate of only about 50% (Varjonen, Zamiatin & Rinas 2017). The respondents in the Finnish sample had a high level of education. In all, 65.4% had a bachelor’s degree, 18.8% had a master’s degree or above, and 15.8% had only completed their secondary school. These figures are higher than the official ones when it comes to the educational level of Russian speakers in Finland, but there are no completely accurate figures because of statistical shortcomings (Varjonen, Zamiatin & Rinas 2017).
The self-reported gender split of the Latvian sample was 68.1% female and 31.9% male. In Latvia, around 61% of Russian citizens are registered as female (Statistical Yearbook of Latvia 2017). With a mean age of 37, the respondents’ ages ranged from 17 to 80. 84 of the 91 respondents reported to be employed. This is higher than Latvia’s overall working-age population of 67.7%. (European Commission 2021). The respondents in the Latvian sample had also a high level of education. Overall, 68.1% had a Bachelor’s degree, 9.9% had a Master’s degree, and 22% had only completed their secondary school.
There were many variations in the reported demographic characteristics between the Latvian and Finnish samples. Fifty four percent of the participants in the Latvian sample were born in Latvia. In contrast, everyone in the Finnish sample has come from abroad. The average length of stay in Latvia for respondents from Latvia was longer (M = 28.8, SD = 17.5) than for respondents from Finland (M = 12.1, SD = 10.2). In the Latvian sample, 65 respondents were citizens of Latvia, six were not, and 19 were citizens of Russia. In the Finnish sample, 61 people were citizens of Russia, 48 held dual citizenship (Finnish and Russian), 11 had Finnish citizenship, and five were Estonian.
Data Processing
The culture of origin index and the culture of destination index were created by adding up the respondents’ answers to the 12 statements, divided by 12 (the number of items in total). Together, the responses of the participants from Latvia and Finland to the 12 statements about the culture of origin were (Min = 1.58, Max = 9, M = 6.87, SD = 1.39). Their 12 answers to the question on the destination’s culture were (Min = 1, Max = 8.91, M = 5.51, SD = 1.66). The Latvian sample’s culture of origin scores (Mdn = 7.32) were higher than the Finnish sample’s (Mdn = 6.75). This difference was shown to be statistically significant by a Mann–Whitney test (U = 4,926, z = 2.363, p < 0.05). The Latvian sample’s culture of destination scores (Mdn = 5.42) was lower than the Finnish sample’s (Mdn = 5.83). Also, this difference was shown to be statistically significant by a Mann–Whitney test (U = 7336, z = 2.698, p < 0.01). In both the Finnish and Latvian populations, Cronbach’s alpha indicated that the questionnaire had high internal reliability, ranging from (α = 0.890–0.905).
As was stated earlier, we included several questions on language proficiency and use. Based on the answers, we created two nominal variables. First, one based on the respondent’s answers to a question inquiring into their self-perceived language proficiency. Respondents were grouped according to whether they (1) marked the local language (Finnish or Latvian) as their second language; (2) marked English as their second language; or (3) marked both of these as equally strong. Second, we created another nominal variable based on the respondent’s answers to the question on the most used languages outside of their homes. This variable grouped the respondents into those that indicated using (1) Russian, (2) Finnish or Latvian as the ‘local language’, or (3) English as the most used language outside of their homes.
Findings
Cultural Involvement (CI)
Following Carlson and Güler (2018), we added the origin and destination culture indexes and divided the score by two to get the CI score. The CI scores for the Latvian and Finnish samples were compared using an independent-sample t-test. The respondents’ CI values varied from 9 to 3, with a mean of (M = 6.25, SD = 0.98). This result is very close to so-called biculturalism, which in Carlson and Güler’s (2018) model signals an involvement with both Russian as well as Latvian/Finnish culture. There was no significant difference in scores between the Latvian (M = 6.21, SD = 1.01) and the Finnish samples (M = 6.27, SD = 0.95; t (224) = – 0.43, p = 0.66).
Cultural Preference (CP)
We calculated the direction of the CP score by subtracting the origin culture score minus the destination culture score, and dividing the outcome by two, as described by Carlson and Güler (2018). The overall mean CP for the entire sample was (M = +0.68, SD = 1.22). Carlson and Güler (2018) explain that when interpreting CP scores, a CP score of +4.0 is equivalent to complete separation in Berry’s categorical formulation, and a CP score of –4.0 is equivalent to complete assimilation (p. 631). Simply defined, higher scores show a preference for the culture of origin, lower scores for the destination culture, and scores close to the midpoint show a preference for biculturalism. In order to further compare the CP scores for the Latvian and Finnish samples, an independent-samples t-test was used. The Latvian sample’s CP scores (M = +0.99, SD = 1.22) differed significantly from the Finnish sample (M = + 0.47, SD = 1.19); t (222) = 3.16, p = 0.002). In other words, the preference for the culture of origin (Russian) was higher in the Latvian sample than in the Finnish sample. According to Cohen’s criteria (1998), however, the size of the mean differences was very minor (η2 = 0.004). Therefore, we might conclude that the participants in both countries had CP scores that were closer to biculturalism than monoculturalism. Next, we will turn to look at these results and their relation to the participants’ language proficiency and use.
Language Proficiency and Use
The self-assessed proficiency of our respondents in the local language (Finnish/Latvian) and English is presented in Table 2.
Table 2
Self-ranked second language proficiency.
| FINNISH/LATVIAN | ENGLISH | BOTH FINNISH/LATVIAN AND ENGLISH | TOTAL | |
|---|---|---|---|---|
| Finnish sample | 62 (46.61%) | 61 (45.86%) | 10 (7.51%) | 133 |
| Latvian sample | 46 (50.54%) | 30 (32.96%) | 15 (16.48) | 91 |
| Samples together | 108 (48.21%) | 91 (40.62%) | 25 (11.2%) | 224 |
[i] N = 224.
There was an almost even distribution between those who chose English and those who chose Finnish as their second strongest language after Russian. By contrast, in the Latvian sample, self-assessed English proficiency was lower.
Respondents also indicated how often they would use different languages outside of their homes. As seen in Table 3, the Finnish sample included a relatively even distribution between Russian (29%), Finnish (41%), and English (31%), with Finnish being the most-used language outside of the home. In the Latvian sample, most of the respondents reported using Russian (79%) outside their homes. A small number of respondents reported using Latvian most (18%), while the use of English (3%) was almost nonexistent. These findings indicate that both the Finnish and English languages seem to play an important role in the Finnish context, whereas Russian was by far the most used language reported in the Latvian sample. It is therefore important to investigate further how reported language use relates to CI and CP. This moves us to the main research question: (RQ1) How are Russian speakers’ cultural preference (CP) and cultural involvement (CI) related to their language proficiency and use?
Table 3
Most used languages outside of the home.
| RUSSIAN | FINNISH/LATVIAN | ENGLISH | TOTAL | |
|---|---|---|---|---|
| Finnish sample | 38 (28.57%) | 54 (40.60%) | 41 (30.82%) | 133 |
| Latvian sample | 72 (79.12%) | 16 (17.58%) | 3 (3.3%) | 91 |
| Samples together | 110 (49.10%) | 70 (31.25%) | 44 (19.64%) | 224 |
[i] N = 224.
To answer our research question, we conducted four two-way analyses of variance (ANOVA). Our aim was to investigate if/how second language proficiency and most used language outside the home would relate to participants’ CI and CP scores, while including the country of respondents in check. We conducted preliminary assumption testing to check for normality, linearity, univariate and multivariate outliers, homogeneity of variance-covariance matrices, and multicollinearity, with no serious violations noted.
1. Language Proficiency and Cultural Involvement
There was a statistically significant main effect for second language proficiency [F (2, 224) = 11.62, p < 0.001]; with an effect size (partial eta squared = 0.096). Post-hoc comparisons using the Tukey HSD test indicated that the mean CI score for the Local (Latvian/Finnish) language group (M = 6.54, SD = 0.89) was significantly higher than in the English language group (M = 5.89, SD = 0.98). In other words, the participants who indicated proficiency in either of the local languages also scored higher in their CI in the destination country (see Figure 3). The interaction effect of second language proficiency with the country of the respondents (Latvia or Fin*Sec_Lan_Pro) [F (2, 224) = 0.585, p = 0.558] did not reach statistical significance. For the descriptive statistics table, please refer to Appendix 1.
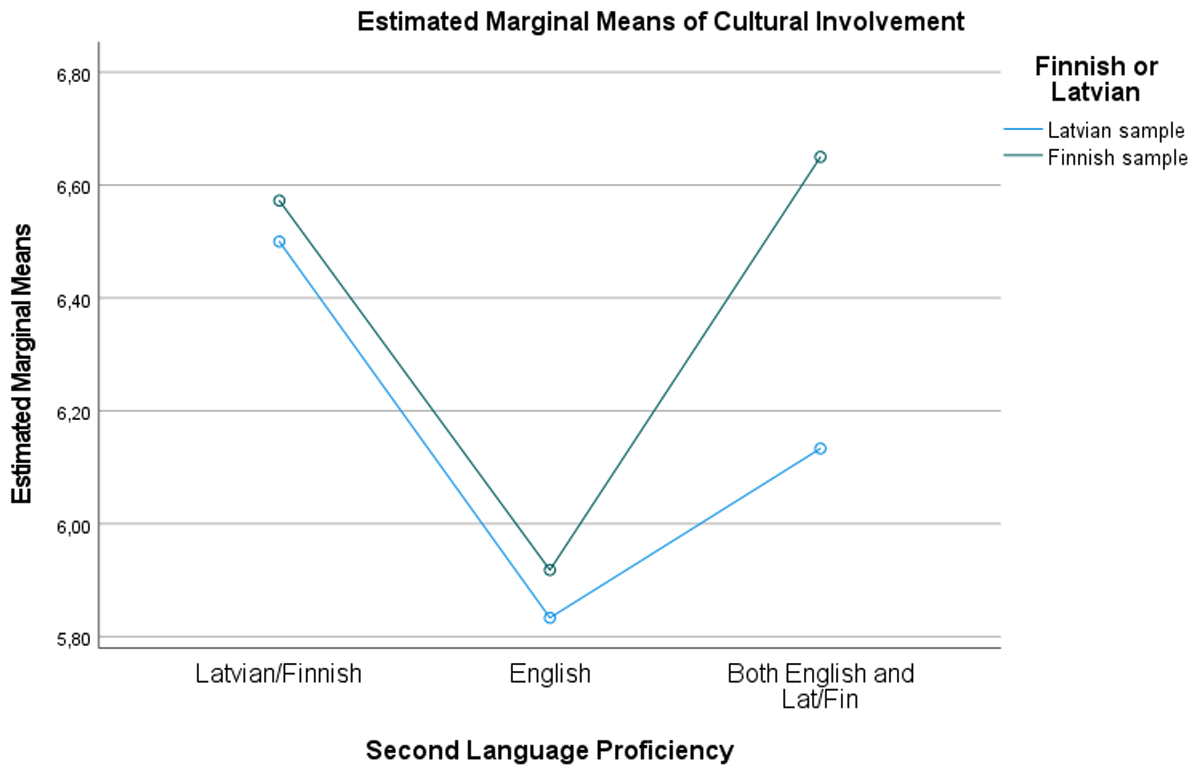
Figure 3
Second language proficiency and Cultural Involvement (CI) of Latvian and Finnish samples.
2. Language Proficiency and Cultural Preference
We used a two-way between-groups analysis of variance to explore the relationship between second language proficiency and the country of the respondents on their CP scores.
There was a statistically significant main effect for the respondents’ country (Latvia/Finland) [F(1, 224) = 9.21, p = 0.003]; with an effect size (partial eta squared = 0.041). Post-hoc comparisons using the Tukey HSD test did not produce statistical significance, however. The interaction effect for the second language proficiency [F (2, 224) = 1.20, p = 0.303] and the country of respondents (Latvia or Fin*Sec_Lan_Pro) [F (2, 224) = 1.05, p = 0.351] did not reach statistical significance either (see Figure 4). In other words, we did not find a notable relationship between the respondents’ self-reported language proficiency and their CP scores in both countries. For the descriptive statistics table, please refer to Appendix 2.
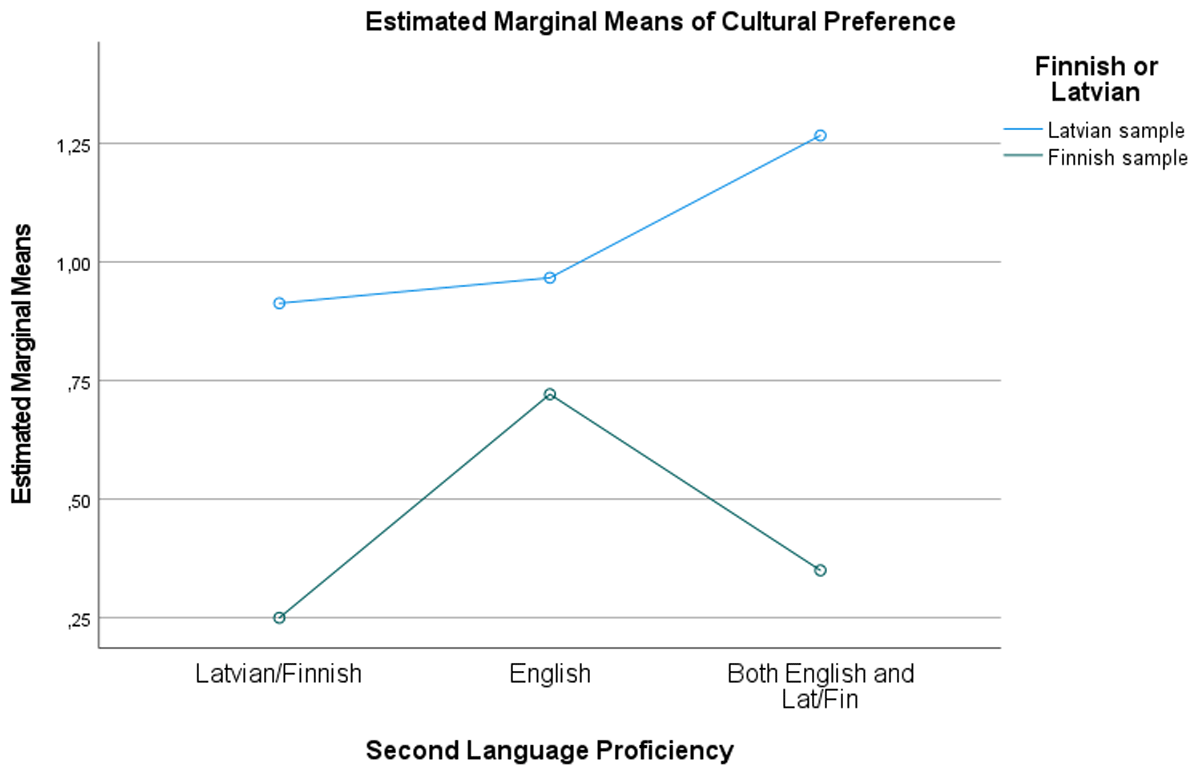
Figure 4
Second language proficiency and Cultural Preference (CP) of Latvian and Finnish samples.
3. Most Used Language and Cultural Involvement
A two-way between-groups analysis of variance was conducted to explore the relationship between the respondents’ most used language outside of their home and country (Latvia/Finland) on their CI scores. There was a statistically significant main effect for the most used language [F (2, 224) = 9.21, p < 0.001] with an effect size of (partial eta squared = 0.078). Post-hoc comparisons using the Tukey HSD test indicated that the mean CI score for the Finnish/Latvian language group (M = 6.72, SD = 0.77) was significantly higher than the scores of both the Russian (M = 6.11, SD = 0.95) and English language groups (M = 5.88, SD = 1.07). In other words, respondents using more local languages show higher CI results compared to those who use English or Russian (see Figure 5). The interaction effect for the country of the respondents (Latvia/Finland [F (1, 224) = 0.507, p = 0.477] and the most used language (Latvia or Fin*Most_Used_Lan) [F (2, 224) = 0.967, p = 0.382] did not reach statistical significance. For the descriptive statistics table, please refer to Appendix 3.
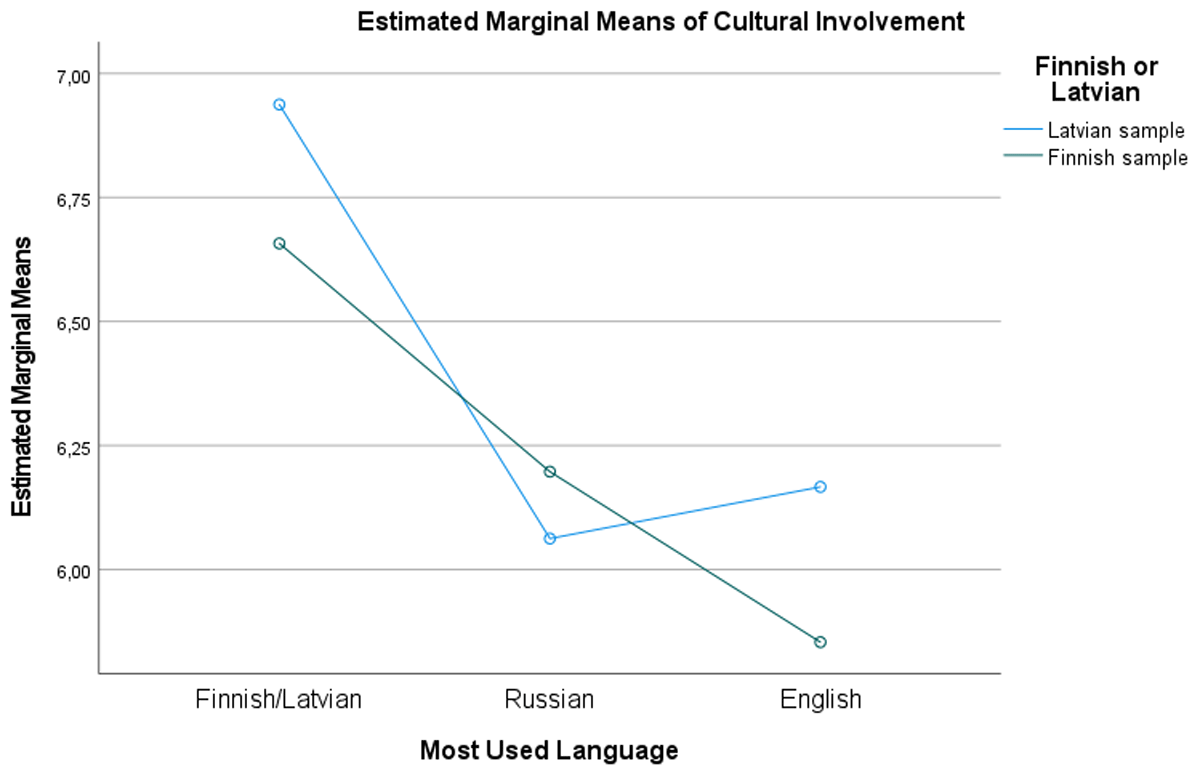
Figure 5
Most used language and Cultural Involvement (CI).
4. Most Used Language and Cultural Preference
A two-way between-groups analysis of variance was conducted to explore the relationship between the respondents’ country and their most used language outside of the home, and their CP score. There was a statistically significant main effect for most used languages [F (2, 224) = 34.23, p < 0.001]; with an effect size (partial eta squared = 0.239). Post-hoc comparisons using the Tukey HSD test indicated that the mean score for the Finnish/Latvian language group (M = –0.16, SD = 1.01) was significantly lower than the scores of both the Russian language group (M = 1.29, SD = 1.11) (p < 0.001), and the English language group (M = 0.51, SD = 0.91) (p = 0.003). The mean score difference between the Russian language group and the English language group also reached statistical significance (p < 0.001). In other words, those who report using the local language the most showed lower CP scores on average. Those who reported using the Russian language the most had the highest CP scores (see Figure 6). These findings illustrate how using the local language goes hand in hand with a decrease in the preference toward the culture of origin. The interaction effect for the country of the respondents (Latvia/Finland [F (1, 224) = 0.063, p = 0.802] and the most used language taken together (Latvia or Fin*Most_Used_Lan) [F (2, 224) = 0.174, p = 0.841] did not reach statistical significance. For the descriptive statistics table, please refer to Appendix 4.
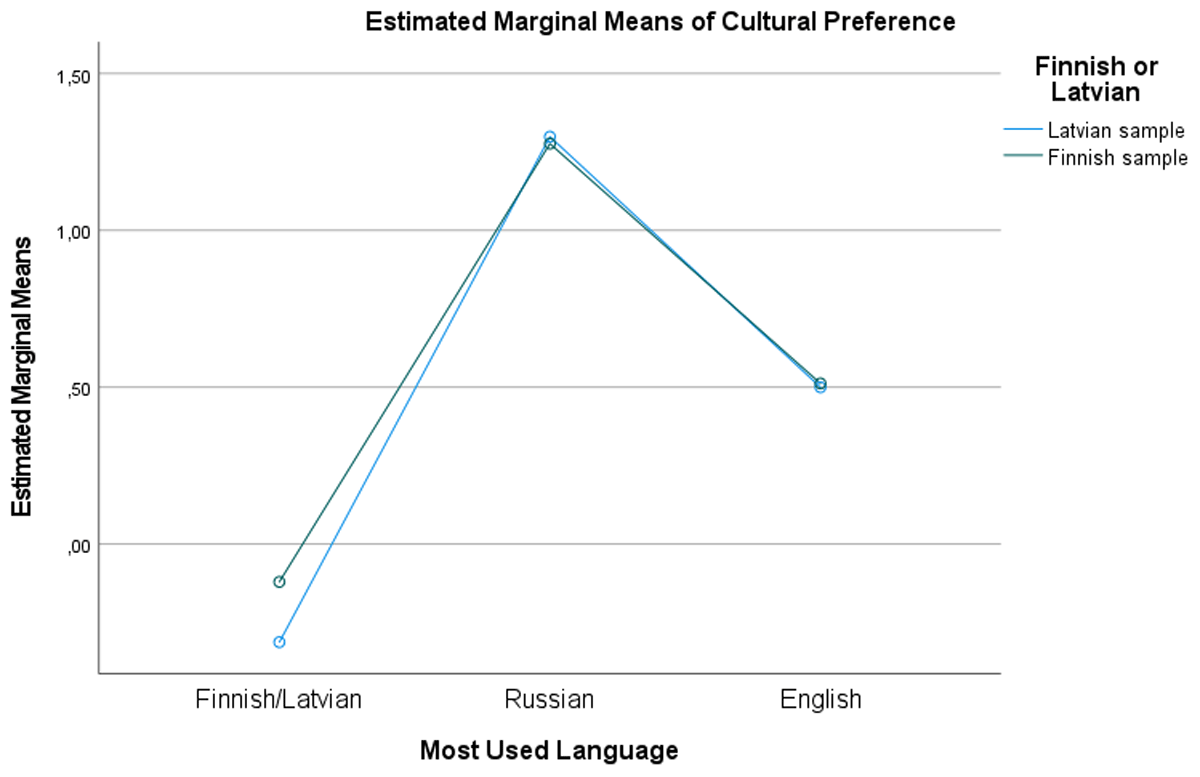
Figure 6
Most used language and Cultural Preference (CP).
Discussion
This study set out to explore the relationship between Russian speakers’ self-reported language proficiency and use with their CI and CP scores. The most evident difference between the Latvian and Finnish samples of Russian speakers was in the reported second language proficiency (Table 2) and reported language use outside the home (Table 3). In the Finnish context, the Finnish language was reported to be the main means of communication for most of the participants, whereas in the Latvian sample, participants reported using predominantly Russian outside of their homes. Another difference lies in the role of the English language. In the Finnish sample, English was reported to be used often, and self-assessed English proficiency was higher than in the Latvian sample. The popularity of the Russian language and its extensive use in the Latvian context may be associated with (1) the different ways in which Russian speakers have historically moved into the country, especially during the Soviet Union era (Khalimzoda 2022) and that they are considered to be somewhat in between a migrant and a minority (Shafir 1995); and (2) current demographics, in which around 25% of the entire population of Latvia can be categorized as ethnic Russians. In other words, in the Latvian case, we may be seeing a case of an ‘accidental diaspora’ (Brubaker 2000), in which the Russian speakers in Latvia today have experienced a change in the political regime in the country of their birth and where the borders of the nation around them have moved instead of them moving over the borders. The participants’ demographic information also confirms that slightly more than half of the Latvian respondents (54%) were born in Latvia. On the contrary, in the case of the Finnish sample, most of the Russian speakers arrived in the country voluntarily, conforming to a more traditional migration/diaspora. Therefore, according to existing normative use of terminology, participants in Finland can be considered as having a migrant background, whereas slightly more than half of the participants from Latvia may have local minority status instead.
Most importantly, despite a relatively small effect size, knowledge of the local language was shown to be related to the participants’ CI scores. Knowing the local language did not play a statistically significant role in the participants’ CP scores, however. Here, our findings are in line with earlier studies (Arola 2017; Grigoryev and Berry 2017; Vuori 2015) on the role of local language proficiency in acculturation. Another important finding was that, looking beyond language proficiency, it was the language that was reported to be used the most outside of the home that explained a greater part of the variation in CI and CP. Reported use of the local language outside the home was significantly related to low CP scores (M = –0.16, SD = 1.01). Meanwhile, the reported use of the Russian language in everyday life outside the home was related to higher CP scores (M = 1.29, SD = 1.11). According to the original model by Carlson and Güler (2018), scores that are close to zero on the CP scale indicate biculturality, and scores that deviate from zero in either direction indicate monoculturality (pp. 630–631). The preference toward Russian culture (CP) could explain the reason for the extensive use of Russian. The relationship may be bidirectional, however, in that the extensive use of Russian could also explain the strong orientation toward Russian culture. We, therefore, propose that while language proficiency (or fluency, see Pisarenko 2006) may be used to explain acculturation strategies and processes, it may be especially useful to concentrate on the languages people actually use (see Dewaele & Stavans 2014) on an everyday basis.
It is clear that in the Latvian context, knowledge of Russian or Latvian will lead to somewhat different employment opportunities. In addition, there is an open question about whether proficiency in Latvian can be connected to the possibility of higher social mobility in the long run. For example, Manaev (2013) argues that even a solid command of the state language does not guarantee employment nor protect against prejudice. The question remains open, however, and warrants further inspection. Here, a parallel may be drawn to the Spanish–Catalan context, where Lapresta-Rey, Janes and Alarcon (2021) illustrated how immigrants’ proficiency in one local language (Spanish) could be beneficial from the viewpoint of immediate employment, while proficiency in another (Catalan) was connected to higher social mobility and increased income in the long run. The same dynamic may not apply to Russian speakers in Finland, where the National languages (Finnish and Swedish) have traditionally been crucial in acculturation (Arola 2017; Vuori 2015). In Finland, the Russian language is spoken only by around 2% of the entire population, and as our study’s participants demonstrated, many of them use Finnish outside of the home.
As our findings from nonrepresentative data on the most used language and CI show, in practice, it may be difficult to be involved in the surrounding society if one does not understand and use the local language. While the use of English as the lingua franca (ELF) (see Jenkins 2007) and translanguaging practices (see Lewis, Jones & Baker 2012) may in some societal contexts allow for certain levels of participation and involvement (i.e., business, studying), our findings illustrate how it was both proficiency and, in particular, the use of local languages that was related to higher CI.
It must also be noted that identity, as well as language, are also used as an ideological tool (Zakem et al. 2018). Kolstø (1999a) describes the Russian speakers in Latvia as having low levels of rootedness in the country, along with strong ties to the so-called historic motherland Russia. This might be associated with the accidental diaspora we discussed above and also with the idea that Latvian and Russian speakers are commonly separated by linguistic identification, and therefore a minority community known as Russian speakers has developed within the mainstream society (Pisarenko 2006). Another rationale might also be—similar to the findings of Qurratulain and Zunnorain (2015)—that at times minorities may resist acculturation by retaining their language prestige and therefore tend toward deculturation. Research in the Russian language segment suggests that a key tool for preserving national identity and safeguarding the interests and rights of Russians in the Baltic states is a variety of public organizations and associations, some of which have made it their mission to preserve and develop Russian language and culture in their country. Like other nongovernmental groups, however, they require not just moral but also financial backing from their home country (Manaev 2013), which may raise concerns about the ‘real purpose’ of the source of the funding. At the time of writing this study, the war between Russia and Ukraine was ongoing, resulting in an increasing number of incoming refugees from Ukraine to both Latvia and Finland. Consequently, the linguistic realities, media landscapes, and political realities of Russian speakers in these countries may also change in the near future.
Limitations, Future Research, and Recommendations
As a limitation, we must note that our study’s sample is not representative of the overall population of Russian speakers in Latvia or Finland. Our study illustrates a relationship between (self-assessed) language and acculturation, but more studies are needed in order to find out how common such patterns are within the broader population. The destination society’s language policies are also crucial factors in the acculturation process that warrant further study. It would also be important to develop more nuanced ways of measuring language use in different contexts, such as at home, at work, or in society overall.
Future research could explore the reasoning behind using certain languages and their possible interactions with the process of acculturation, both in larger populations and on the individual level. What is especially needed is research in those societal contexts where English is not one of the official languages yet is widely used as a lingua franca. This involves asking questions such as what kind of CI may be (im)possible for migrants and how it relates to using other languages (such as the official language or heritage language).
The constructs of CI and CP are not without their limitations either. For example, they may be criticized for their simplistic idea of culture of origin and culture of destination as connected to nationality alone.
Finally, the existence of two information spaces (i.e., news and media landscape) contradicting one another in Latvia poses some concerns as well (Khalimzoda 2022). While the situation is much less accentuated in Finland, similar concerns exist relating to parallel realities in the media landscape (Khalimzoda 2022; Sotkasiira 2017). In an earlier study, Khalimzoda and Siitonen (2022) found a positive relationship between the tendency to use Russian media sources and higher involvement in Russian culture. We propose that there may be several open questions to be explored in the intersection between language(s), media, and acculturation.
Conclusions
One of the results of our study is that the dataset ended up challenging the way we approach migration. The inventory we utilized (Carlson & Güler 2018), with its terminology, does not seem to cover minority communities, or so-called second- and third-generation immigrant communities that belong to multiple backgrounds at the same time. The inventory uses terms such as ‘culture of origin’ and ‘culture of destination,’ which may feel alienating for those minorities who have no culture of destination as such. Coming up with alternative terms is not simple either. While in some cases, a term such as ‘ethnicity’ may work well, in other cases, it may also lead to simplistic or alienating outcomes. On the other hand, despite the partial deviations toward the culture of origin or destination, on the whole, Russian speakers in our survey predominantly scored close to biculturalism. This means they could be seen as both leaning toward the culture of destination while retaining a connection to their culture of origin. This outcome was possible given the continuous nature of the measurement scale we utilized, where the CI and CP measurements combine information from the culture of origin and the destination culture scales and preserve the difference in scores rather than cutting them off at some arbitrary point.
The study found that knowing the local language was connected to how much individuals engaged with the local culture. Going beyond just knowing the language, what mattered even more was the language people actually reported using in their daily lives. For example, using the Russian language outside of home was linked to higher CP toward Russian culture (culture of origin). The study also highlights the bidirectional relationship between language use and CP. Understanding these connections is important because it helps us grasp how language and CI are intertwined. This knowledge can be valuable for supporting individuals in their involvement with the locality that they find themselves in. Though the dynamic nature of human choice should be kept in mind, studies such as this, by describing communities and their preferences, can provide useful knowledge about acculturation.
Data Accessibility Statement
The original survey data used for this study contains larger data, and other research outputs based on this data are under development. However, under reasonable request from the authors, customized data for this study will be possible, with the permission of the ethical board of the University of Jyvaskyla. The Cultural Involvement and Cultural Preference inventory that is used in this study is publicly available from the previous authors. https://link.springer.com/article/10.1007%2Fs12134-018-0554-4.
Appendices
Appendices
Appendix 1
Two-way analysis of variance for language proficiency and CI.
| DESCRIPTIVE STATISTICS | ||||
|---|---|---|---|---|
| DEPENDENT VARIABLE: CULTURAL INVOLVEMENT (CI) | ||||
| FINNISH OR LATVIAN | SECOND LANGUAGE PROFICIENCY | MEAN | STD. DEVIATION | N |
| Latvian sample | Latvian/Finnish | 6.5000 | 1.01105 | 46 |
| English | 5.8333 | 0.91287 | 30 | |
| Both English and Latvian/Finnish | 6.1333 | 1.04312 | 15 | |
| Total | 6.2198 | 1.01983 | 91 | |
| Finnish Sample | Latvian/Finnish | 6.5726 | 0.79880 | 62 |
| English | 5.9180 | 0.79880 | 61 | |
| Both English and Latvian/Finnish | 6.6500 | 0.74722 | 10 | |
| Total | 6.2782 | 0.95428 | 133 | |
| Total | Latvian/Finnish | 6.5417 | 0.89161 | 108 |
| English | 5.8901 | 0.97696 | 91 | |
| Both English and Latvian/Finnish | 6.3400 | 0.95438 | 25 | |
| Total | 6.2545 | 0.97960 | 224 | |
Appendix 2
Two-way analysis of variance for language proficiency and CP.
| DESCRIPTIVE STATISTICS | ||||
|---|---|---|---|---|
| DEPENDENT VARIABLE: CULTURAL PREFERENCE (CP) | ||||
| FINNISH OR LATVIAN | SECOND LANGUAGE PROFICIENCY | MEAN | STD. DEVIATION | N |
| Latvian sample | Latvian/Finnish | 0.9130 | 1.29230 | 46 |
| English | 0.9667 | 1.14420 | 30 | |
| Both English and Latvian/Finnish | 1.2667 | 1.14746 | 15 | |
| Total | 0.9890 | 1.21559 | 91 | |
| Finnish sample | Latvian/Finnish | 0.2500 | 1.17609 | 62 |
| English | 0.7213 | 1.20597 | 61 | |
| Both English and Latvian/Finnish | 0.3500 | 0.88349 | 10 | |
| Total | 0.4737 | 1.18596 | 133 | |
| Total | Latvian/Finnish | 0.5324 | 1.26468 | 108 |
| English | 0.8022 | 1.18528 | 91 | |
| Both English and Latvian/Finnish | 0.9000 | 1.12731 | 25 | |
| Total | 0.6830 | 1.22199 | 224 | |
Appendix 3
Two-way analysis of variance for most used language and CI.
| DESCRIPTIVE STATISTICS | ||||
|---|---|---|---|---|
| DEPENDENT VARIABLE: CULTURAL INVOLVEMENT (CI) | ||||
| FINNISH OR LATVIAN | MOST USED LANGUAGE | MEAN | STD. DEVIATION | N |
| Latvian sample | Finnish/Latvian | 6.9375 | 0.83417 | 16 |
| Russian | 6.0625 | 1.00680 | 72 | |
| English | 6.1667 | 0.76376 | 3 | |
| Total | 6.2198 | 1.01983 | 91 | |
| Finnish sample | Finnish/Latvian | 6.6574 | 0.75125 | 54 |
| Russian | 6.1974 | 0.85059 | 38 | |
| English | 5.8537 | 1.09684 | 41 | |
| Total | 6.2782 | 0.95428 | 133 | |
| Total | Finnish/Latvian | 6.7214 | 0.77383 | 70 |
| Russian | 6.1091 | 0.95394 | 110 | |
| English | 5.8750 | 1.07360 | 44 | |
| Total | 6.2545 | 0.97960 | 224 | |
Appendix 4
Two-way analysis of variance for most used language and CP.
| DESCRIPTIVE STATISTICS | ||||
|---|---|---|---|---|
| DEPENDENT VARIABLE: CULTURAL PREFERENCE (CP) | ||||
| FINNISH OR LATVIAN | MOST USED LANGUAGE | MEAN | STD. DEVIATION | N |
| Latvian sample | Finnish/Latvian | –0.3125 | 1.06262 | 16 |
| Russian | 1.2986 | 1.04699 | 72 | |
| English | 0.5000 | 1.32288 | 3 | |
| Total | 0.9890 | 1.21559 | 91 | |
| Finnish sample | Finnish/Latvian | –0.1204 | 0.99496 | 54 |
| Russian | 1.2763 | 1.24498 | 38 | |
| English | 0.5122 | 0.89783 | 41 | |
| Total | 0.4737 | 1.18596 | 133 | |
| Total | Finnish/Latvian | –0.1643 | 1.00622 | 70 |
| Russian | 1.2909 | 1.11368 | 110 | |
| English | 0.5114 | 0.91174 | 44 | |
| Total | 0.6830 | 1.22199 | 224 | |
Notes
Competing Interests
The authors have no competing interests to declare.
Author Contributions
Ilkhom Khalimzoda has been the main responsible for all research processes as a main author. Marko Siitonen has contributed and participated in many stages, such as study design, reviewing the analysis, conclusion, and continuous revisions. Both authors read and approved the final manuscript.