
Introduction
Social psychological research on group processes and intergroup relations has been a cornerstone of formal policies of desegregation in increasingly culturally and ethnically diverse societies, such as the United States and Europe (Durrheim & Dixon 2018). This pertains in particular to its message of the beneficial effects that positive intergroup contact can have, such as reducing levels of prejudice and racism (Allport 1954; Brown & Hewstone 2005; Dovidio, Gaertner & Kawakami 2003; Vezzali & Stathi 2017) and increasing positive and reducing negative emotions toward the outgroup (Pettigrew & Tropp 2006). Nevertheless, a growing body of research has demonstrated that even in societies that are desegregated at a formal level, institutional segregation between ethnic majority and minority groups prevails, for instance, in the contexts of housing, health care, and employment (Bettencourt, Dixon & Castro 2019). Furthermore, immigrant communities often remain segregated at the level of everyday experiences in public spaces, where, if they occur, intergroup contact experiences are predominantly negative (e.g., Durrheim & Dixon 2018; Reimer & Sengupta 2022). Indeed, here is a shortage of research-based knowledge of the conditions in which, in supposedly integrated settings, segregation prevails in people’s everyday lives (Dixon et al. 2020).
Studies approaching these issues from a microecological perspective on intergroup interactions allow researchers to gauge the level and nature of contact between segregated groups (Bettencourt, Dixon & Castro 2019). They have high ecological validity, and can provide vital knowledge for enabling social integration, reducing intergroup prejudice, and promoting equality at the level of people’s everyday living spaces. Thus, they can inform intervention to target and promote social change (Durrheim & Dixon 2018). However, studying interracial contact at the level of everyday activity spaces is a methodologically challenging endeavor (Dixon et al. 2022; Tredoux et al. 2005). Bettencourt, Dixon and Castro (2019) have, accordingly, emphasized the need for methodological innovation and development in the field.
By exploring the microecology of ethnic and racial contact and segregation in Helsinki, Finland, this study seeks to provide a twofold contribution to the literature on racial contact and segregation. First, the study proposes observational census as a fruitful methodology for researching microecological segregation. The advantages of this method, we shall argue, are especially pertinent when it comes to researching groups, such as minors and racialized minority members that are difficult to reach, particularly on a large-scale, through more traditional research methods. Second, it provides novel results on the topic in the under-explored region of the Nordics, where microecological patterns of segregation and contact are, in international comparison, more recent or only just emerging. Through analyses of 6,400 observations of real-life microecological contact and segregation, the study advances our understanding of such patterns across racial, gender, and generational lines, as well as of the temporal and spatial dimensions of these dynamics.
The Microecology of Segregation
A Discouraging State of the Art
The emerging research on the microecology of segregation has sought to explain why desegregation policies at the institutional level do not necessarily translate into intergroup contact at the level of people’s lived experiences. Indeed, while the ethnic and racial divisions in the residential organization of cities have been a central topic in segregation research, much less is known about the informal, mundane ‘grassroot level’ patterns of segregation that persist in the relations and spaces of people’s everyday lives. A recent review of the literature by Bettencourt, Dixon and Castro (2019) revealed less than 40 studies on the topic. These studies have employed diverse operationalizations of microecological segregation, examining, for instance, social interactions across group boundaries in educational settings, playgrounds, and other recreational spaces, shops, and cafes, as well as seating behavior in public transports. In their summary of the literature until 2019, Bettencourt, Dixon and Castro (2019, abstract) conclude that ‘people generally maintain patterns of ingroup isolation as a result of negative attitudes and stereotypes; ingroup identification and threat; or feelings of anxiety, fear and insecurity’. Segregation at the microecological level also often reflects the ‘macro’ demographic level of a city: the ethnic organization of residential segregation and demographic patterns tend to be reproduced in people’s everyday activity spaces, including public places and transport (Swyngedouw 2013).
With a few exceptions—such as the recent work of Finell and colleagues (e.g., Paajanen et al. 2022b; Riikonen et al. 2023) exploring informal ethnic segregation among mothers in playgrounds in Finland—these studies have been conducted in the context of postapartheid South Africa (e.g., Dixon & Durrheim, 2010; Tredoux & Dixon 2009), Israel (e.g., Harel 2004), the United States (e.g., Swyngedouw 2013), and the United Kingdom, especially Northern Ireland (Dixon et al. 2020, 2022; McKeown et al. 2012). This line of research has begun to shed light on the reasons behind and behavioral and situational factors associated with the reproduction of microecological divisions in public spaces along racial, religious, socioeconomic, or gendered lines (Bettencourt, Dixon & Castro 2019) in contexts where racial relations are characterized by deeply ingrained historical antagonisms.
The most recent studies on microecological patterns of segregation in the European and North American context do not paint a very positive picture of the extent and character of everyday intergroup contact. Experimental work in the United States (Anicich et al. 2021) suggests that even though racial diversity has increased at the societal level, White individuals tend to structure their everyday activities and institutional contacts to avoid intergroup contact. In line with the review of Bettencourt, Dixon and Castro (2019), the authors found that for Whites, anticipated intergroup anxiety was the main reason for this ‘self-perpetuating cycle of segregation’. In the South African context, multiple studies (Dixon & Durrheim 2003; Durrheim 2005; Durrheim & Dixon 2005) have demonstrated that even though institutional policies of segregation have been abandoned, racial segregation prevails in people’s everyday activity spaces. For instance, officially desegregated beaches remain characterized by temporal patterns of movement and avoidance between White and Black beachgoers, with White people typically occupying the beachfront earlier in the day and withdrawing when Black people begin to enter.
Qualitative work in the Nordic context has shown the complex ways in which attributions of agency and responsibility influence whether majority and minority members engage in intergroup contact in real-life situations (Riikonen et al. 2023). Indeed, among the scarce research on microecological segregation in the Nordics, studies on the interethnic contact among mothers representing the ethnic majority and minority populations have confirmed that the extent of such contact is indeed low (e.g., Paajanen et al. 2022b; Riikonen et al. 2023). When it comes to public spaces, such as playgrounds, normative rhythms, and parenting practices, as well as group norms and the tendency to remain among members of one’s racial ingroup serve to (re)produce exclusive practices and limit interethnic contact among parents (Paajanen et al. 2022b). Further, it seems that the presence of children affects (the lack of) everyday intergroup contact among parents, in both positive (providing practical opportunities for contact) and negative ways (the experience of anxiety or stress during the encounter, due for instance to lacking language skills; Paajanen et al. 2022a).
Laurence (2019) argues that the question of (the obstacles to) positive intergroup contact across ethnic lines in everyday settings is a particularly delicate issue for young people. This is because apart from being in a life-stage of attitude formation toward other ethnic groups (Kinder & Sears 1981), young people may be especially susceptible to the increased affective societal polarization on issues related to immigration and multiculturalism, and to the rising influence of far-right and anti-immigration groups (Coppock & McGovern 2014). Further, mixing ethnic groups in school settings is not always possible in practice, and even when it is this does not necessarily translate into positive intergroup relations—in fact, negative experiences may increase prejudice and intergroup animosity (Bekhuis, Ruiter & Coenders 2013). Accordingly, Laurence (2019) concludes that to effectively foster positive everyday intergroup contact, attempts at organized engagement of youth (in interethnic contact activities such as sports) must consider the structural barriers for desegregation that exist in the real-life settings of those involved.
Methodological Challenges in Research on Microecological Segregation
The line of research outlined previously demonstrates the complex and multifaceted nature of intergroup contact and segregation at the microecological level. An important but challenging task for research in the field is to develop methods that can consider the intersection of temporal, spatial, gender, and generational factors at play in everyday racial contact and segregation.
Studies on microecological contact and segregation have deployed a variety of methods, including observations and ethnographic field studies, individual and focus-group interviews, or a combination of these (e.g., Dixon & Durrheim 2003), questionnaires (e.g., McKeown et al. 2012), with more recent work in the context of Northern Ireland using multimethodological approaches involving GPS tracking, GIS analytics, interviews, and photo elicitations (Dixon et al. 2020, 2022). Research on everyday, informal patterns of segregation is, however, imbued with methodological challenges, as the multidimensional patterns of people’s engagement in or avoidance of intergroup contact is difficult to capture and interpret adequately (Dixon et. al. 2020, 2022; Tredoux et al. 2005). In the context of segregated religious communities in Northern Ireland, Dixon et al. (2020, 2022) have deployed different methodologies, for instance, walking interviews alongside GPS tracking, to explore the identity dynamics involved in the historically divided everyday activity spaces of Protestants and Catholics in Belfast. Bringing the research tradition of time geography of activity space segregation into dialogue with research on place identity, Dixon and colleagues demonstrate the ways in which the interrelated dynamics of place belonging and alienation influence people’s everyday mobility choices that maintain and reproduce group divisions.
In South Africa, with a strong tradition of research on the persisting microecological segregation between White and Black citizens in the postapartheid era, scholars have emphasized that to understand the production and reproduction of informal patterns of segregation, research must be able to consider the temporality and spatiality of these patterns (Tredoux et al. 2005). To this end, Tredoux and colleagues advocate the deployment and development of observational methods for the study of microecological segregation and contact in people’s everyday activity spaces, as these methods are particularly useful for capturing how such processes occur over time and space.
The Context and Aims of the Present Study
In contrast to the majority of studies reviewed previously exploring racial and religious patterns of segregation and intergroup antagonism with deep historical roots, the present study examines ‘newer’ forms of microecological segregation and contact in the Finnish capital Helsinki. Helsinki is a city with a rather short history of large-scale immigration, out of the share of the population with foreign background, over half have lived less than 20 years in the country (2020). With a population of 660,000 (City of Helsinki 2021) and a 16.9% share of residents with foreign background (City of Helsinki 2019), the Finnish capital Helsinki is the country’s biggest and most diverse city in this regard. Finnish legislation does not allow for keeping registers of the ethnicity of individual residents. Therefore, estimations about the levels of ethnic segregation are based on the number of residents with foreign background, entailing residents with a foreign language, that is, other than Finnish, Swedish, or Sami, as their first language, or with a foreign nationality (City of Helsinki 2019). Therefore, although such information doesn’t directly correspond to the ethnic composition of the city’s population, it is against this background that we in the present study approach the topics of microecological intergroup segregation and contact.
The city of Helsinki is divided into eight subdivisions. At the level of residential demographics, the most diverse areas, with a 28.8% share of residents with foreign background, are located in the eastern subdivision (although Kaarela in the western subdivision and Pukinmäki in the northwest subdivision are also diverse [25% and 24% of foreign speakers, respectively]; City of Helsinki 2021). Approximately half of the population with foreign background are of European descent, whereas 30% are of Asian and 20% of African background. At the end of 2020, the biggest groups originated from the former Soviet Union (18,401), Estonia (11,760), Somalia (11,948), Irak (6,522), and China (3,966; City of Helsinki 2019).
Despite the rather short history of immigration and comparatively low share of residents with foreign background, Helsinki presently faces increasing challenges in terms of contact between majority and minority groups. Recent reports of the European Commission against Racism and Intolerance show that in Finland and especially in the capital region, everyday experiences of racism, hate-speech, and hate-related crime are among the highest in Europe (ECRI 2019; FRA 2018). The European Union Minorities and Discrimination Survey shows that discrimination in everyday situations and settings, such as in public services, employment, and health care, is particularly widespread among the population originating from Sub-Saharan Africa: nearly half (45%) of the respondents reported that they have experienced discrimination during the past year, and 60% during the five past years (FRA 2018). Furthermore, in Helsinki, although low in international comparison, ethnic segregation at the macro-level (e.g., residential areas, educational settings) is rapidly increasing (City of Helsinki n.d.; Helsingin Sanomat 2022). According to a report from 2016 (Hirvonen & Puustinen 2016), the most segregated language groups in Helsinki in terms of residential demographics are Albanian and Somali speakers as well as Vietnamese and Persian speakers, whereas the least segregated ones are the English, Russian, Thai, and Estonian speakers. Those with Chinese, Kurdish, Arabian, and Turkish as their first language are positioned in between these groups in terms of residential segregation. Little is known, however, of the spatial and temporal, as well as the generational aspects at play in these processes as they occur at the level of people’s lived experiences. As such, Helsinki provides an interesting context for studying of microecological patterns of contact and segregation at an early stage, which implies promising prospects for enabling positive intergroup contact at the level of people’s everyday mobility spaces, as well as for informing interventions to promote positive intergroup relations.
In this study, we primarily seek to showcase the method of observational census for studying microecological contact and segregation, and in doing so, to provide insights into how these phenomena occur in the everyday lives of people in the context of Helsinki. In contrast to the methods deployed in the pioneering as well as the more recent research outlined previously, including smaller-scale observations in university settings (e.g., Tredoux et al. 2005), experimental designs and surveys (Anicich et al. 2021), (walking) interviews and GPS tracking (Dixon et al. 2022), observational census allows for examining microecological contact and segregation without the involvement of the researcher, and without active recruitment of participants. Thus, the method has great potential when it comes to studying socially sensitive topics, such as attitudes and behavior related to avoidance versus seeking of intergroup contact. Specifically, certain types of survey respondents often refrain from answering immigration-related questions, introducing systematic bias into the results (Piekut 2021). Moreover, other recent results investigating the scope of social desirability bias in response to survey items concerning anti-immigrant sentiment show that self-presentational concerns are far more ubiquitous than has been previously assumed (Rinken et al. 2021). Even more importantly, the method allows for studying groups, such as racial minority members (Font & Méndez 2013) and young males (Corry et al. 2017), who are not easy to reach through more established research methods. Finally, the method enables the collection of vast amounts of data without being labor-intensive.
With our present study, then, we sought answers to questions, such as: What are the spatial, temporal, generational, and gendered dimensions of microecological segregation, and what can we learn from these based on our method of observational census? We wanted to investigate the quality and the quantity of the data that could be expected to be gathered by means of observational census given a certain amount of labor and other resources. Furthermore, as an initial proof of concept, we sought to explore the connections between racial heterogeneity of groups and other group qualities, such as group age and gender composition. That is, to determine whether the method warrants further pursuit, we sought to investigate whether the results that we obtain are consistent with what one would expect based on other (descriptive) statistics as well as previous research results in the social sciences literature—or, if are contradicted prior results, would these contradictions be meaningful and revealing. To show that there is validity to our method, we look at connections between racial heterogeneity of groups and other group qualities, such as group age and gender composition—are our results consistent with other (descriptive) statistics and with previous literature.
Before describing our method in more detail, a brief note on the concept of race and why we use this concept rather than, say, ethnicity, is in order. These two concepts have at times been used interchangeably in social psychological research (Hunt et al. 2000). However, the concept of ethnicity is typically associated with an individual’s membership in or identification with a particular cultural or ethnic group (APA, n.d.; Weber 1968 [1922]). In recent scholarship (e.g., Rye, Andersson & O’Reilly 2023) the concepts of race and racialization, in turn, have been connected to the ‘social and symbolic boundaries that are constructed between people and groups on a daily basis’ (Rye, Andersson & O’Reilly 2023: 5), and to how these reflect broader societal, cultural, and institutional patterns. Such processes of racialization, whereby both White and non-White individuals and groups can be constructed and categorized as ‘outsiders’ in relation to the majority group, serve to sustain and reproduce inequalities and segregation in people’s everyday lives. In deploying observational methods, it impossible in the present study to objectively or accurately determine an individual’s ethnicity, let alone that person’s sense of belonging to a given ethnic group (e.g., Pettersson, Liebkind & Sakki 2016; Verkuyten 2005). Therefore, we choose to approach the topic of intergroup contact and segregation through the concepts of ‘observed race’ and racialization, which allows us to examine how microlevel social and cultural boundaries between individuals and groups may be interpreted against macro-level information about the relations between a society’s majority and minority groups (Rye, Andersson & O’Reilly 2023). In the following, we describe how we have operationalized the concept of observed race in the present study.
Methods
Observational census is a method that entails collecting large amounts of data regarding a given phenomenon through documenting observations of naturally occurring behavior. In this study, the two research assistants working half-time during a total of three months (May to mid-June and August to mid-September 2022) collected altogether 22, 954 observations, 16,340 individual observations, and 6,603 group observations (11 unclear) of microecological contact and segregation. Their working time included the time it took to move from one area to another. Only group observations are considered in the present work. For documenting the observations of individuals and groups in Helsinki, the research assistants used an online questionnaire programmed with the software e-lomake. For each individual target, they recorded the observed gender (female, male, or unclear), observed race (White, Black, Middle Eastern, Latin, Asian, or Other), and age (<10, 11–14, 15–18, 19–30, 31–45, 46–64, 65–75, or 76+). For each group target, they recorded group size and the observed gender, race, and approximate age of each person in the group. The group coding was designed to capture the intersection between gender and race; that is, the number of people with a certain observed race was recorded separately for women and men. In addition, the city area and specific location (e.g., street, library) in which the observation was made were recorded. Finally, the date and time of observation were recorded automatically via questionnaire software. See supplement at https://osf.io/35wk6/ for the reporting form used in collecting the observations.
In the observation form, Helsinki’s seven larger subdivisions (suurpiiri) were included. The eighth (Sipoo) has recently been incorporated into Helsinki and was omitted from the study. We chose a set of districts from each of the seven older subdivisions, combining some neighboring administrative districts with very similar residential structure, with the goal of covering both ethnically heterogeneous and homogeneous areas, and areas of different socioeconomic levels, while keeping the data collection fluent and practical for the research assistants. This process resulted in 35 different areas of observation, complemented with the ‘other area’ category (for a more detailed account of decisions related to the development of the observational form, see supplement). Furthermore, based on research assistants’ experiences from the data collection, we decided to separate one smaller area within the administrative district Suurmetsä, Jakomäki, as its own area of observation during the second part of the data collection (August–September 2022).
Specific locations to be recorded were chosen based on research group’s general knowledge regarding places in Helsinki where groups of people gather and spend time. Observers were instructed to cover both residential areas and district centrums that often contain both public (e.g. libraries) and nonpublic (e.g. shops) spheres within each area; however, not all areas contained all possible specific locations and it was not possible to obtain identical observations from all areas.
The research assistants were instructed to register as many observations of individuals and groups as possible in the e-form. Initially, they recorded the observations on iPads, but mobile phones quickly proved more convenient and less attention-evoking. The research assistants followed a schedule (date, time of the day, area, and specific location) agreed upon with the project researchers, and worked both separately and together. Due to security reasons, no nighttime observations were made, and the research assistants were instructed to stay together during evening times. During data collection, the whole research team held regular meetings, where the experiences from the field were discussed, and the observation form and schedule were revised when necessary. We chose to focus the observations in the second phase of data collection to the areas in which most racial heterogeneity had been observed during the first phase (the eastern subdivision, see in the following). Throughout the data collection period, the research assistants reported that the observations went smoothly, that there was no major trouble with the e-form or with the coding of observations according to the categories in the form. Further, even though it was not always possible to register all observations of individuals and groups, especially during rush hours, they managed to register the vast majority of observations.
As our main focus in this study is on interracial contact among groups, we included only the group-level observations in our analysis. Note that our definition of a group is that it comprises two or more individuals. In this study, our interest lay in the observed racial composition of groups (consisting of two or more people) in the public cityscape of Helsinki.
Results
Racial Group Composition—General Results
Figure 1 shows the racial composition of the observed groups. The distinct clusters refer to different areas, the color scheme indicates racial composition (light blue = All-White; red = All-Non-White; purple = White-Non-White), and the size of the dot indicates the size of the group. That certain areas are more racially diverse than others is immediately transparent.
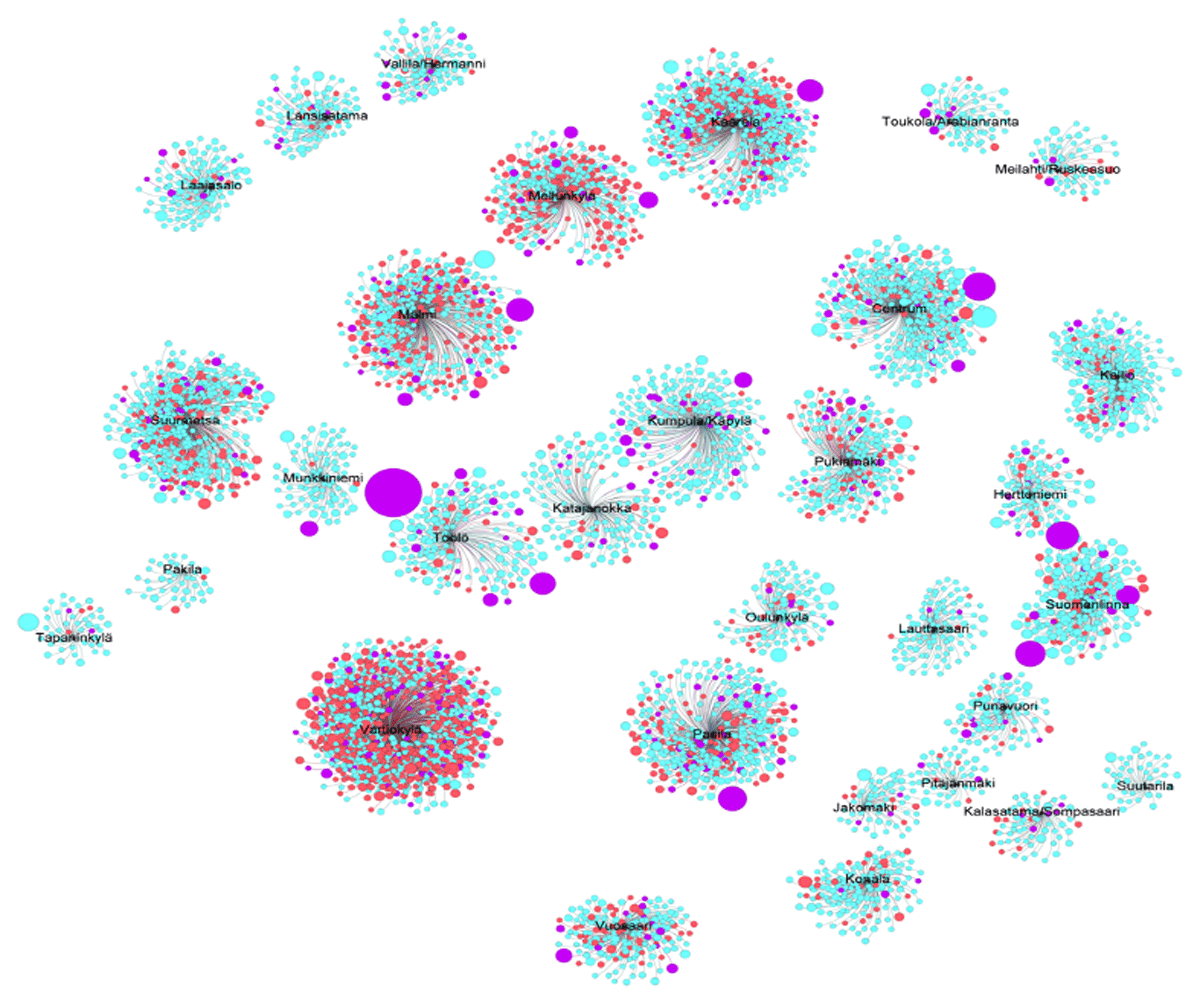
Figure 1
Observed racial composition of all groups (n = 6,496).
Generally, the administrative districts of Vartiokylä, Suurmetsä, Kaarela, Mellunkylä, and Vuosaari show highest level of non-White groups (in red), and these areas also have higher proportion of foreign-language speaking residents (24%–34%) than Helsinki in general (17%) based on residential statistics. Areas with low proportions of foreign-language speaking residents, such as Lauttasaari, Kallio, Laajasalo, and Munkkiniemi, are almost all-White in our data. There are exceptions to this general pattern—for instance, Malmi has 18% of foreign-speaking residents, but plenty of racial diversity in the observational census, whereas Jakomäki, a smaller area where 39% of residents are foreign-language speakers, appeared very White in the observational census: out of 57 groups observed in Jakomäki, three were racially heterogeneous and 53 homogeneous; six of the homogeneous groups were all non-White groups and 48 were all-White. It could be that ethnic minorities, regardless of where they live, flock toward those areas in which public spaces are more ethnically diverse. Another explanation, however, is that ethnic minorities residing in the area are not visible ethnic minorities (see the discussion section for further elaboration on this issue). For a detailed breakdown of observational statistics, see tables S1 and S2 in the supplement.
For instance, Figure 2 shows a close-up of Vartiokylä (as in Figure 1, light blue refers to an all-White group, red to an all-Non-White group, and purple to a White-Non-White group, and the size of the circle is proportional to group size). Here, in one of the ethnically most diverse administrative districts, there are equal numbers of White-only (47%) and non-White-only (45%) groups. However, even here, observed racially heterogeneous groups are a small minority (8%).
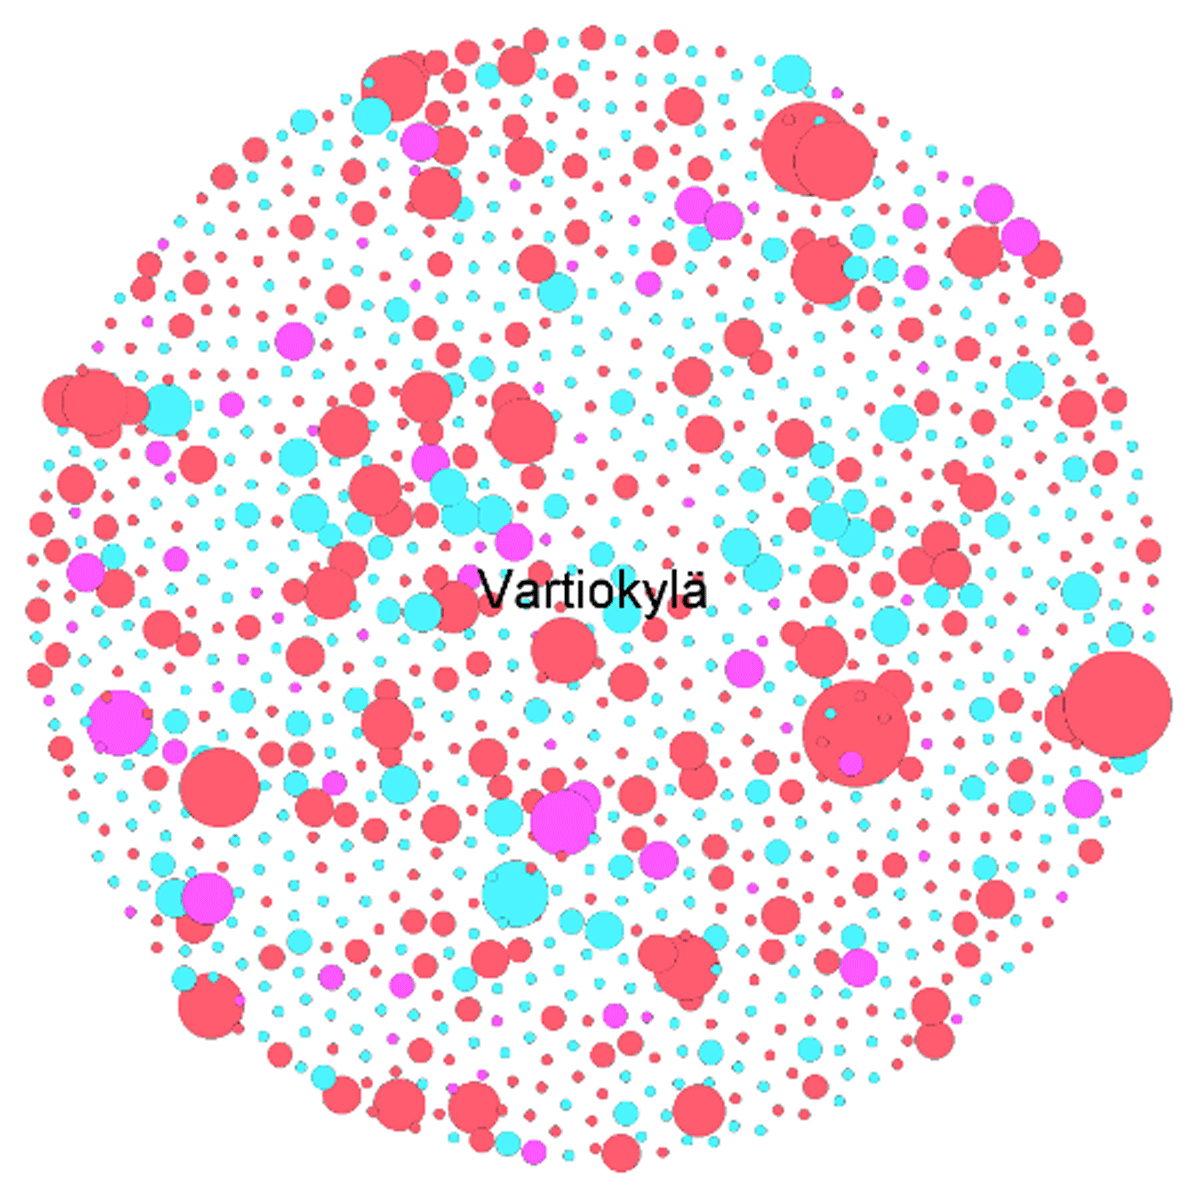
Figure 2
Observed racial composition of groups observed in the district of Vartiokylä.
Interaction of Racial Composition with Other Group Variables
In our proof-of-concept analyses, exploring whether there are connections between observed racial heterogeneity of groups and other group qualities, such as group age and gender composition, we focused primarily on predicting the presence of racial heterogeneity in a group. Racial heterogeneity was modeled as a binary variable (0 = no; 1 = yes) indicating whether there were both White and non-White individuals in the group.
Prior to conducting regression analyses described next, we did some initial data trimmings. First, groups with members from different non-White groups (e.g., Black and Asian people, n = 85) were omitted from the analyses because we were primarily interested in contact between White and non-White residents and dwellers of Helsinki. Second, observations from four city areas (Haaga, Tuomarinkylä, Kulosaari, and Viikki) as well as observations coded as ‘Other’ were removed because there were less than 13 observations per each of these area codes. This left us with 6,443 group observations from 31 Helsinki areas. The median number of observations per area was 123 (range = 39–1,104 per area). The median number of specific locations (e.g. street, station) within areas was 6 (range = 2–14).
After the data trimmings mentioned previously, there were 395 observed racially heterogeneous (i.e., White+ non-White) groups and 6,049 racially homogeneous groups. The variables used to predict racial heterogeneity in a group were group gender composition (three levels: female group, male group, and mixed-gender group), group size (five levels: 2, 3, 4, 5–7, and 8 or more people), group age (children and teen groups as well as 65–75 and 76+ groups were combined for these purposes so there were 8 levels: under 14 years only, 15–18 years only, 19–30 years only, 31–45 years only, 46–64 years only, 65+ years only, adults and children/teens, and adults from different age groups), time of day (four levels: 9 am to 12 pm, 12–4 pm, 4–7 pm, and after 7 pm), area socioeconomic status, measured as average income per household in the area (using 2017 statistics as these were the most recent available income statistics, derived from City of Helsinki open databases), and converted into a four-level factor based on sample income quartiles (in euros per household on average: 48,767; 54,519; 67,874; and 102,347), and whether the location was public or not (two-level factor, public vs. not public).1
We ran logistic regression models using the glm function in R with the binary racial heterogeneity (1 = both White and non-White people in the group; 0 = only White or only non-White people in the group) as the dependent variable.
First, using the lme4 package (Bates et al. 2015) in R, we ran an unconditional multilevel binary logistic regression model with no fixed predictors and with the random intercept of city area (Level 1 n = 6,440; Level 2 n = 31). This model had an intra-class correlation coefficient of 0.012, suggesting that there were no large differences between areas in observed racial heterogeneity (variance explained by area was 1.2%). Therefore, and to avoid convergence issues, the subsequent model was run as a single-level binary logistic regression.
Second, we ran a single-level binary logistic regression model with the predictors listed previously entered as factorial main effects. The main results are presented in Table 1. Estimated marginal mean probabilities of observed racial heterogeneity and the results of pairwise post hoc comparisons, computed with R emmeans package (Lenth 2021) using Tukey’s p-value correction, are presented in Tables S3 and S4. As shown in Table 1, racial heterogeneity was more likely in mixed-gender than in female groups (pairwise comparisons, shown in Table S4, showed that male and mixed-gender groups did not differ, estimate = –0.29, SE = 0.15, p = 0.124). Furthermore, racial heterogeneity was more likely in younger than in older groups. Predicted probabilities along with pairwise comparisons between all age groups are shown in Figure 3. As shown there, the probability of group racial heterogeneity decreased linearly with increasing group age. For instance, the predicted probability of racial heterogeneity in the ‘younger than 14 years’ age category was 35%, compared to 1.3% in the 65+ age category.
Table 1
Results of logistic regression model predicting racial heterogeneity in a group from other group attributes.
| ESTIMATE (SE) | p | |
|---|---|---|
| Intercept | –2.23 | |
| Gender (ref = female group) | ||
| Male group | 0.25 (0.16) | 0.115 |
| Mixed-gender group | 0.54 (0.15) | 0.0003 |
| Age (ref = 0–14 years) | ||
| 15–18 | –0.30 (0.21) | 0.143 |
| 19–30 | –0.69 (0.19) | 0.0004 |
| 31–45 | –1.26 (0.22) | <0.0001 |
| 46–64 | –2.68 (0.39) | <0.0001 |
| 65+ | –3.72 (0.60) | <0.0001 |
| Adults and children/teens | –2.11 (0.20) | <0.0001 |
| Adults and adults | –1.46 (0.25) | <0.0001 |
| Group size (ref = 2 people) | ||
| 3 people | 0.61 (0.15) | <0.0001 |
| 4 people | 1.41 (0.19) | <0.0001 |
| 5–7 people | 1.22 (0.28) | <0.0001 |
| 8+ people | 3.17 (0.43) | <0.0001 |
| Time of day (ref = 9–12) | ||
| 12–16 | 0.33 (0.20) | 0.095 |
| 16–19 | 0.25 (0.21) | 0.234 |
| 19–> | 0.44 (0.27) | 0.106 |
| Area income (ref = lowest Q) | ||
| Second quartile | 0.08 (0.14) | 0.569 |
| Third Q quartile | –0.16 (0.23) | 0.489 |
| Fourth Q quartile | –0.59 (0.19) | 0.002 |
| Public place (ref = public) | ||
| Not public | –0.04 (0.18) | 0.804 |
[i] Note. Unstandardized estimates are presented. Pseudo-R-squared (calculated via McFadden’s method) was 0.24. And 95% confidence levels for all contrast estimates are presented in Table S4. Income quartile limits were (in euros per household on average) 48,767, 54,519, 67,874, and 102,347.
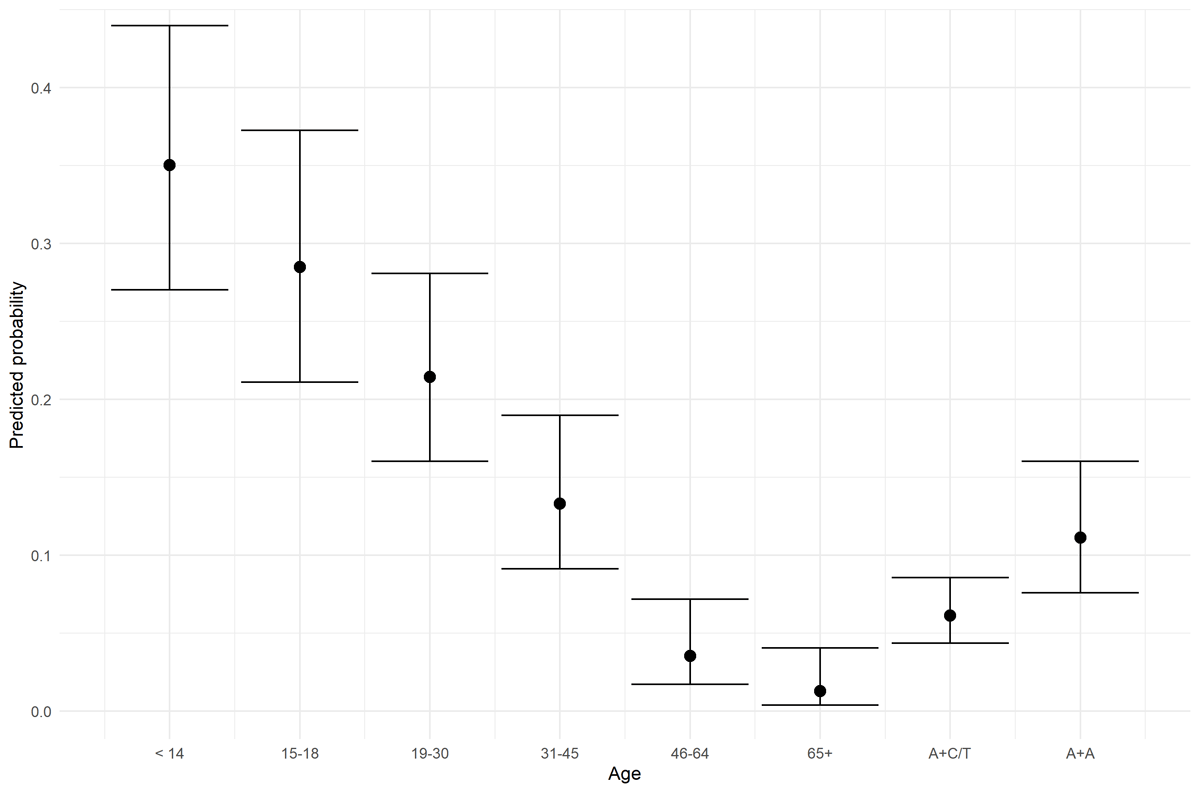
Figure 3
Predicted probabilities of observed racial heterogeneity in a group per age group, with 95% confidence levels. A + C/T = Adults with children and/or teens. A + A = Adults from different age groups.
Racial heterogeneity was generally more likely in larger than in smaller groups. Pairwise comparisons (Table S4) showed that it was less likely in two-person groups than in all other groups (all ps < 0.001) and more likely in eight+ groups than in all other groups (all ps < 0.001). It was also more likely in four- than in three-person groups (p = 0.001).
Furthermore, racial heterogeneity was more likely in areas in the lowest (estimate = 0.59, SE = 0.19, p = 0.001), and second lowest (estimate = 0.67, SE = 0.18, p = 0.001) income quartile than in the highest income quartile (see Table S4). Comparisons between time categories and between public versus nonpublic were nonsignificant.
Next, in order to investigate whether the intersection of observed gender and race would relate to how groups use the city space, we fitted a separate logistic regression model predicting nighttime appearance (before vs after 7 pm) from group gender and racial composition and their interaction. The results are presented in Table 2 and in Figure 4. Estimated probabilities and post hoc comparison contrasts are presented in Tables S5 and S6.
Table 2
Results from a logistic regression model predicting group’s nighttime (after 7 pm) appearance from group gender composition, group racial composition, and their interaction.
| B (SE) | p | |
|---|---|---|
| Intercept | –3.02 | |
| Gender comp. (ref = female) | ||
| Male group | 0.01 (0.26) | 0.971 |
| Mixed-gender group | 0.73 (0.37) | 0.047 |
| Racial comp. (ref = all-White group) | ||
| All non-White group | 0.17 (0.19) | 0.368 |
| Mixed race group | 0.48 (0.14) | <0.001 |
| NW × Male | 1.05 (0.32) | 0.001 |
| Mixed Ethn × Male | –0.73 (0.58) | 0.206 |
| NW × Mixed-Gender | –0.10 (0.32) | 0.764 |
| Mixed ethn. × Mixed-Gender | –0.05 (0.44) | 0.904 |
[i] Note. Unstandardized coefficients are presented. For pairwise contrasts (with confidence levels), see Table S6. Pseudo-R-squared (computed via McFadden’s method) was 0.02.
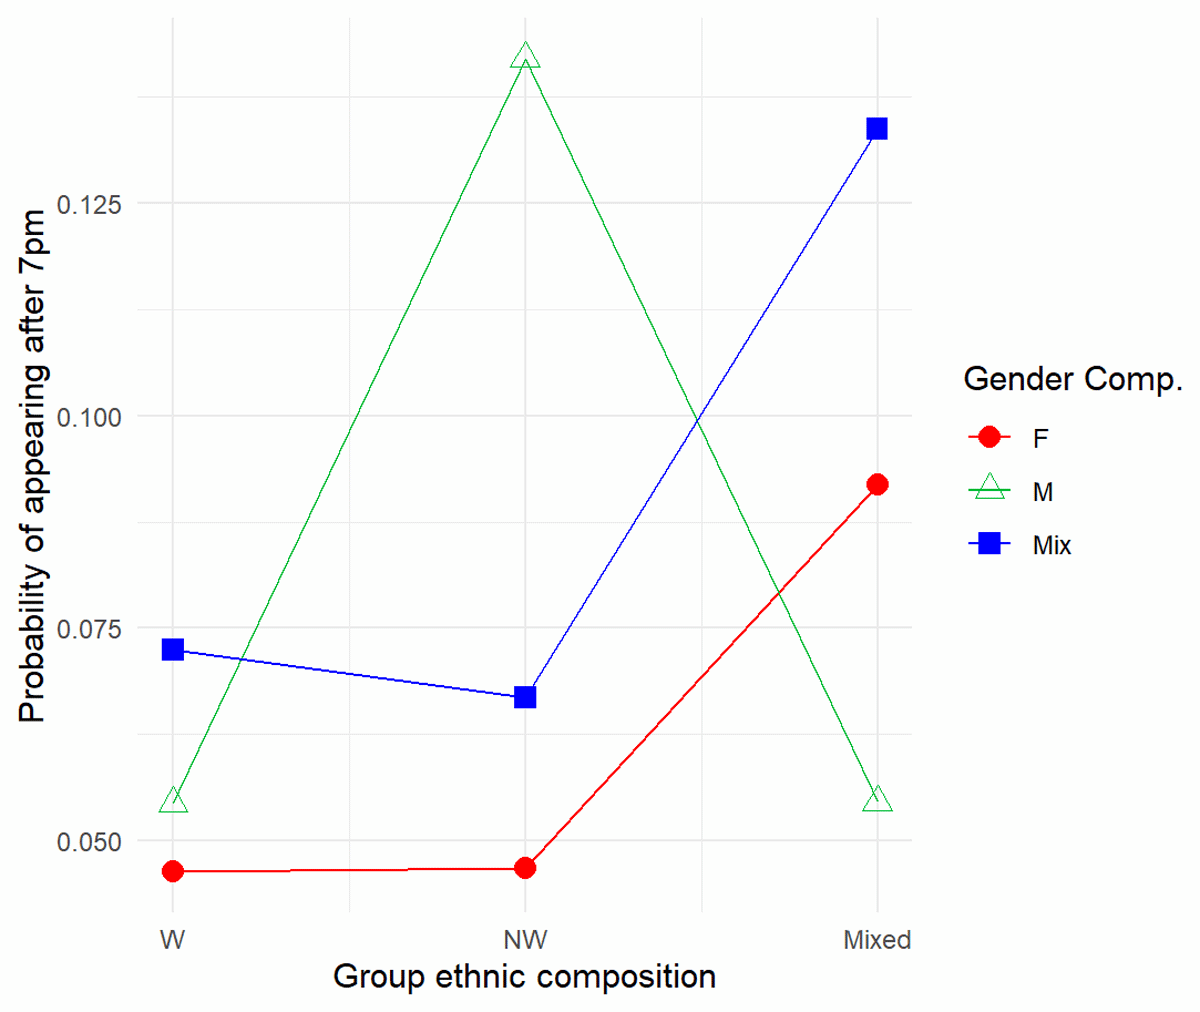
Figure 4
Nighttime appearance as a function of group gender and ethnic composition.
Figure 4 shows the predicted probabilities of appearing after 7 pm as a function of the interaction between a group’s racial and gender composition. As shown there, observed female and mixed-gender groups were more likely to appear at nighttime if the group was also of mixed race (vs. White or Non-White), whereas male groups were more likely to appear at nighttime if the group was Non-White (vs. White or Mixed). Somewhat interestingly, among all-female groups, White and Non-White groups were both equally unlikely to appear at nighttime (i.e., Non-White female groups were not particularly unlikely to appear at nighttime). However, as White female groups’ likelihood to appear at nighttime was very close to zero, differences would have been difficult to find.
Regarding formal comparisons (Table S6), White female groups were less likely to appear after 7 pm than White mixed-gender groups (contrast = –0.48, SE = 0.14, p = 0.003). Within Non-White groups, female groups were much less likely to appear after 7 pm than male groups (contrast = –1.22, SE = 0.26, p < 0.0001). Non-White male groups were also more likely to appear after 7 pm than Non-White mixed-gender groups (contrast = 0.84, SE = 0.22, p < 0.001).
To further explore and describe the nature of racial heterogeneity at the microecological level, we also employed latent class analysis using poLCA package (Drew & Linzer 2011) in R. poLCA uses a two-step iterative EM algorithm estimation method: first, class membership probabilities are estimated and in the second step, those estimates are altered to maximize the likelihood function. Parallel starts were utilized to ensure that the global maximum of the log-likelihood function would be reached.
For the latent class analysis, the non-White-non-White groups (n = 85) removed from the logistic regression were reincluded to explore the structure of the groups as comprehensibly as possible. Initially, all features used as predictors in the logistic regression analysis were used as indicators. However, it turned out that area income, time of day, and public place (vs. not) did not meaningfully separate clusters in the cluster solutions (see supplement, https://osf.io/35wk6/). Therefore, we dropped these three variables and used group size, age category, gender composition (categorized the same way as in the logistic regression), and a new three-level racial composition variable (1 = all-White group; 2 = all non-White group; and 3 = White-non-White group) as the basis of the cluster analysis. The non-White-non-White groups (n = 85) were classified as all non-White (category 2).
In the LCA, 2-, 3-, 4-, 5-, and 6-cluster solutions were examined. Table 3 shows the model comparison statistics. AIC, BIC, and SABIC stabilized between 4- and 5-cluster solutions, and 5-cluster solution was the most interpretable (see in the following). We chose this solution. Note, however, that entropy was low for the 5-cluster-solution, and not optimal for any solution; therefore, the class structure presented should be considered as illustrative rather than strongly reflective of actual group types. Average latent class posterior probabilities for each solution are presented in Table S7 in the OSF.
Table 3
Fit indices for the latent class solutions.
| AIC | BIC | SABIC | ENTROPY | |
|---|---|---|---|---|
| Two classes | 58,315.32 | 58,538.87 | 58,434.01 | 0.74 |
| Three classes | 57,646.42 | 57,985.13 | 57,826.25 | 0.66 |
| Four classes | 57,160.81 | 57,614.69 | 57,401.79 | 0.66 |
| Five classes | 57,015.53 | 57,584.58 | 57,317.65 | 0.64 |
| Six classes | 56,898.51 | 57,582.71 | 57,261.75 | 0.73 |
[i] Note. SABIC = sample-size adjusted BIC.
Figure 5 shows the frequencies of indicator levels in different classes for the chosen five-class solution (i.e., the raw counts for each indicator’s levels for each class are presented). The first class was represented by high numbers of All-White, older, two-person groups of mixed-gender. We labeled this group as White couples (29.2% of observations). The second class is represented by mostly female, mostly White young two- to three-person groups and adults with children. It seems likely that the ‘adults with children’ observations in this group consist of young adults and teens (i.e., friend groups crossing the age barrier between young adults and teens) instead of parents with children. Thus, we labeled this group as Small young female groups (30.8%). The third class was represented by mixed-gender groups of adults with children, White, or Non-White. We labeled this group as Families (16.3%). The fourth class was represented by different sized groups of teens or young adults, with all gender and race combinations. We label this group as Young heterogeneous groups (7.3%). The fifth class is represented by young adult and adult White and Non-White adult male two- to three-person groups and was labeled as Small male groups (16.4%).
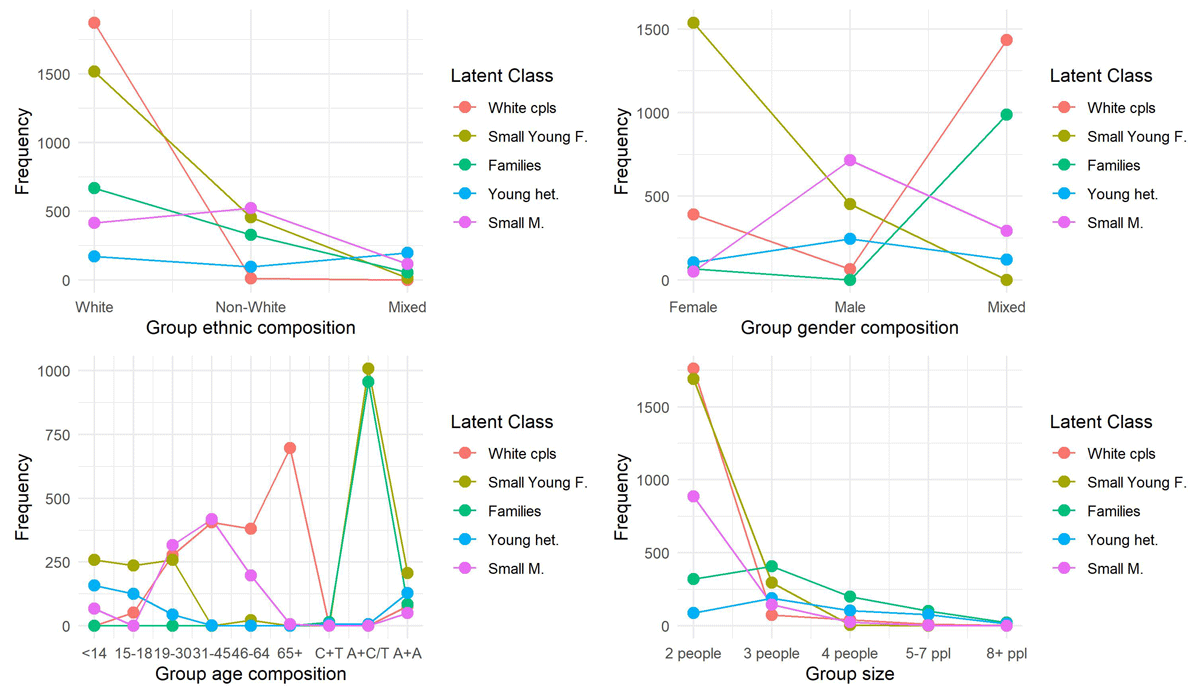
Figure 5
Frequencies of indicator levels in the 5-cluster solution.
Supplementary figures S1–S3 show the prevalence of groups assigned to these five classes in Helsinki and in specific areas and locations. We ran a series of chi-square tests to investigate the differences in group presence at different times of the day, in different income areas, and in public versus nonpublic places. All omnibus chi-square tests were significant at the p < 0.001 level, and we proceeded to test specific comparisons using the standardized residuals (str) approach (e.g. Beasley & Schumacker 1995) and the Holm–Hochberg p-value correction. The frequencies of groups from different clusters as a function of time, income, and public place are presented in Figure 6.
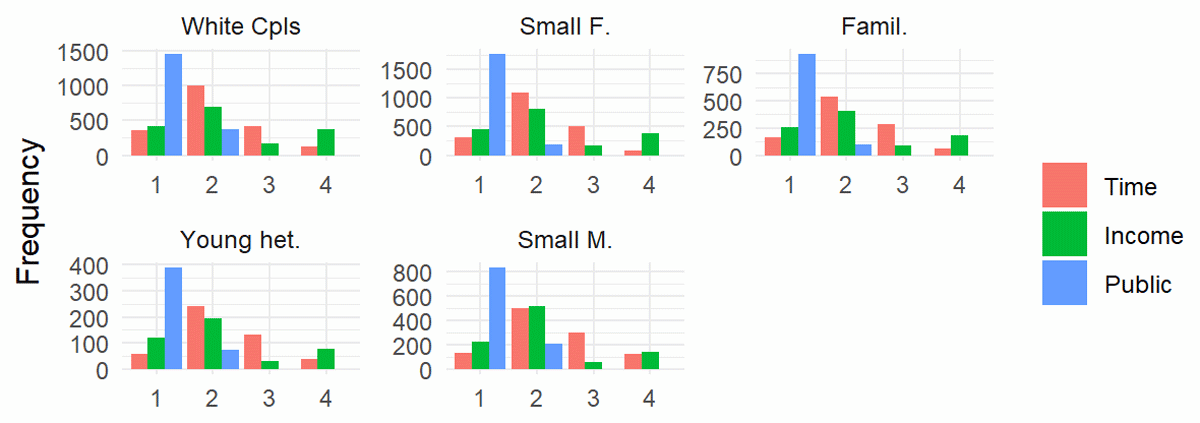
Figure 6
Frequencies of clusters at different times, in dirrernt income areas and in public vs. not public places.
Note. For ‘public’, 1 = public and 2 = not public.
White couples were more likely to appear in the mornings than Young heterogeneous groups (str = 3.17, p = 0.012), and Small male groups (str = 4.08, p < 0.001). White couples were also more likely to appear on early afternoon than Small male groups (str = 2.69, p = 0.036), and more likely to appear after 7 pm than Small female groups (str = 4.15, p < 0.001). However, White couples were less likely to appear between 4 and 7 pm (str = –3.86, p < 0.001) and after 7 pm (str = –4.30, p < 0.001) than Small male groups, and less likely to appear between 4 and 7 pm than Families (str = 3.17, p = 0.012).
Small female groups were more likely to appear in the early afternoon than Small male groups (str = 3.94, p < 0.001), but less likely to appear after 7 pm than Young heterogeneous groups (str = –4.12, p < 0.001) and Small male groups (str = –8.10, p < 0.0001).
Families were less likely to appear after 7 pm than Small male groups (str = –4.50, p < 0.0001).
There were no time-based differences between Small female groups and Families, or between Small male groups and Young heterogeneous groups.
Regarding area income quartiles, White couples were less likely to appear at the second income quartile areas than Small male groups (str = –6.38, p < 0.0001) and more likely to appear in the third (str = 3.37, p = 0.004) and highest quartile (str = 4.80, p < 0.0001) areas.
Small female groups were less likely to appear in second-quartile areas than Small male groups (str = –5.10, p < 0.0001) and more likely to appear in third (str = 3.19, p = 0.009) and highest (str = 3.74, p = 0.001) quartile areas than Small male groups. Families were also less likely to appear in second-quartile areas than Small male groups (str = –5.05, p < 0.0001), and Young heterogeneous groups were less likely to appear in second-quartile areas than Small male groups (str = –3.11, p = 0.015).
Regarding public places, White couples were more likely to appear in nonpublic venues than Small female groups (str = 9.72, p < 0.0001) and Families (str = 7.33, p < 0.0001). Furthermore, Young heterogeneous groups were more likely to be in a nonpublic place than Small female groups (str = 4.31, p < 0.0001), or Families (str = 3.48, p = 0.002). Small male groups were also more likely to appear in a nonpublic place than Small Female groups (str = 8.18, p < 0.0001) or Families (str = 6.37, p < 0.0001).
Discussion
Our observational census study of the nature of microecological contact and segregation in Helsinki had a twofold aim: to showcase a methodology for studying microecology of segregation and, in doing so, to shed light on real-life microlevel segregation in Helsinki. In terms of the first aim, we sought to respond to the call raised in previous work on microecological segregation of developing methods for studying this phenomenon in naturalistic settings (Dixon et al. 2022; Tredoux et al. 2005). Our study has suggested that observational census—observing people’s behavior as they make us of a city space in their everyday lives—is a step in this direction. As such, in comparison to studies deploying, for instance, survey and experimental methods (Anicich et al. 2021), interviews (Riikonen et al. 2023), walking interviews, and GPS tracking, the central advantage of this method is that it allows for examining patterns of microecological contact and segregation as they occur in people’s everyday living spaces, without the involvement of the researcher. In other words, through this method, one can study the prevalence of everyday intergroup interaction without prompting people about their attitudes or preferences in this regard, nonresponse bias, and social desirability bias both systematically distort responses to direct questions that concern interracial attitudes (Piekut 2021; Rinken et al. 2021). Furthermore, the method has advantages when it comes to studying groups that are challenging to reach through other methods, in particular young people (Corry et al. 2017) and members of ethnic or racial minorities (Font & Méndez 2013), and to reach these on a large-scale. Our point is not to criticize these or other methods; on the contrary, we strongly advocate the use of multiple methods for studying complex social phenomena, such as the present one, and observational census as a tool among others in this methodological toolkit.
At the same time, it is necessary to stress the shortcomings of documenting microecological contact and segregation across racial lines relying on the observations of researchers. This undoubtedly raises problems in terms of the objectivity and accuracy of the observations, as well as from an ethical point of view. As noted previously, it is clear that the method falls short in reliably documenting an individual’s race or ethnicity, or whether a person falls into the categories of foreign-born or foreign-language speakers, since all foreign-language speakers are not Black; and all Whites are not Finnish native speakers. Furthermore, the method does not allow for drawing any conclusions about people’s sense of ethnic identity (cf. Verkuyten 2005), nor of observing intergroup contact along ethnic or racial lines that is not visible to the researcher’s eyes. In the case of Helsinki, such contact could involve, for instance, that between members of the major minority groups of Russians or Estonians with the majority Finnish population. Although we, throughout data collection, did our best to adjust and improve the questionnaire used for the observations, we acknowledge that all such reliability and ethical concerns could not be overcome. Furthermore, a specific concern related to the latent class analysis results is that the data did not strongly support forming latent classes, as entropy for all solutions was below optimal levels (e.g., Weller, Bowen & Faubert 2020). Therefore, the LCA results should be considered as suggestive and illustrative rather than referring to actual, strongly different group types existing in Helsinki.
Turning to the second aim, our study confirms and sheds new light on the findings of previous research in many ways. In line with existing research (e.g., Anicich et al. 2021; Paajanen et al. 2022a; Riikonen et al. 2023), our study indicates that racial segregation dominates the micro-cityscape in Helsinki: only around 6% of the observed groups were racially heterogeneous in terms of both White and non-White individuals. In terms of those groups that were observed as racially mixed, some initial conclusions about their spatial, gendered, and generational patterns can be drawn.
First, at the microecological level, most observations of racially heterogenous groups were made in the eastern subdivision that statistically is the most diverse in terms of residential segregation. This finding is in line with studies, such as that of Swyngedouw (2013) who has highlighted the correspondence between macro- and microlevel patterns of intergroup contact and segregation. Nevertheless, we also note exceptions to this pattern, as hardly any racially heterogenous groups were observed in areas, such as Jakomäki, which is among the more diverse in terms of ethnic residential segregation. When interpreting such findings, it is important to consider other ‘macro-level’ aspects of potential relevance. For instance, Jakomäki is the area where the right-wing populist Finns Party enjoys the highest support figures in Helsinki (23.7% of the vote in the 2019 parliamentary elections, as compared to them across Helsinki average of 12.3%; Niemi et al. 2019). Thus, political ideology and polarization are factors that may be reflected in residents’ behavioral patterns in their everyday living spaces, fostering habits and norms of ‘flocking together’ with one’s ethnic ingroup (cf. Paajanen et al. 2022a).
Second, observed racial heterogeneity was more common among younger than older groups. It is important to bear in mind that Helsinki is a city with a rather recent history of large-scale immigration, and in comparison to the population as a whole, the proportion of young people is somewhat higher in the population with foreign background (City of Helsinki 2019). This may be directly reflected in our result of more racial diversity in the everyday activity spaces among the younger generations. Nevertheless, we also know that youth is a critical period for attitude formation toward other (racial) groups, and that young people tend to be particularly susceptible to far-right and anti-immigration political persuasion (Laurence 2019). The latter issue is in line with recent opinion polls in Finland suggesting that the right-wing populist Finns Party is by far the most popular party among first-time voters (Keski-Heikkilä 2023). In sum, the comparatively higher levels of observed racial heterogeneity among the younger groups is an intriguing and rather paradoxical, but also an encouraging finding that warrants closer investigation. Indeed, on a general level, the findings of our study suggest that focusing on youth and their attitudes and behaviors regarding microlevel intergroup contact and segregation should be further explored, for instance, through combining such data with statistics on political and ideological preferences.
Third, our findings show that observed racial heterogeneity was more likely in mixed-gender groups. This result is open to various interpretations. For instance, racially heterogeneous romantic relationships could at least in part explain the relatively high prevalence of these groups. Furthermore, these groups could be interpreted as contesting the persisting stereotype of ethnic minority families in which the parents are represented as patriarchal and oppressive (Keskinen et al. 2016). In this respect, our results are consistent with the finding of a recent study that focused on intergenerational negotiations of young people’s sexuality and romantic relationships in families that had migrated to Finland—the young in these families were allotted and exercised a high degree of autonomy (Peltola et al. 2017).
Fourth, even in the capital of the most gender equal country in the world (World Economic Forum [WEF] 2022), there are hints of a geography of women’s fear (cf. Dixon et al. 2022). This notion refers to the relation between women’s fear of male violence and their perception and use of public space (Valentine 1989). Our result, according to which Small male groups were more likely and Small female groups less likely to appear in the evenings, suggests that women may be more fearful of crime due to women’s heightened physical vulnerability to men. Especially in a Nordic context, daylight hours are very limited for much of the year, and this may turn environments that are inviting during the day into intimidating places avoided after dark (Nasar & Fisher 1993). Such considerations could also explain the prevalence of older couples in daytime.
Conclusion
The aim of this article was twofold: to showcase the method of observational census as a means of studying microecological patterns of segregation and contact, and to shed light on real-life microecological segregation in a Northern European capital city. Previous research has highlighted the need for methodological innovation and development (Bettencourt, Dixon & Castro 2019), and especially encouraged approaches to research on microecological segregation and contact in naturalistic settings (Dixon et al. 2022; Tredoux et al. 2005). In response to these calls, we argue that observational census is a fruitful way of mapping such patterns in the public spaces of a city, using modest temporal and monetary resources. The primary advantages of the method lie, first, in that it allows for studying groups that are difficult to reach by other means, such as racial and ethnic minorities and young people, and second, in its capacity for considering the intersecting patterns of temporality, spatiality, gender, and age in microecological processes of racial contact and segregation.
We acknowledge that as such, the method of observational census is limited in several ways. Most evidently, it relies on subjective observations of the race, gender, and age of the observed individuals and groups. This necessitates hesitations and concerns in terms of both ethics and validity: the individuals observed were not aware of the study, and we have no means to certify whether the observations are correct. This also has implications for the conclusions that may be drawn from a study such as ours: above all, they are tentative observations that require further exploration in future research.
Nevertheless, the method of observational census provides a unique opportunity to examine people’s engagement in and avoidance of intergroup contact in their everyday lives, something that is difficult to achieve through more common methods, such as experimental ones. One advantage of the method of observational census, from an ethical point of view, is that it does not entail any intrusion in people’s lives, and through the vast amount of anonymous data, does not infringe on their privacy or raise issues in terms of anonymity. We may conclude that the results that the method of observational census can produce are perhaps more correctly described as showing microecological patterns of contact and segregation in the eyes of the (White, middle-class, and highly educated) researcher than as an objective statement of facts. However, by offering a novel angle on an increasingly timely and pressing societal topic, the method of observational census can still provide an important methodological contribution to research on racial relations, integration, and intergroup contact. We suggest that observational census is particularly useful when combined with methods that can capture individuals’ subjective experiences, such as experience sampling methodology (O’Donnell et al. 2021) that documents individuals’ behaviors and interconnected emotions, and walking interviews that seeks to understand the relation between self and space (Evans & Jones 2011).
Data accessibility statement
The data used in this study are stored at the Helsinki Institute of Social Sciences and Humanities and is available from the authors on request. The online supplementary files can be directly accessed via this link: https://osf.io/35wk6/.
Notes
[4] Street, Mall, Playground, Park, Beach, Outdoors/Nature, Square/Market place, Street, Library, and Railway and Metro station were coded as ‘Public’, Restaurant, Bar, Cafe, and Store/Shop were coded as ‘Not Public’, and observations from Department stores (n = 29) and Queues (n = 55), deemed as ambiguous in this regard, were omitted. We acknowledge that Malls, Stations, and Libraries are not public places in the strict sense; however, people are allowed to enter these places freely and spend time in them without purchasing anything, setting them apart from, for instance, restaurants. Note that this public versus nonpublic distinction is empirically and not theoretically based.
Funding Information
This research was funded by the Helsinki Institute of Social Sciences and Humanities, HSSH, University of Helsinki.
Competing Interests
The authors have no competing interests to declare.