
Table I
Baseline comparison between NCB and CBR groups.
| Element | CBR (n=10) | NCB (n=10) | t | P |
|---|---|---|---|---|
| Age | 45.10±11.82 | 56.20±13.44 | -1.961 | 0.065 |
| Gender | 0.628 | |||
| Male | 6 (60.0) | 8 (80.0) | ||
| Female | 4 (40.0) | 2 (20.0) | ||
| Tumor location | 1.000a | |||
| Right | 3 (30.0) | 2 (20.0) | ||
| Center | 7 (70.0) | 8 (80.0) | ||
| T | 1.000a | |||
| T2 | 1 (10.0) | 0 (0.0) | ||
| T3 | 7 (70.0) | 8 (80.0) | ||
| T4 | 2 (20.0) | 2 (20.0) | ||
| N | 1.000a | |||
| N0 | 3 (30.0) | 3 (30.0) | ||
| N1 | 5 (50.0) | 5 (50.0) | ||
| N2 | 2 (20.0) | 1 (10.0) | ||
| N3 | 0 (0.0) | 1 (10.0) | ||
| Ml | 10 (100.0) | 10 (100.0) | ||
| Transfer site | 1.000a | |||
| Liver | 8 (80.0) | 7 (70.0) | ||
| Others | 2 (20.0) | 3 (30.0) | ||
| Gene expression | 1.000a | |||
| RAS or BRAF are mutant | 6 (60.0) | 5 (50.0) | ||
| RAS and BRAF are wild type | 4 (40.0) | 5 (50.0) | ||
| Whether the primary lesion has been resected | 0.303a | |||
| Yes | 9 (90.0) | 6 (60.0) | ||
| No | 1 (10.0) | 4 (40.0) | ||
| LDH | 201.96 ± 23.46 | 282.13 ± 67.76 | 3.535 | 0.005 |
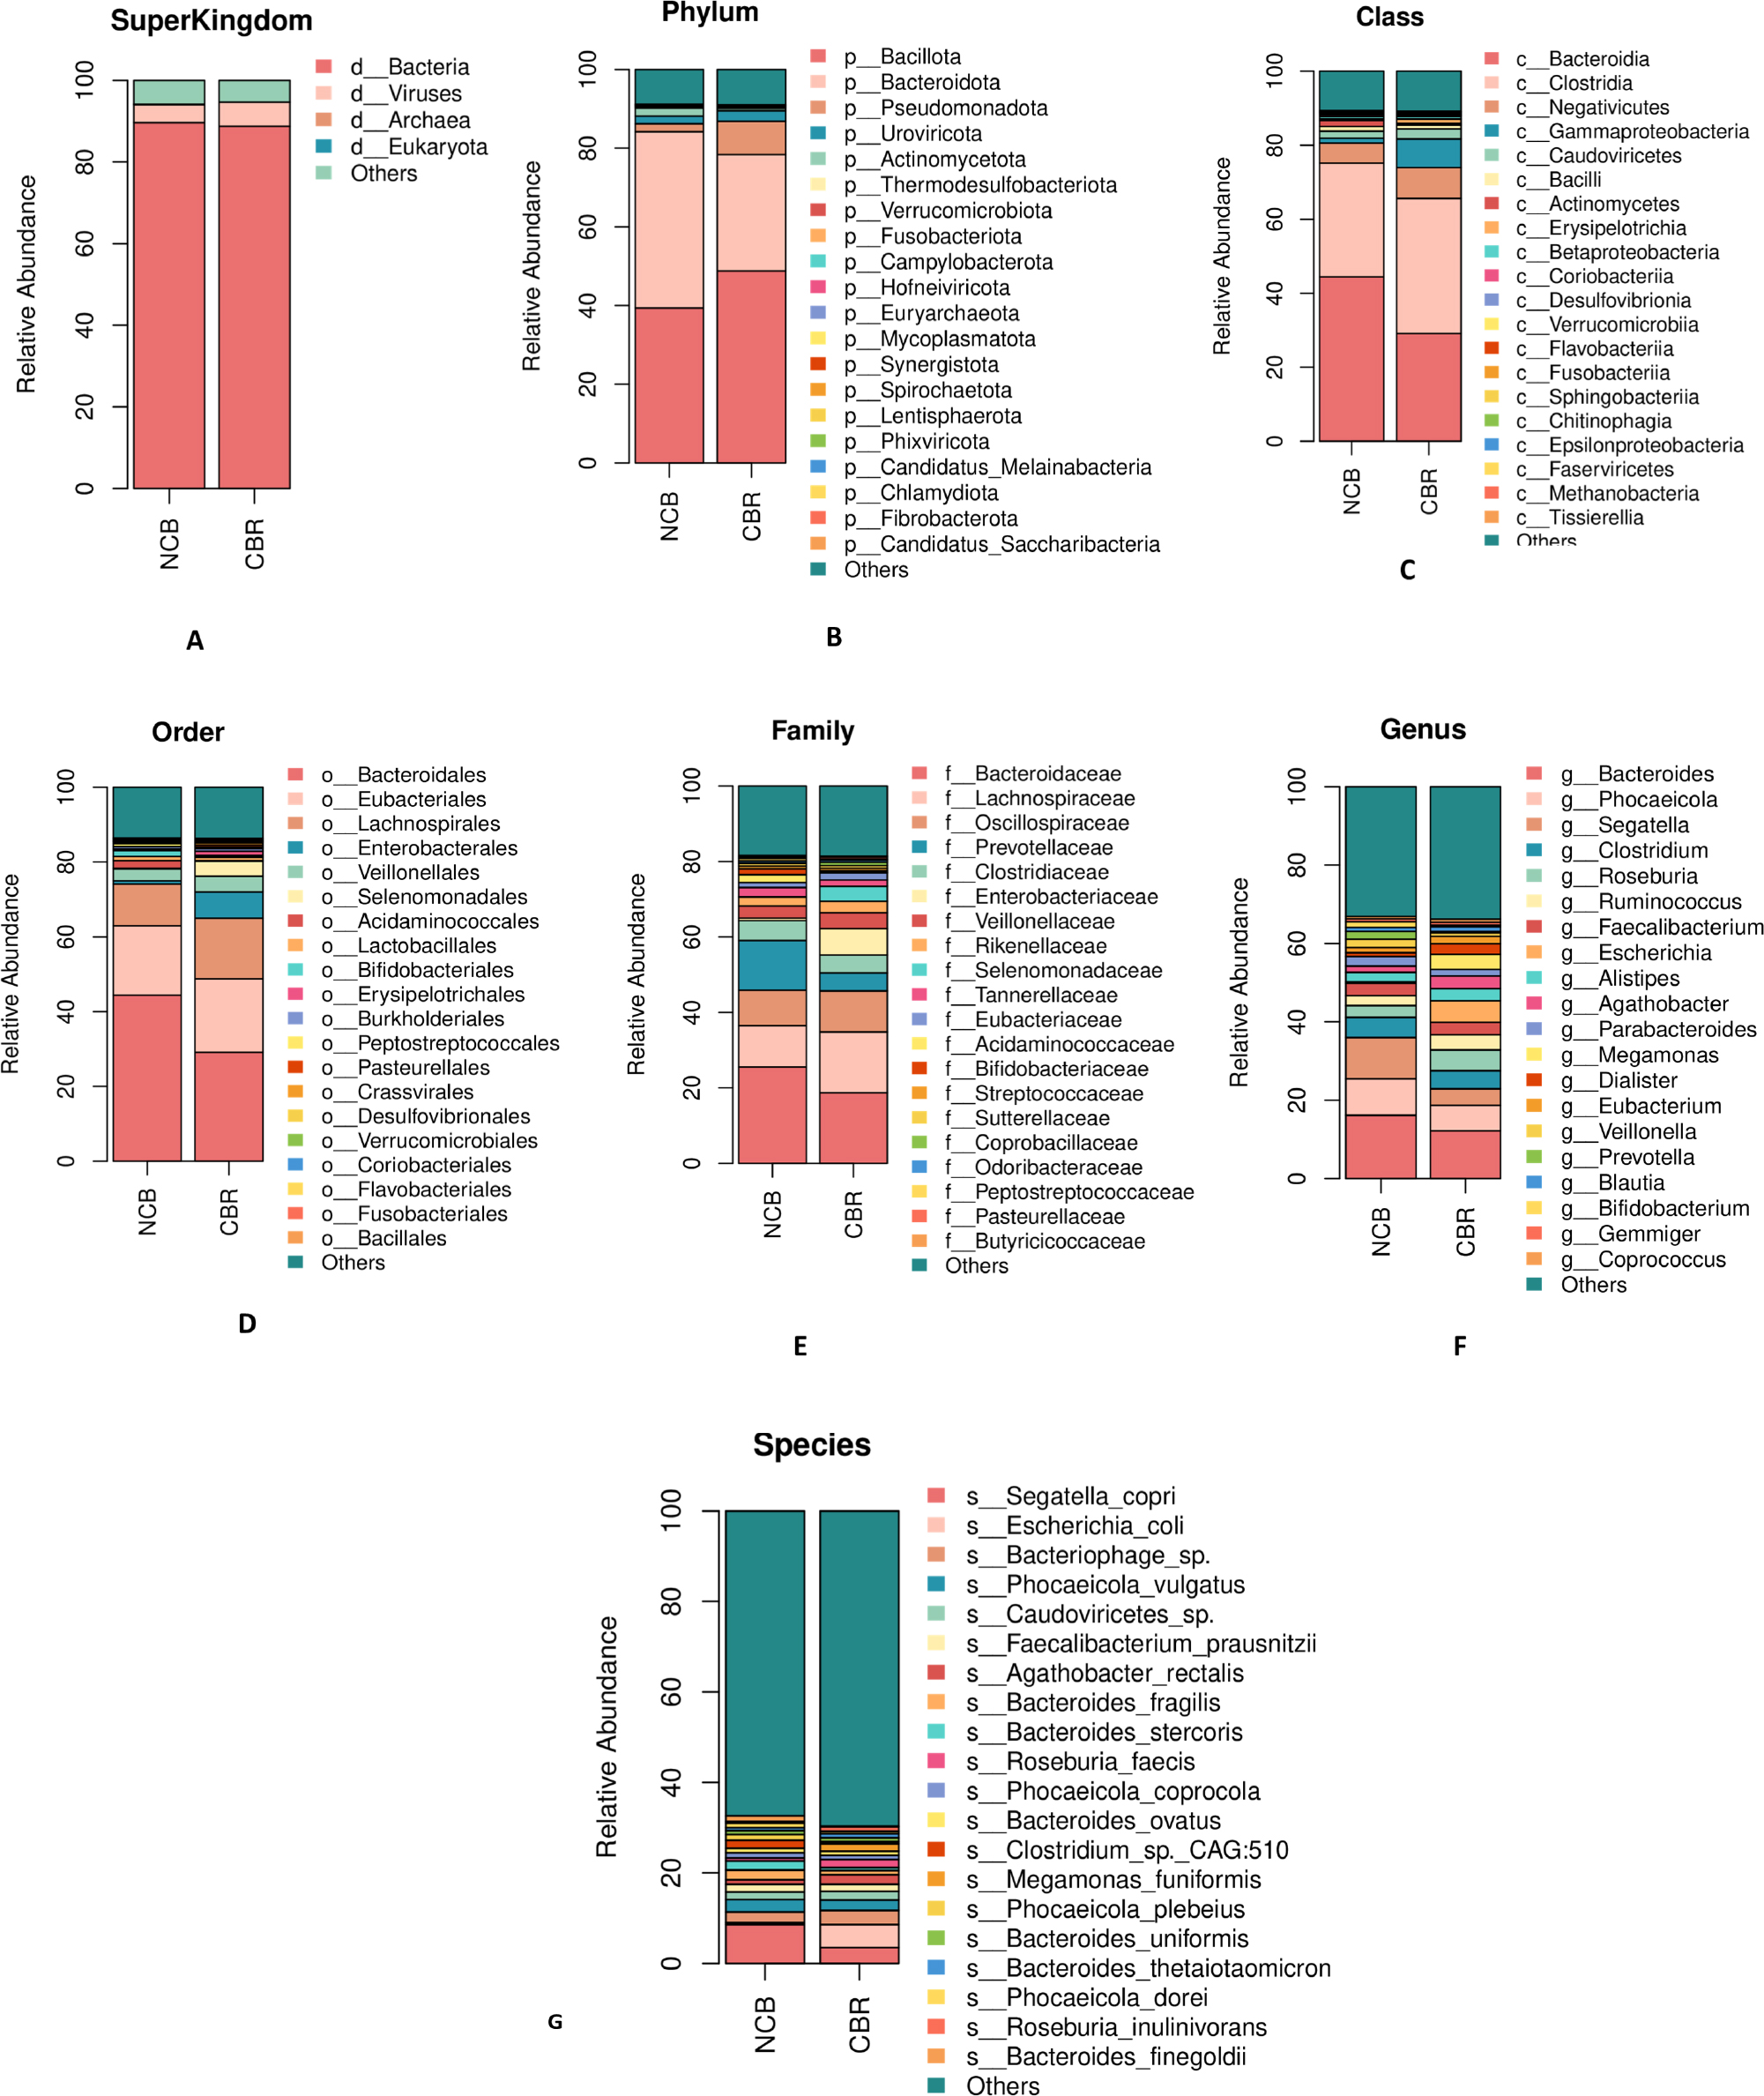
Fig. 1.
Relative abundance of gut microbiota at different taxonomic levels in the NCB and CBR groups. Stacked bar plots show the mean relative abundance of taxa in each group. This figure is intended to illustrate compositional patterns; statistical analyses of differential abundance are presented separately in subsequent sections. (A) Superkingdom level: Bacteria constituted the dominant domain in both groups. (B) Phylum level: Bacillota and Bacteroidota were the dominant phyla shared by both groups, with variations in their relative abundances between groups. (C) Class level: Bacteroidia showed higher relative abundance in the NCB group, whereas Clostridia showed higher relative abundance in the CBR group. (D) Order level, (E) Family level, and (F) Genus level: These levels further reflected the trend of Bacteroidota-related taxa being more enriched in the NCB group, and Lachnospiraceae, among others, being enriched in the CBR group. (G) Species level: Analysis precisely identified Segatella_copri and Escherichia_coli as characteristic species showing differential abundance patterns for the NCB and CBR groups, respectively. Together, these observations reveal compositional differences in gut microbiota structure between the groups, providing a microbiological basis for phenotype associations.
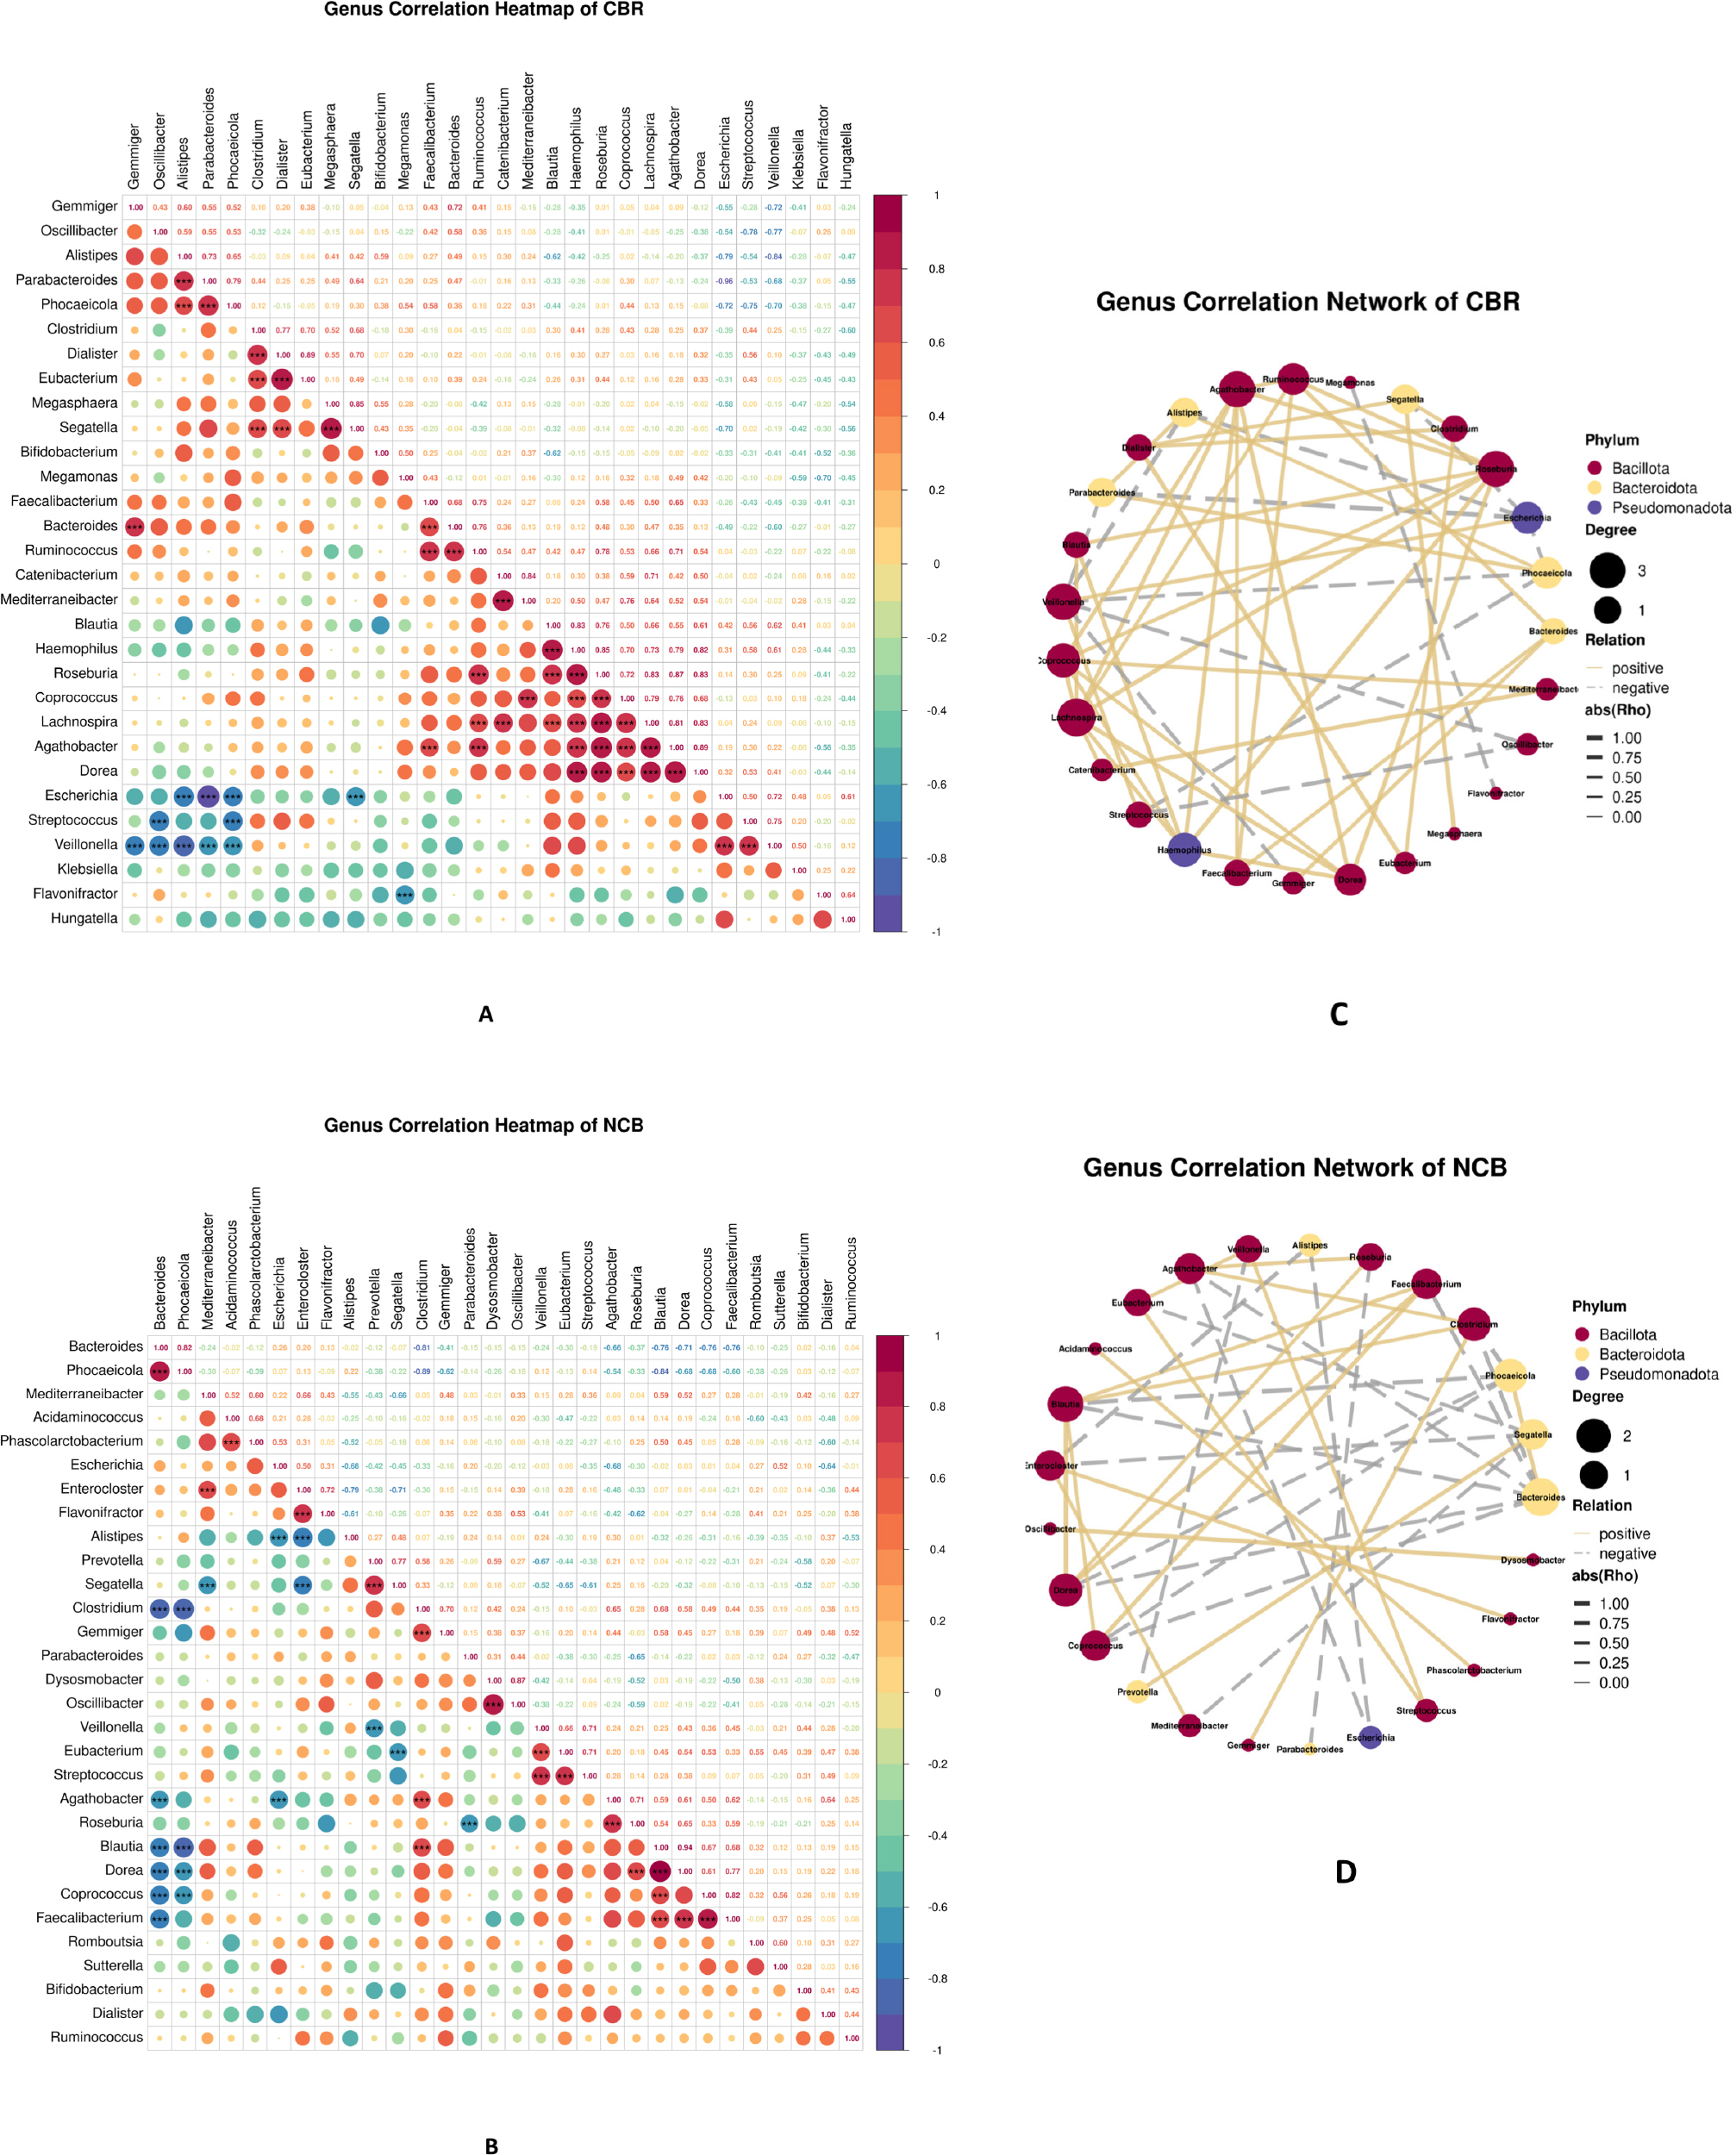
Fig. 2.
Intramicrobial Correlation Network Analysis: (A) and (B): Heatmaps displaying Spearman correlation coefficients among the top 30 most abundant genera in the CBR and NCB groups, respectively. Dot size and color intensity represent the strength and direction of correlations: larger and redder dots indicate stronger positive correlations, while larger and bluer dots indicate stronger negative correlations. Asterisks (*P < 0.05, **P < 0.01, ***P < 0.001) are marked within the heatmap cells to indicate statistical significance. (C) and (D): Correlation network diagrams for the CBR and NCB groups, respectively. Nodes represent bacterial genera, and edges represent strong correlations (|rho| > 0.8). Edge color indicates the type of correlation: red for positive and blue for negative associations.
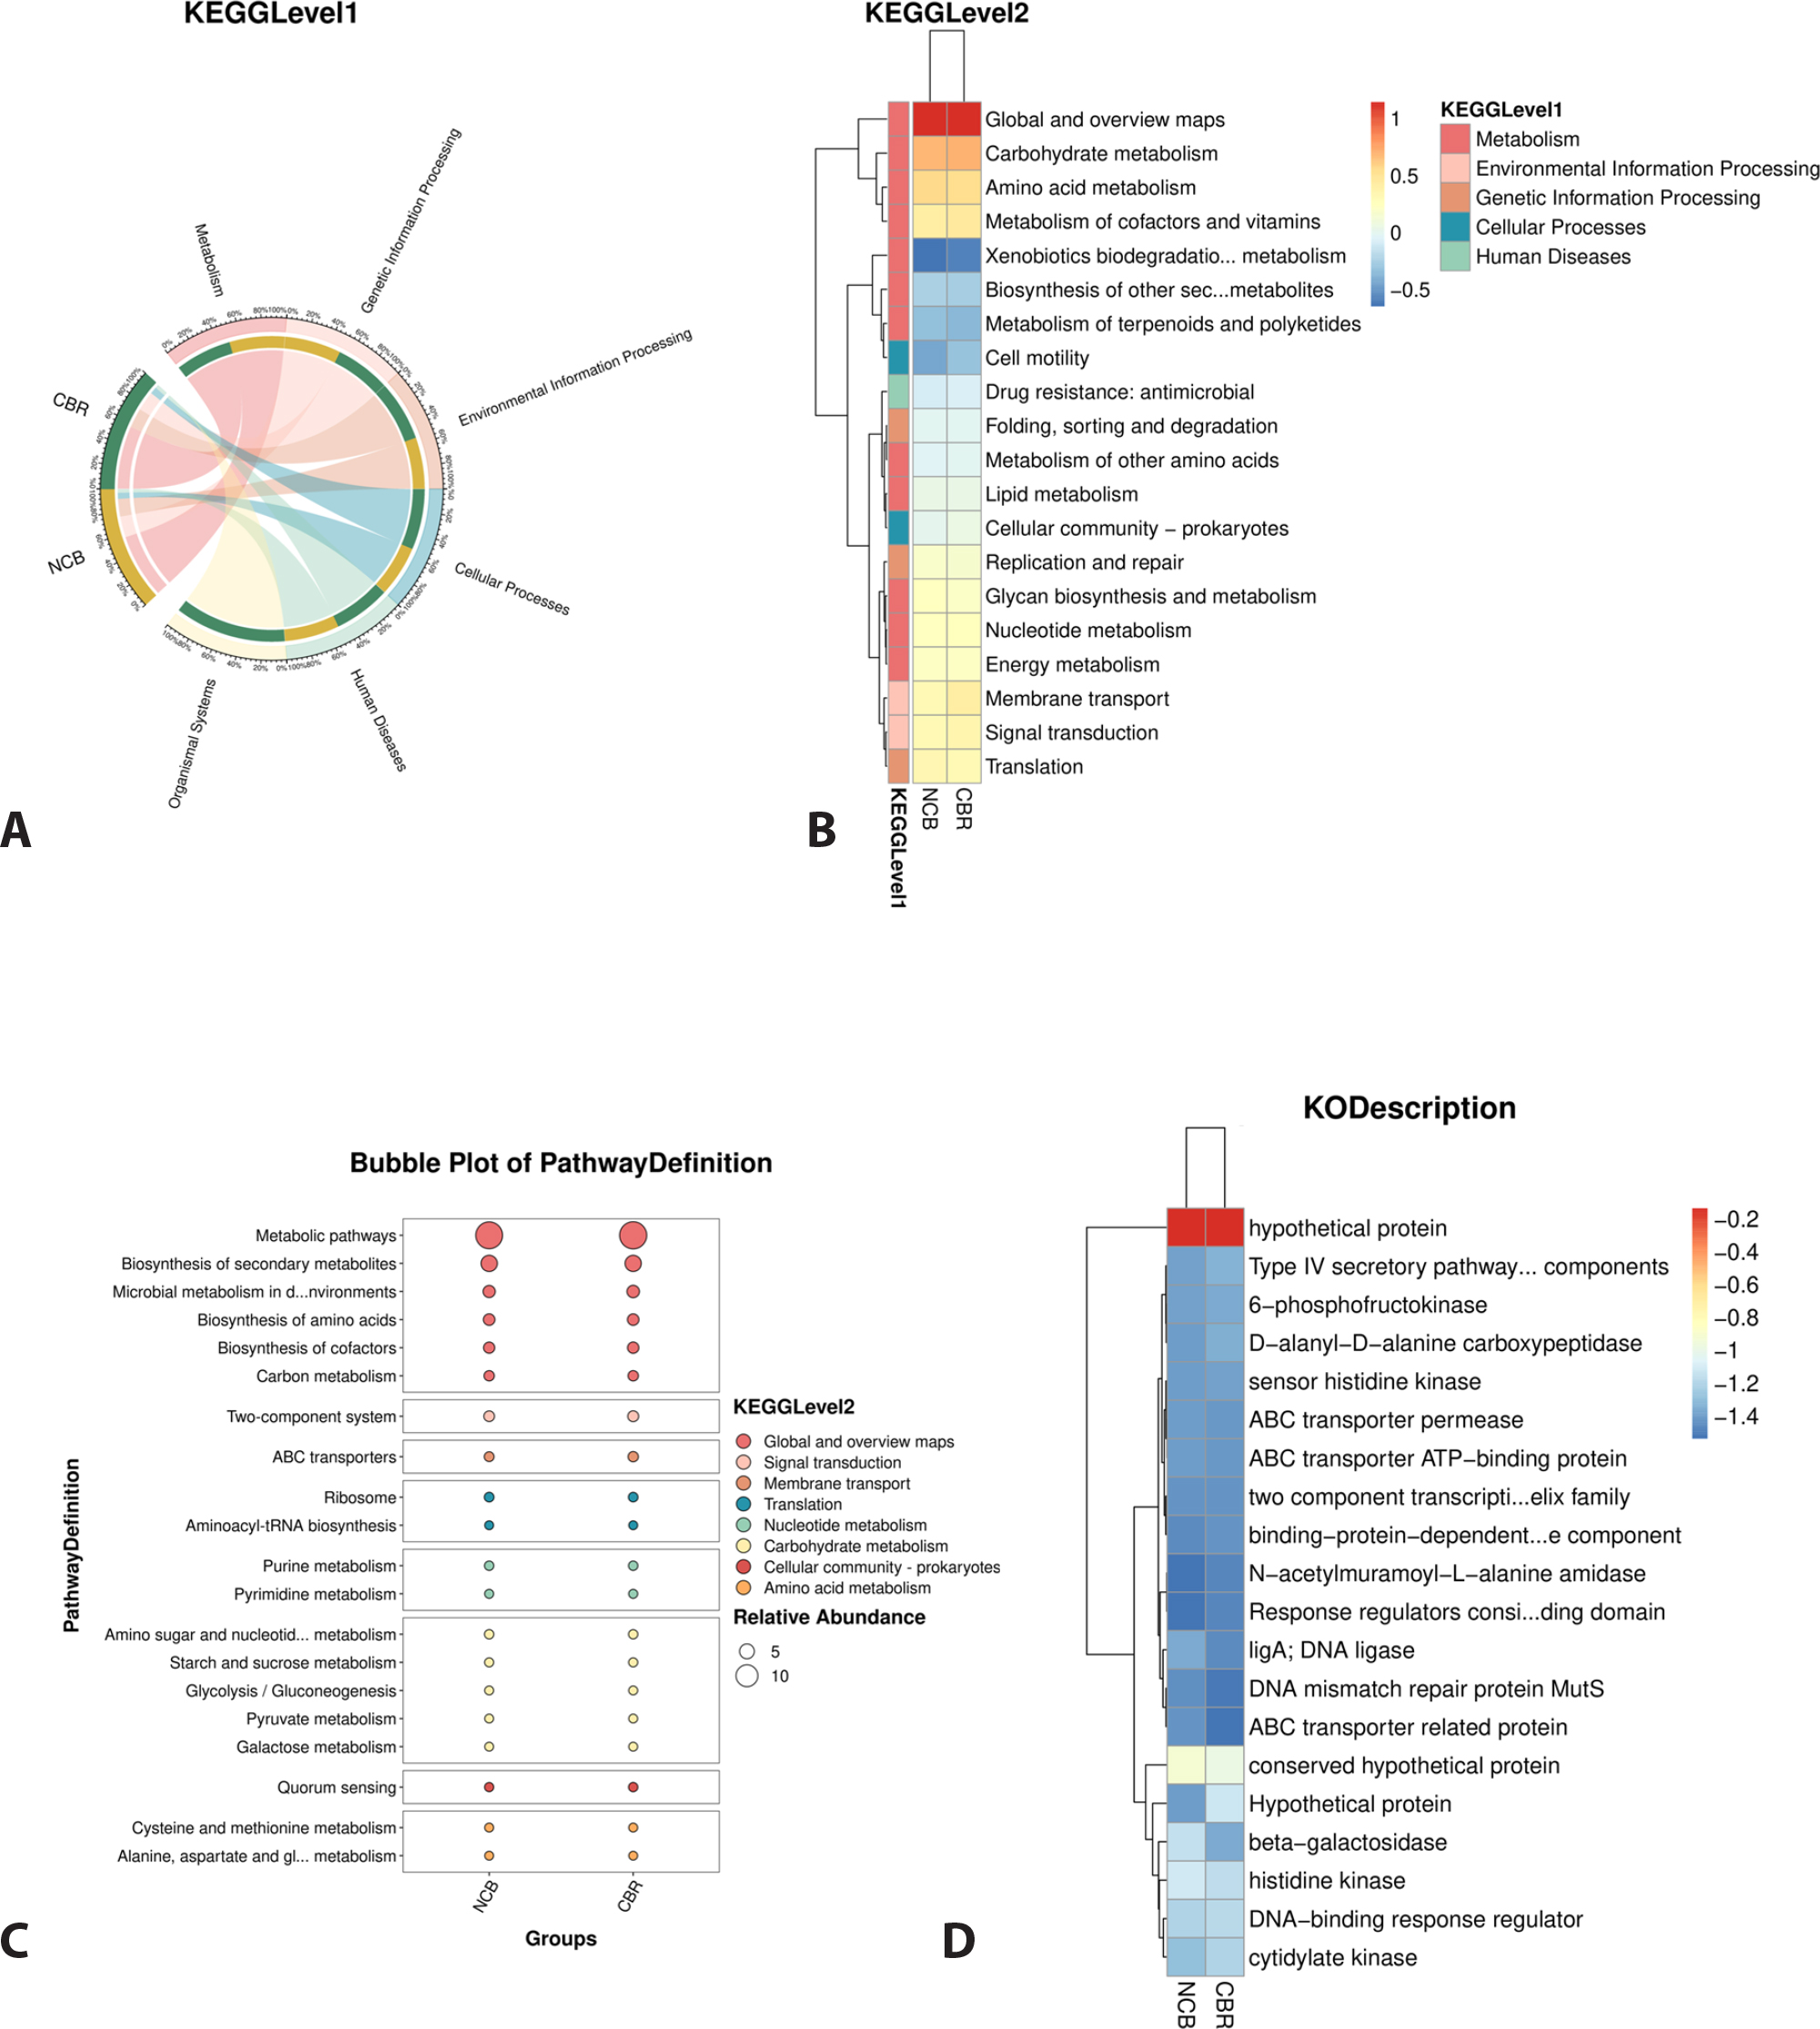
Fig. 3.
KEGG Database Functional Notes: (A) Level 1 functional distribution shows that Metabolism was the predominant category in both groups, with a slightly higher proportion in the CBR group. (B) Level 2 functional module analysis revealed group-specific enriched pathways: the CBR group was enriched in pathways such as Carbohydrate metabolism and Metabolism of cofactors and vitamins, whereas the NCB group showed higher activity in pathways like Amino acid metabolism. (C) Comparison of specific metabolic pathways further confirmed that the CBR group was more active in pathways including Biosynthesis of secondary metabolites and the Two-component system. (D) Pathway Definition level analysis precisely identified key differential genes between groups; for instance, the CBR group was enriched in Type IV secretory pathway components, and the NCB group was enriched in ligA. These results indicate that the gut microbiota in the CBR group possesses a greater potential for active substance transport and energy metabolism.
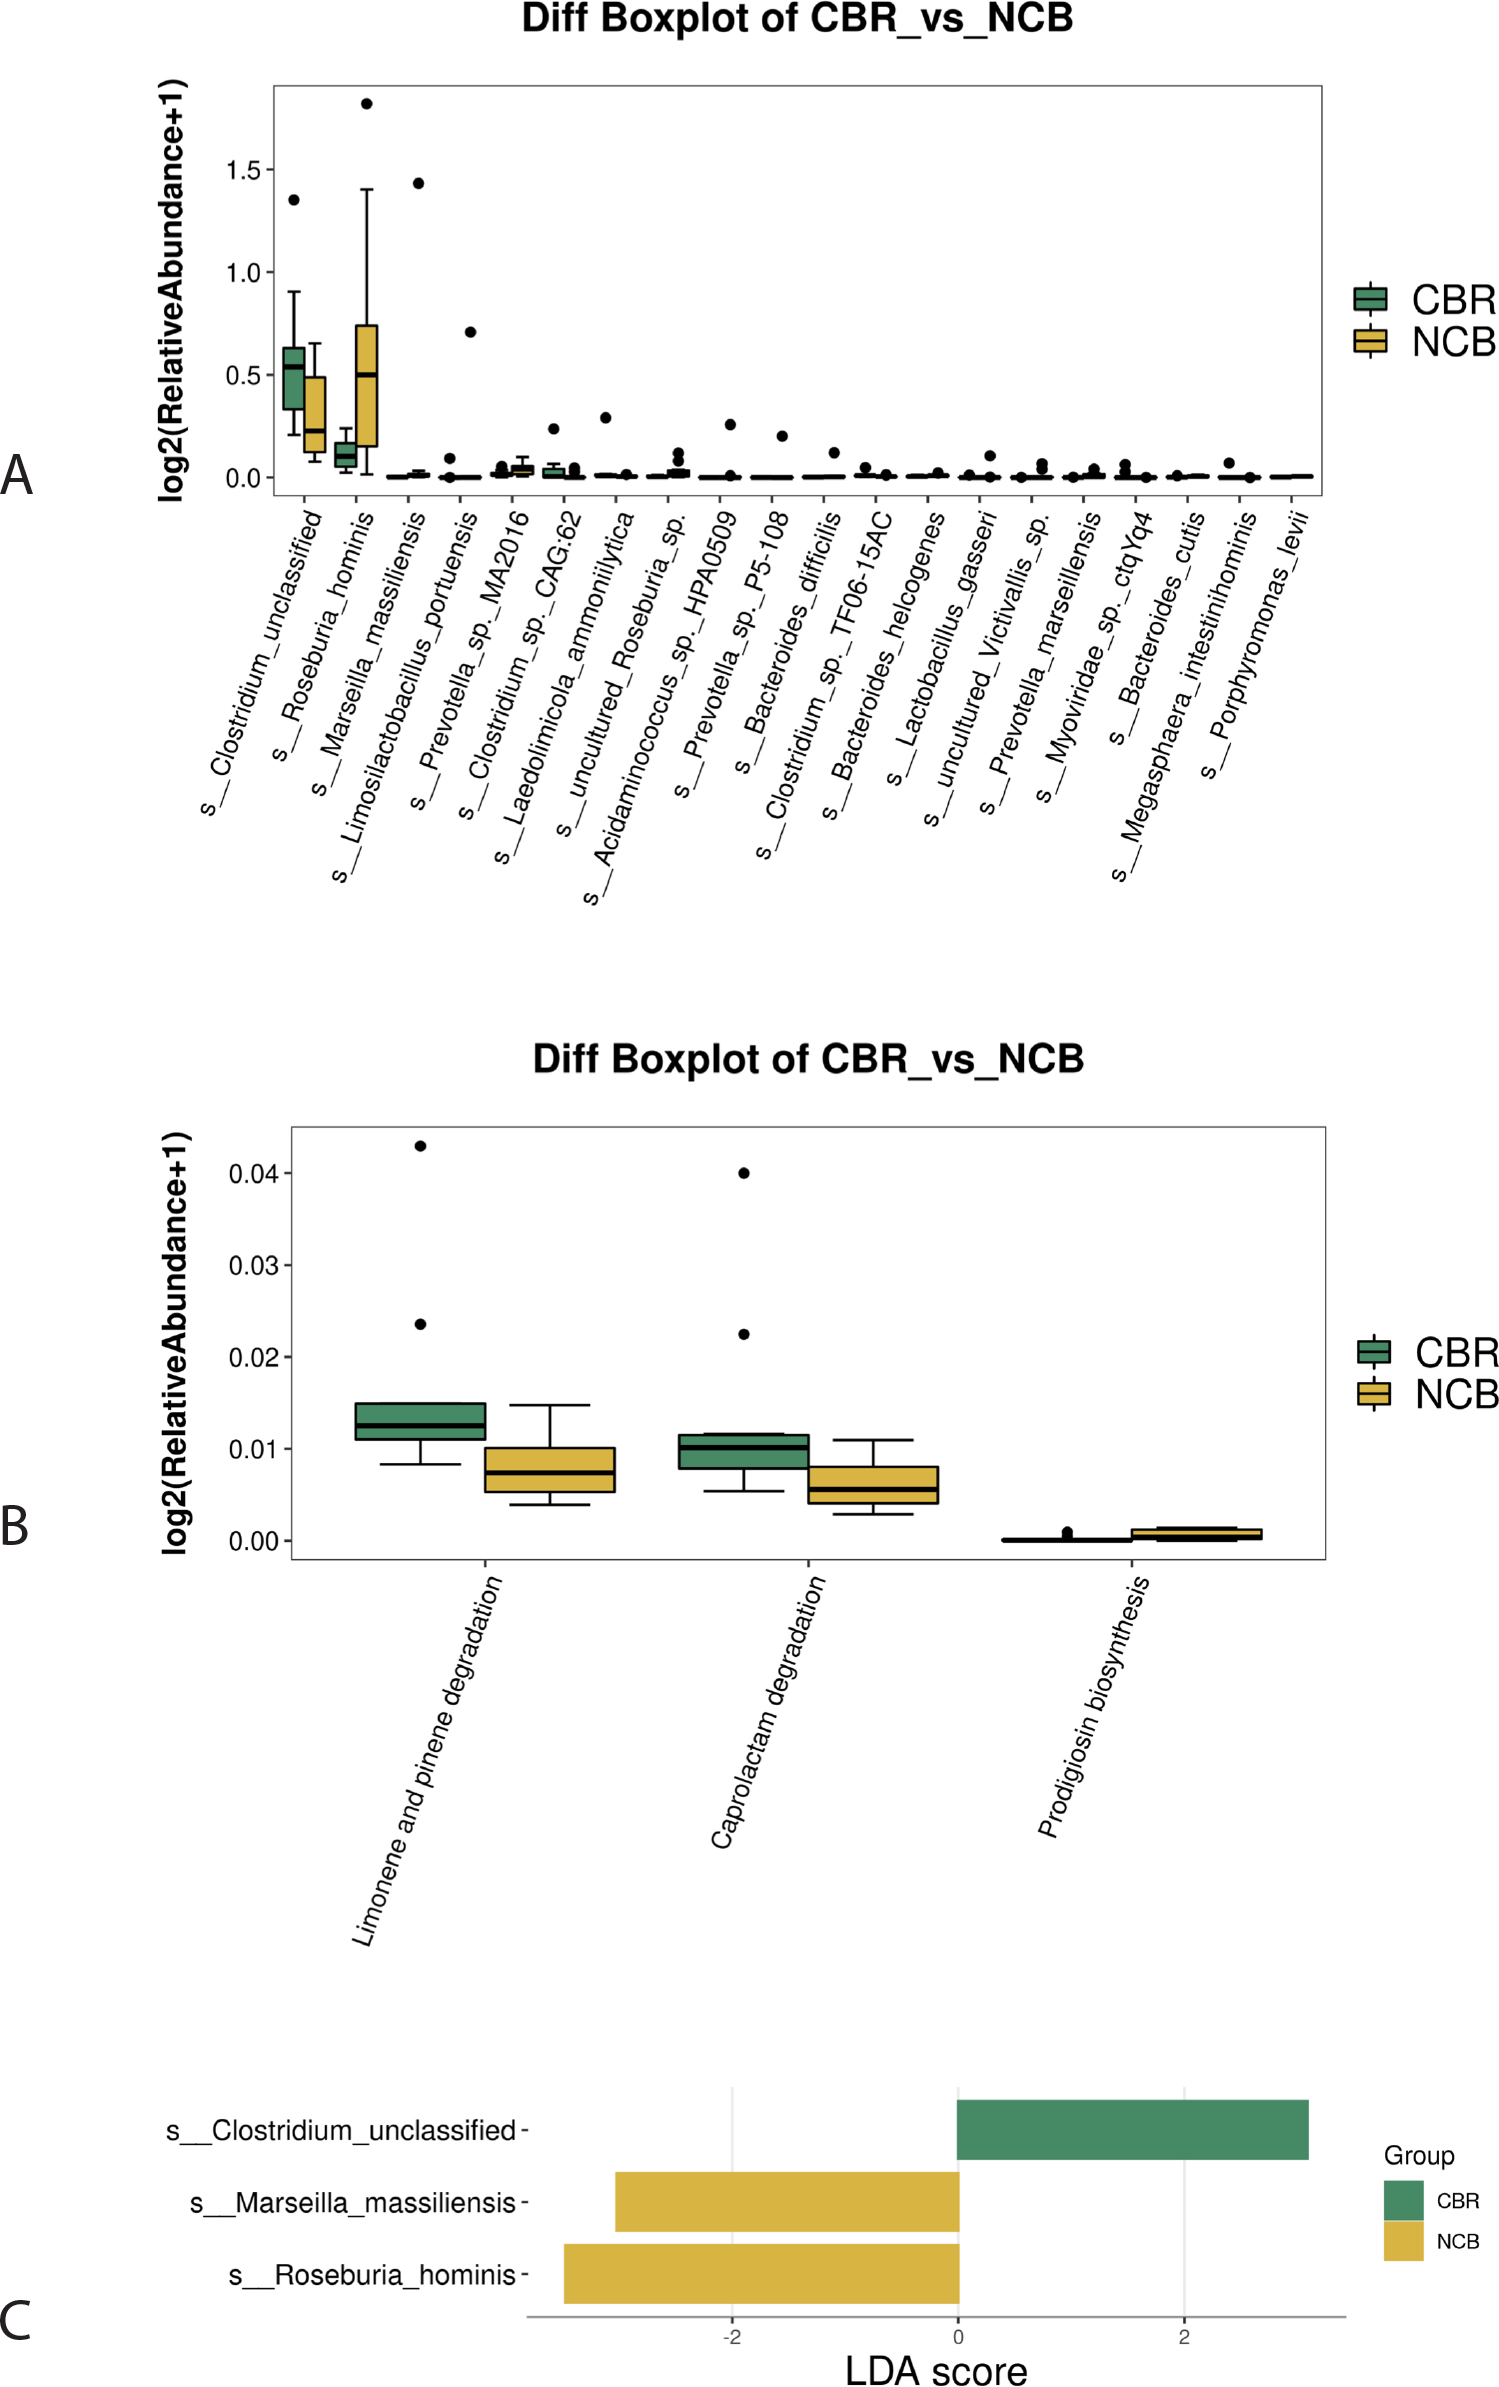
Fig. 4.
Differential Analysis of Species and Functional Entries: (A) Species difference boxplot based on the Mann-Whitney U test (|log2FC| > 1, p < 0.05), displaying the top 20 most abundant significant differential species. The results show that s_Clostridium_unclassified was significantly enriched in the CBR group, whereas s_Roseburia_hominis was more predominant in the NCB group. (B) KEGG PathwayDefinition functional difference boxplot shows that the CBR group was significantly enriched in Limonene and pinene degradation and Caprolactam degradation, while the NCB group had a higher abundance of Prodigiosin biosynthesis. (C) LEfSe analysis (LDA Score > 3, P < 0.05) identified differential taxa with discriminative power between groups, further validating s_Clostridium_unclassified as a biomarker for the CBR group, and s_Marseilla_massiliensis and s_Roseburia_hominis as marker species for the NCB group.
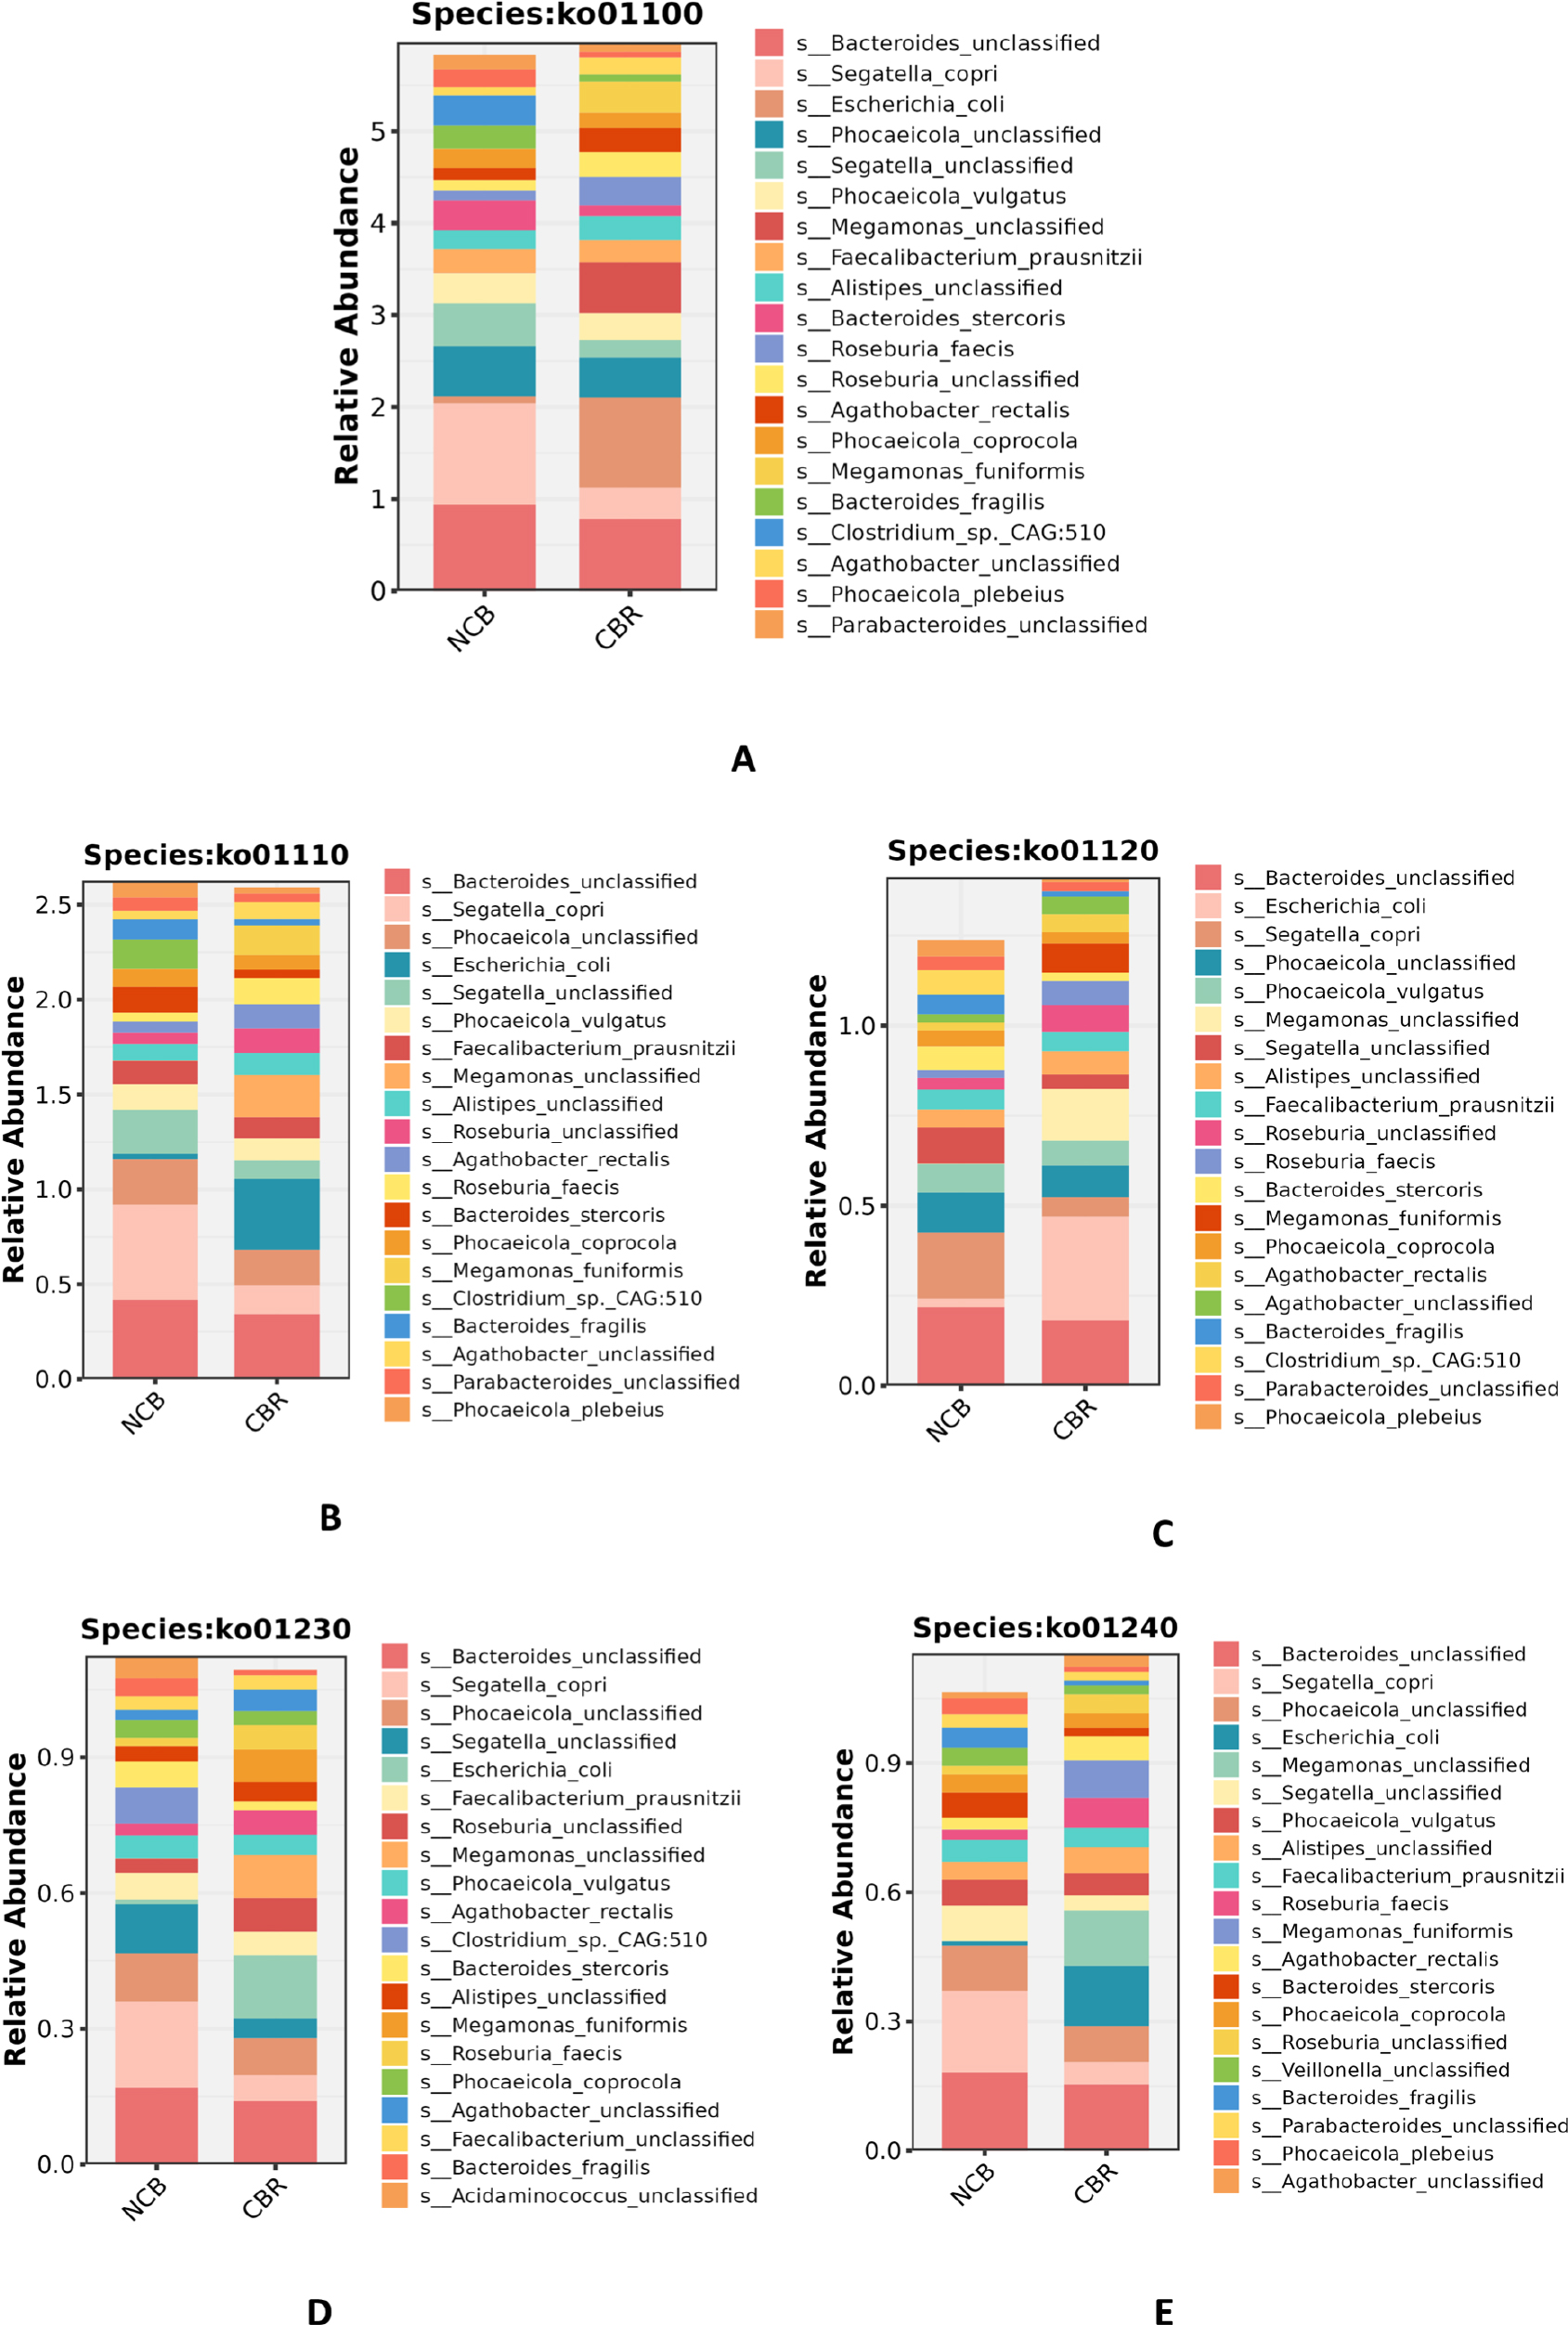
Fig. 5.
Analysis of Species and Functional Contribution: Panels A to E illustrate the relative contributions of species to the top five most abundant KEGG pathways: ko01100 (Metabolic pathways), ko01110 (Biosynthesis of secondary metabolites), ko01120 (Microbial metabolism in diverse environments), ko01230 (Biosynthesis of amino acids), and ko01240 (Biosynthesis of cofactors), respectively. The analysis reveals that s_Bacteroides_unclassified was the dominant contributing species shared by both groups. However, significant intergroup differences were observed: the contribution of s_Bacteroides_unclassified and s_Segatella_copri was higher in the NCB group, whereas s_Escherichia_coli and s_Megamonas_unclassified were enriched in the CBR group.
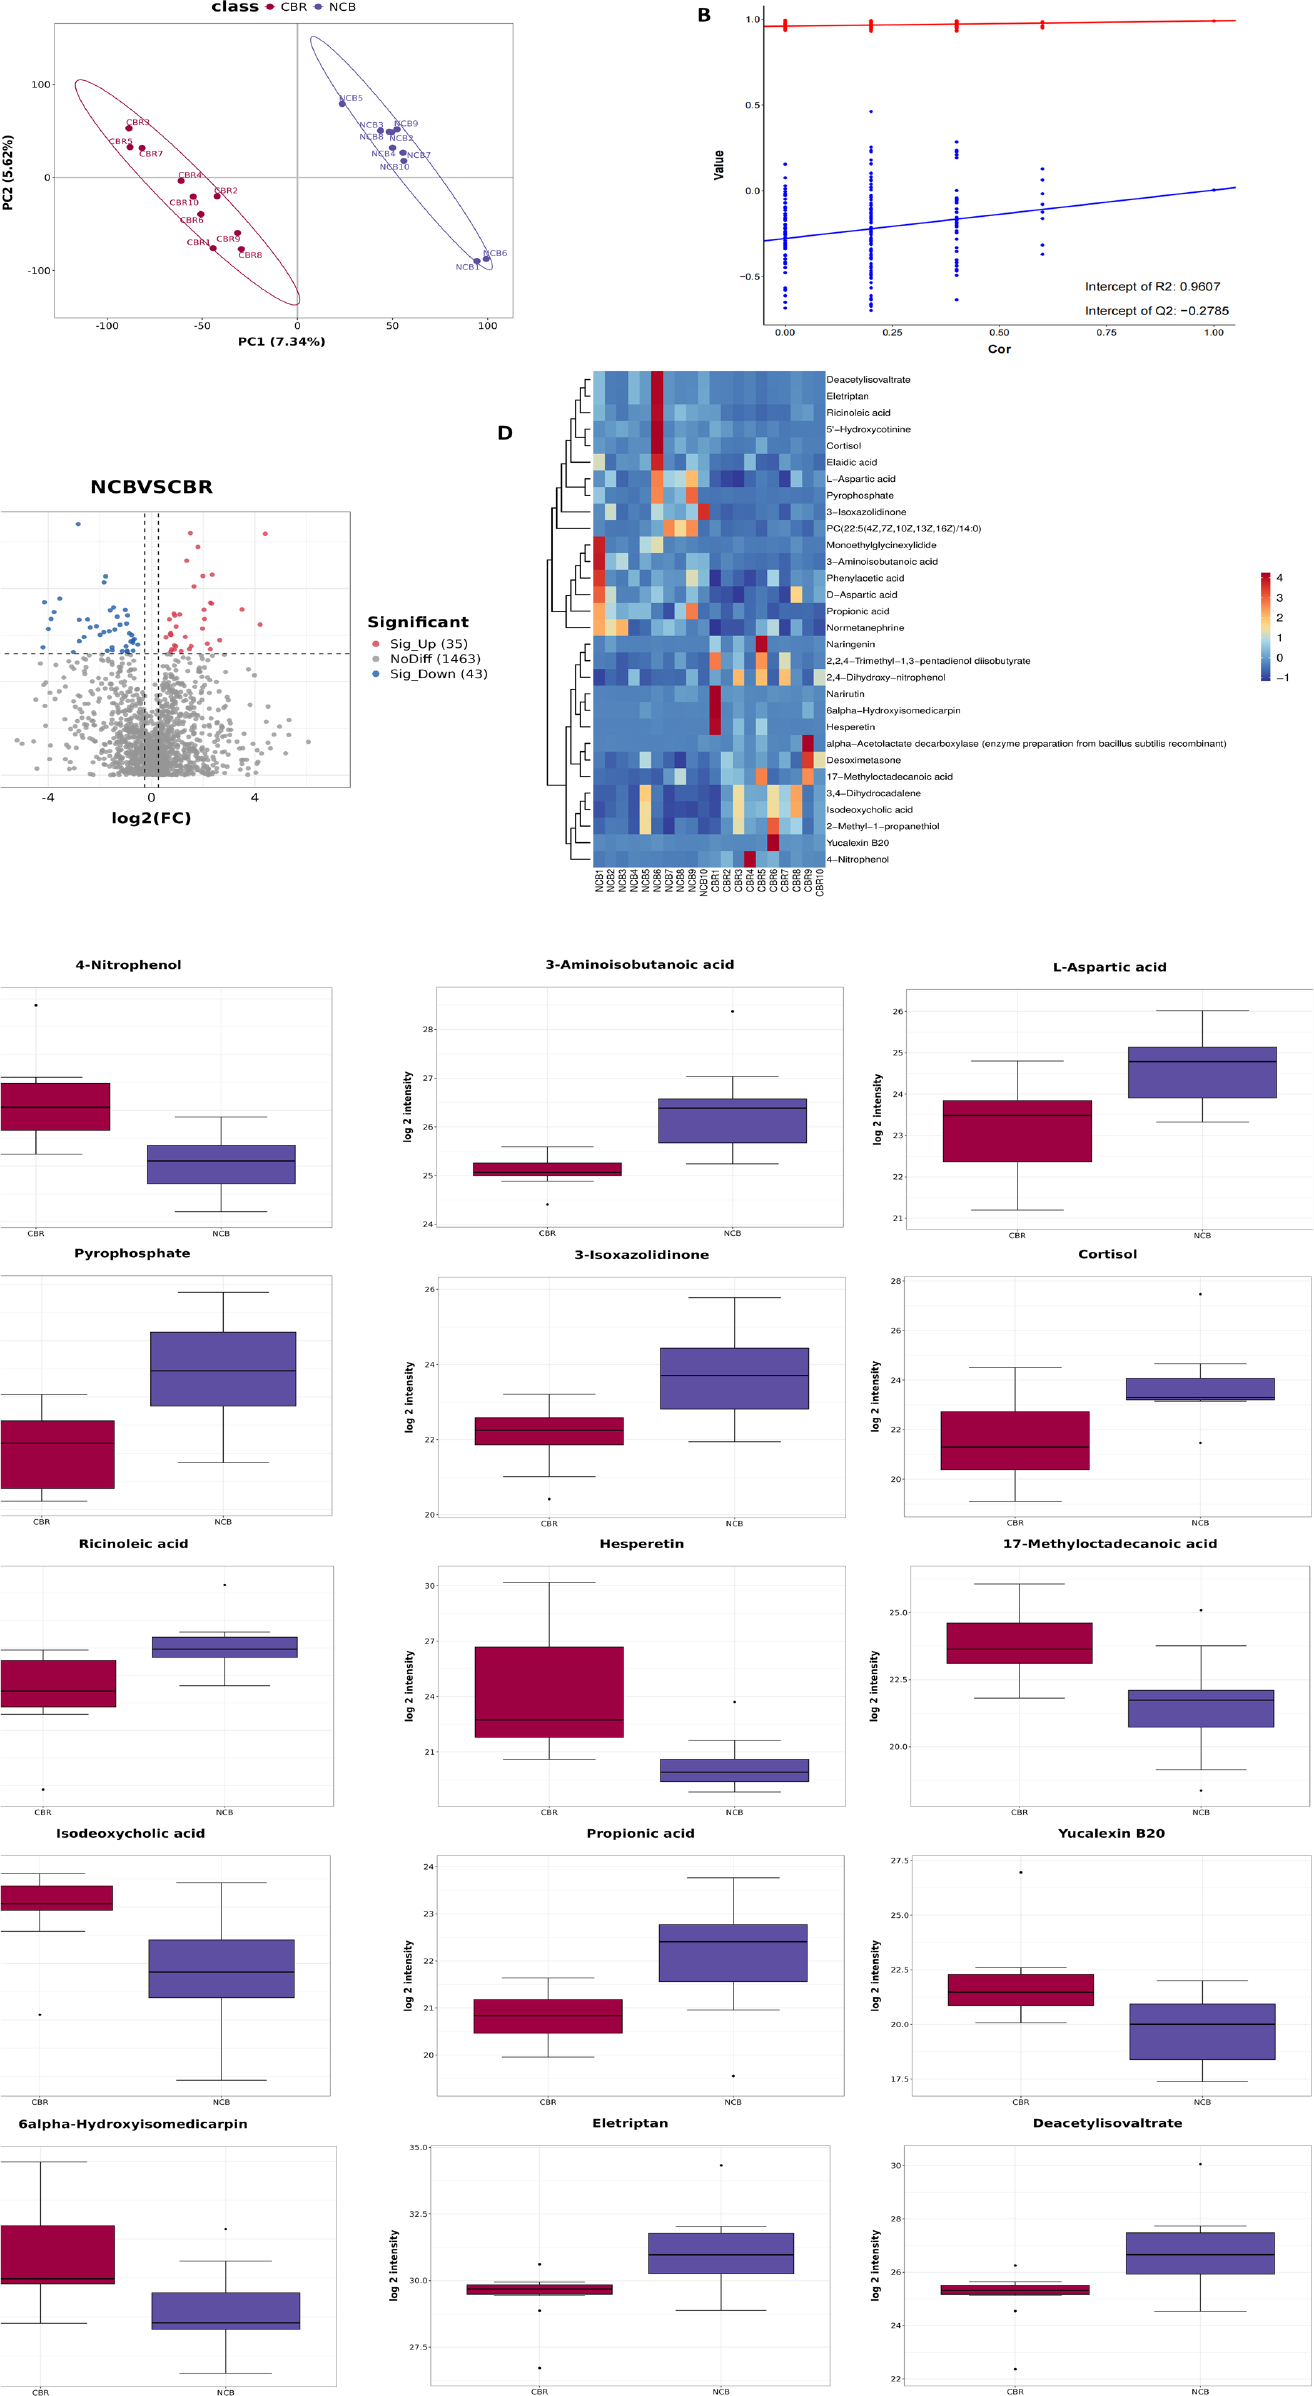
Fig. 6.
Screening and Identification of Differential Metabolites: (A) PLS-DA score plot demonstrates distinct separation between CBR and NCB groups along the first two principal components, reflecting significant intergroup metabolic differences. (B) Permutation test (200 iterations) confirmed model robustness, with original Q2 and R2 values significantly higher than permuted results, indicating no overfitting. (C) Volcano plot visualizes differential metabolites using log2(fold change) and -log10(P-value), highlighting 78 significant metabolites (35 upregulated, 43 downregulated) meeting thresholds of |log2FC| ≥ 0.26, P < 0.05, and VIP ≥ 1. (D) Heatmap displays the top 30 most significant metabolites (lowest P-values), showing clear group-specific clustering. (E) Boxplots illustrate the top 15 most significantly altered metabolites (P ≤ 0.01), with 4-Nitrophenol, Hesperetin, 17-Methyloctadecanoic acid, Isodeoxycholic acid, Yucalexin B20, and 6alpha-Hydroxyisomedicarpin significantly elevated in the CBR group, while 3-Aminoisobutanoic acid, L-Aspartic acid, Pyrophosphate, 3-Isoxazolidinone, Cortisol, Ricinoleic acid, Propionic acid, Eletriptan, and Deacetylisovaltrate were more abundant in the NCB group.
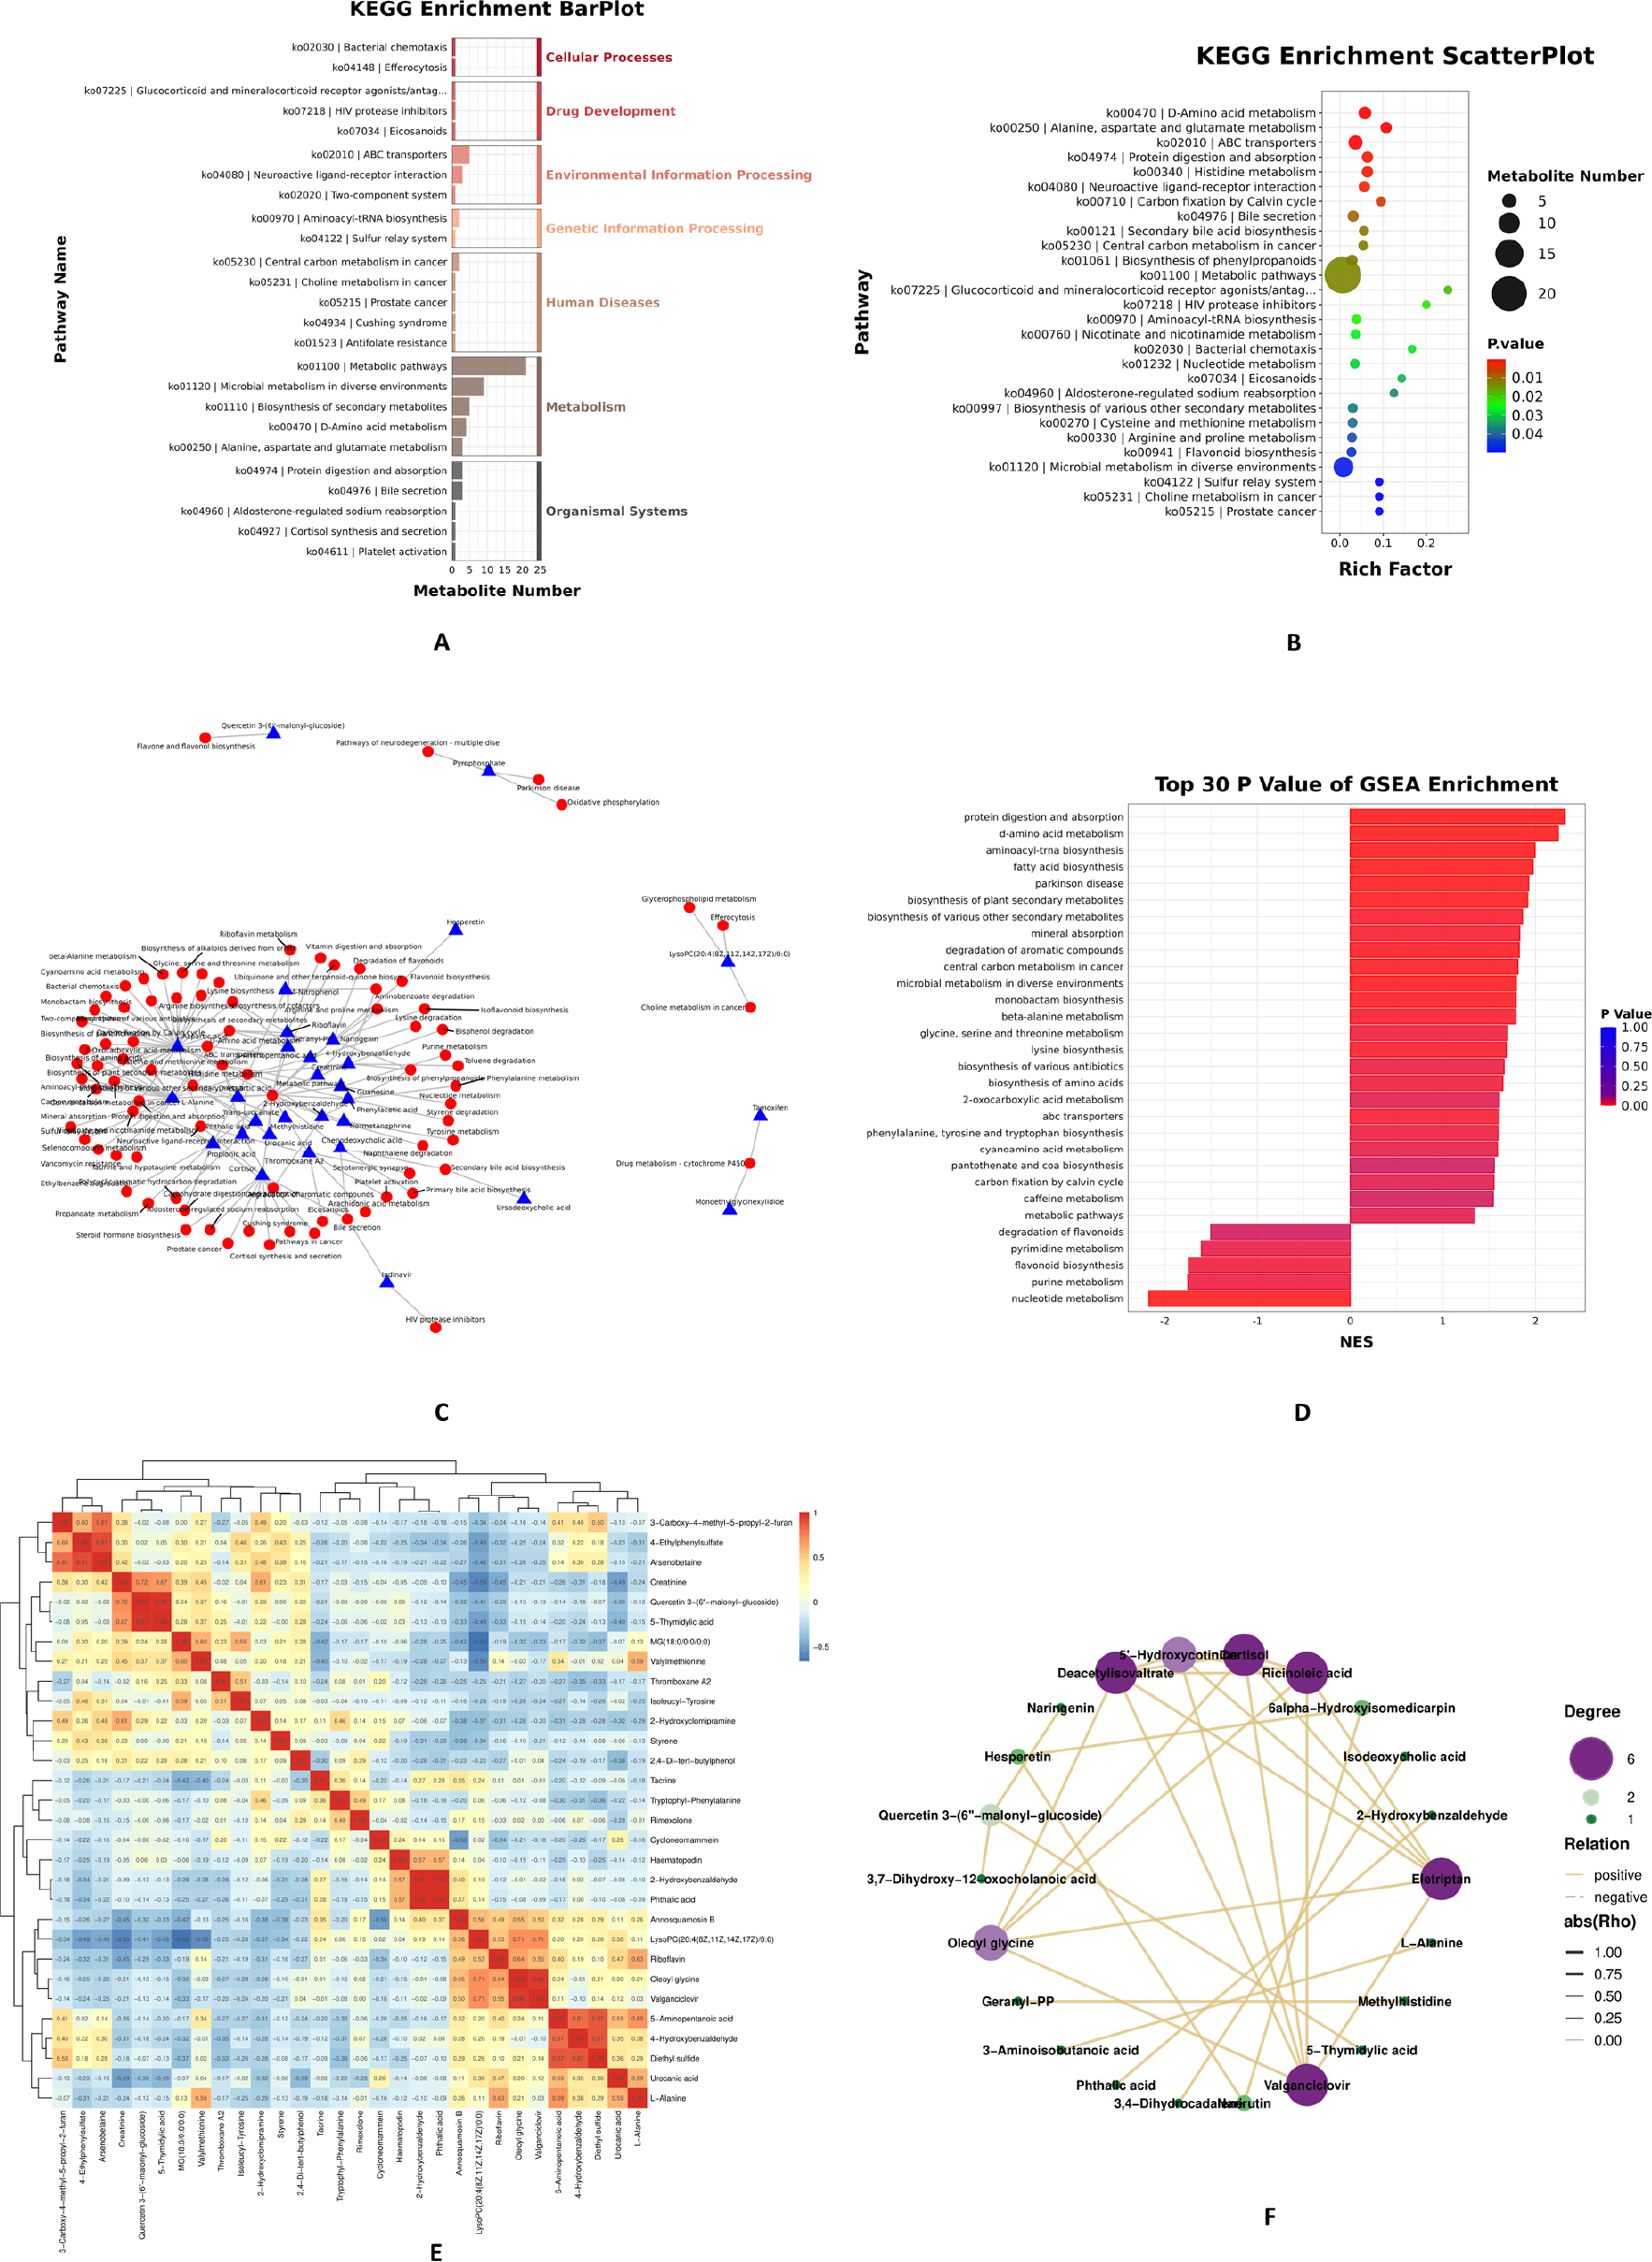
Fig. 7.
KEGG Enrichment and Correlation Analysis of Metabolites: (A) Hierarchical bar chart showing KEGG pathway enrichment, with horizontal axis indicating the number of differential metabolites per pathway, vertical axis listing pathway names, and color representing KEGG Level 1 classification. (B) Bubble plot of the top 28 enriched pathways (P ≤ 0.05), with Rich Factor (differential metabolites/total metabolites in pathway) on the horizontal axis, pathway names on the vertical axis, point size showing metabolite count, and color indicating enrichment P-value. (C) Regulatory network between metabolites (triangles, top 30 by P-value) and pathways (circles), where connectivity reflects functional importance. (D) Enrichment bar chart displaying pathway names versus Normalized Enrichment Score (NES), with bar color ranging from blue (P=1.0) to red (P=0.0) to show significance. (E) Correlation heatmap with red indicating positive and blue negative metabolite relationships. (F) Correlation network diagram where nodes represent metabolites and edges (|rho| > 0.7) reflect associations, with highly connected nodes indicating functional importance in metabolic flux and phenotypic differences.
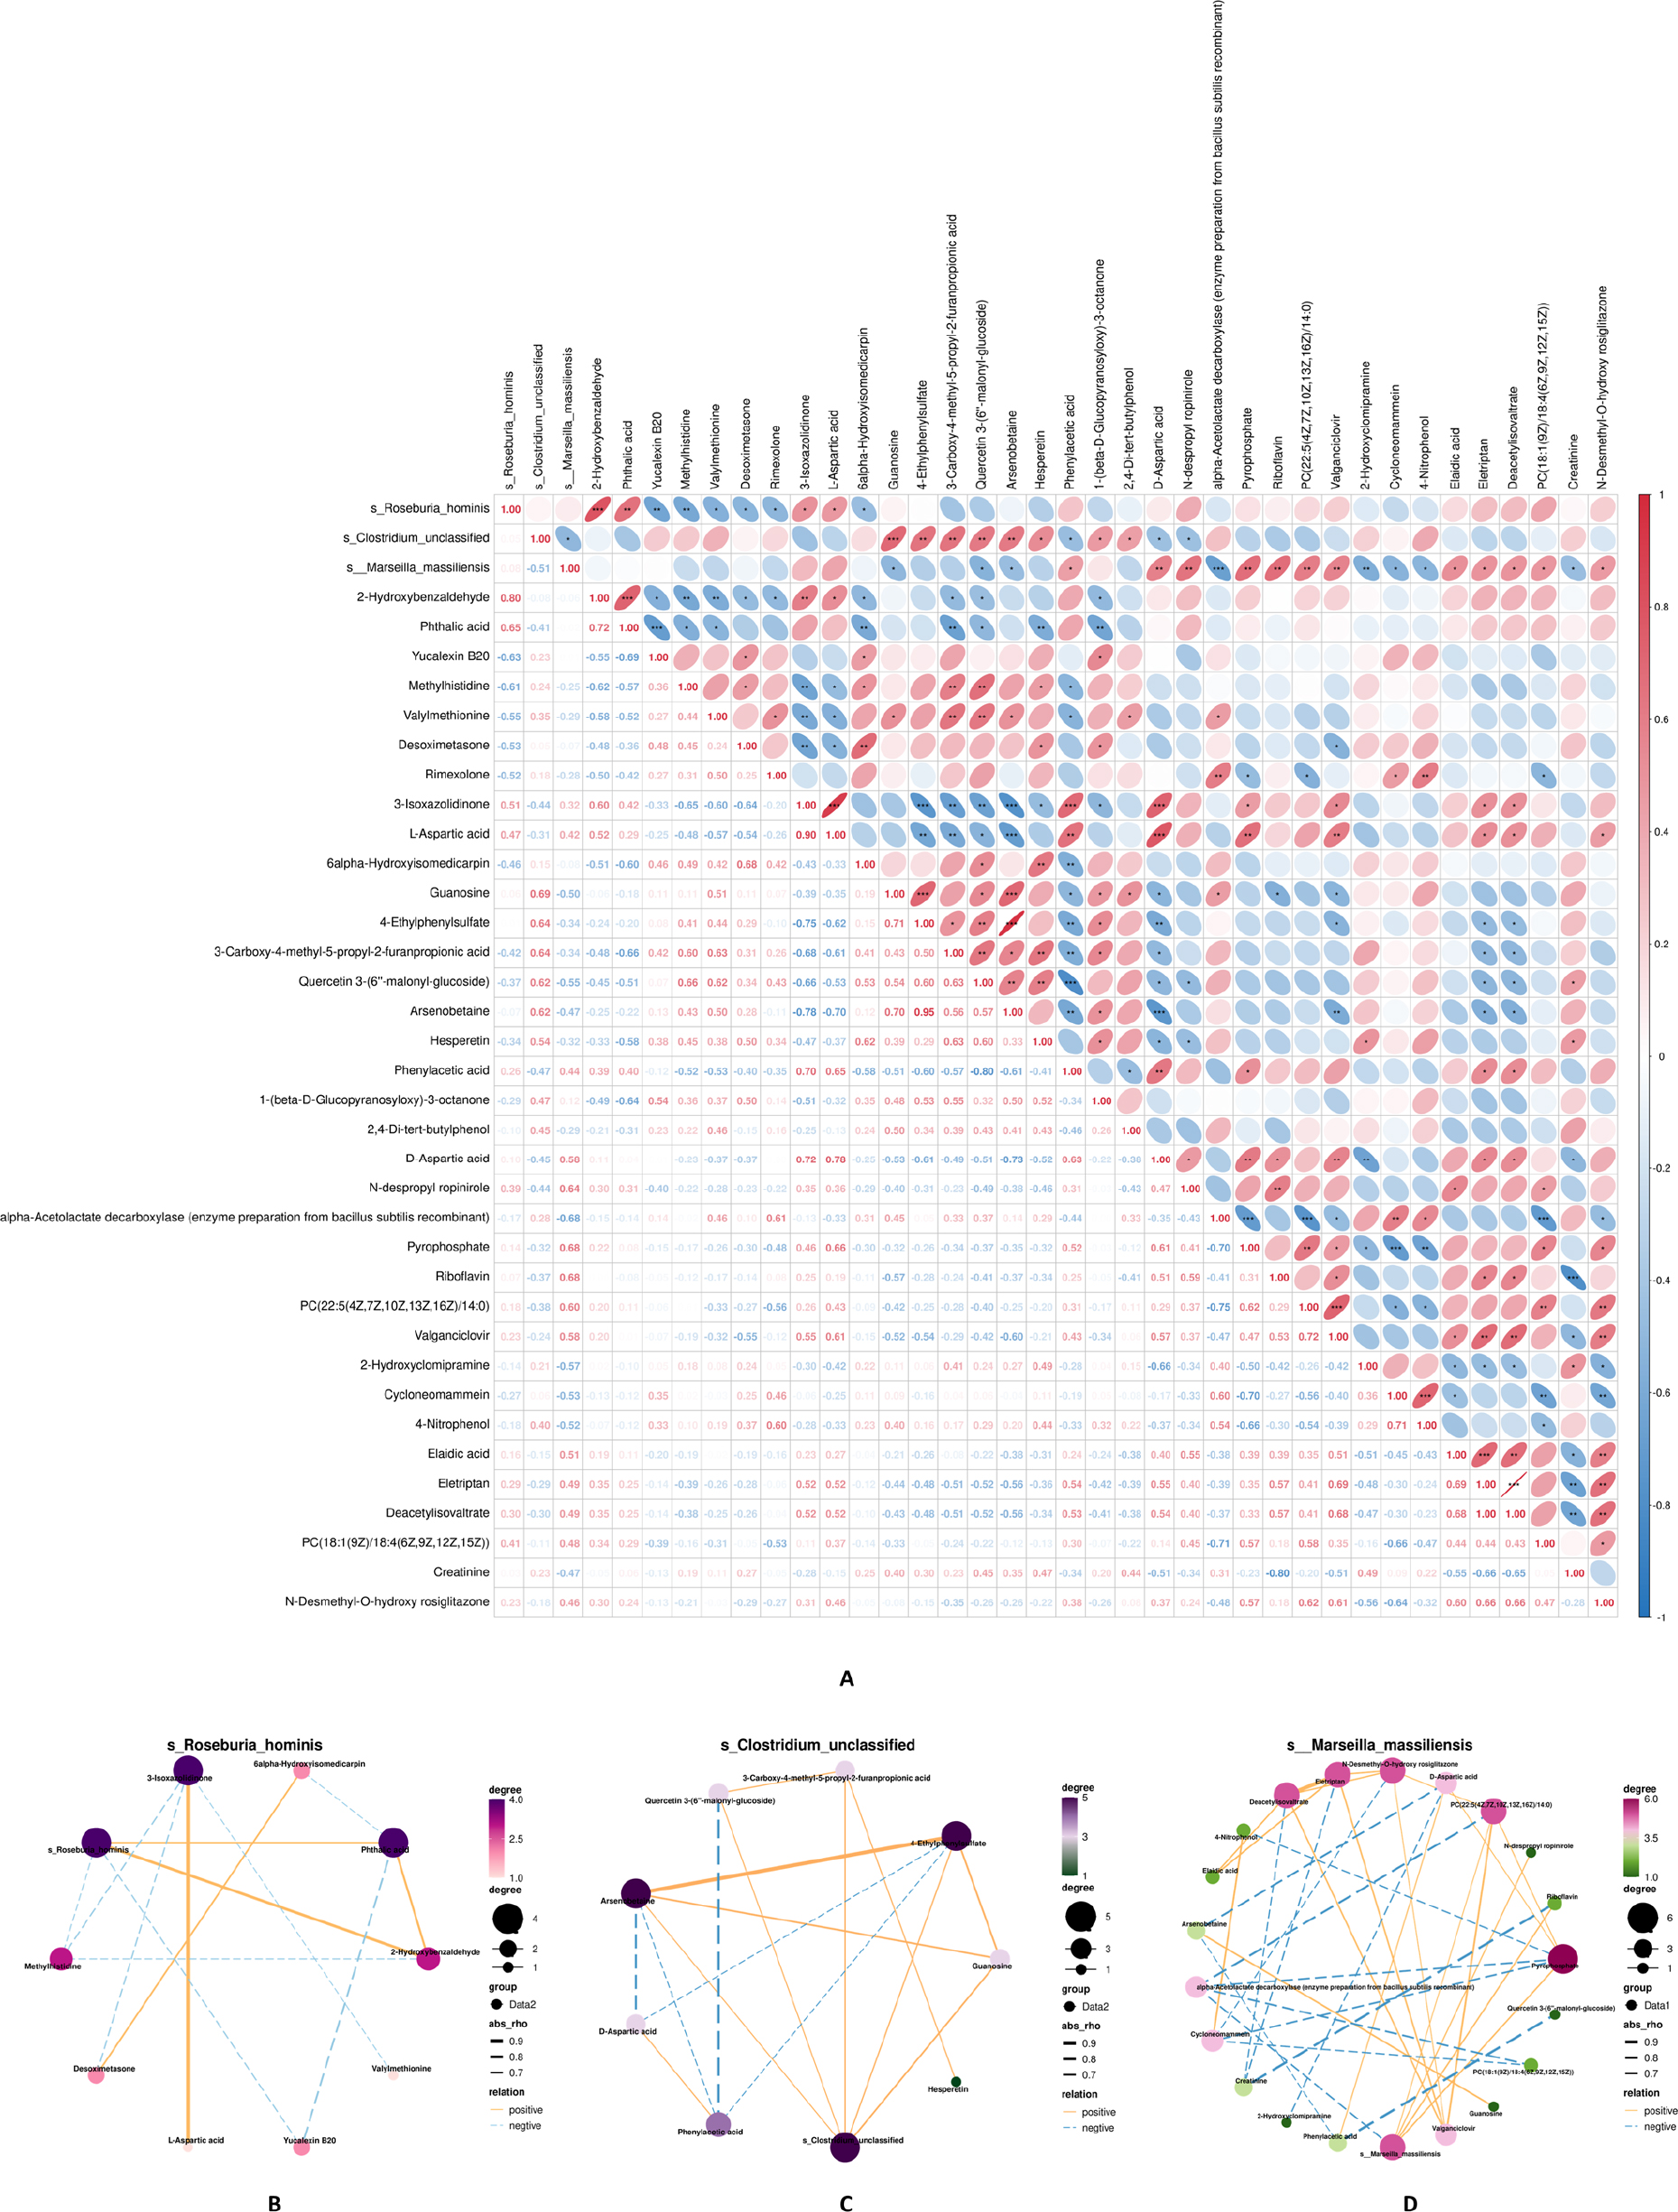
Fig. 8.
Correlation Analysis Between Differential Microbes and Metabolites: (A) Heatmap of Spearman correlation between differential metabolites and microorganisms. Color gradient (red to white to blue) corresponds to correlation coefficients (1 to -1), with warm and cool colors indicating positive and negative correlations, respectively. Numerical labels show exact correlation values, and asterisks denote significance levels: *P < 0.05, **P < 0.01, ***P < 0.001. (B), (C), (D) Network diagrams illustrating correlations between the dif-ferential microorganisms s_Roseburia_hominis, s_Clostridium_unclassified, and s_Marseilla_massiliensis, respectively, and differential metabolites meeting |r| ≥ 0.60 and P < 0.05. Line style and color represent positive (solid/red) or negative (dashed/blue) correlations, line thickness indicates correlation strength, and node size/color intensity reflects the number of correlated entities. The key correlation patterns remained consistent after FDR correction (adjusted P < 0.10), supporting the robustness of these microbe-metabolite associations.