
Tabel I
Chemical analysis of Red Sea water sample.
| Parameter | Value | Unit |
|---|---|---|
| Salt-related ions | ||
| Ca2+ | 496.0 | mg/l |
| Mg2+ | 1,512.0 | |
| Na+ | 11,920.0 | |
| K+ | 588.0 | |
| Cl– | 22,336.0 | |
| HCO3– | 156.0 | |
| NO3– | 1.0 | |
| SO43– | 2,440.0 | |
| PO3– | < 0.1 | |
| CO32– | < 0.1 | |
| SiO2 | < 1.0 | |
| Other Parameters | ||
| Total dissolved solid (TDS) | 43,550.0 | mg/l |
| Total suspended solids (TSS) | < 5.0 | mg/l |
| Total alkalinity | 128.0 | mg/l as CaCO3 |
| pH | 8.1 | |
| Conductivity | 72,550.0 | μS/cm2 |
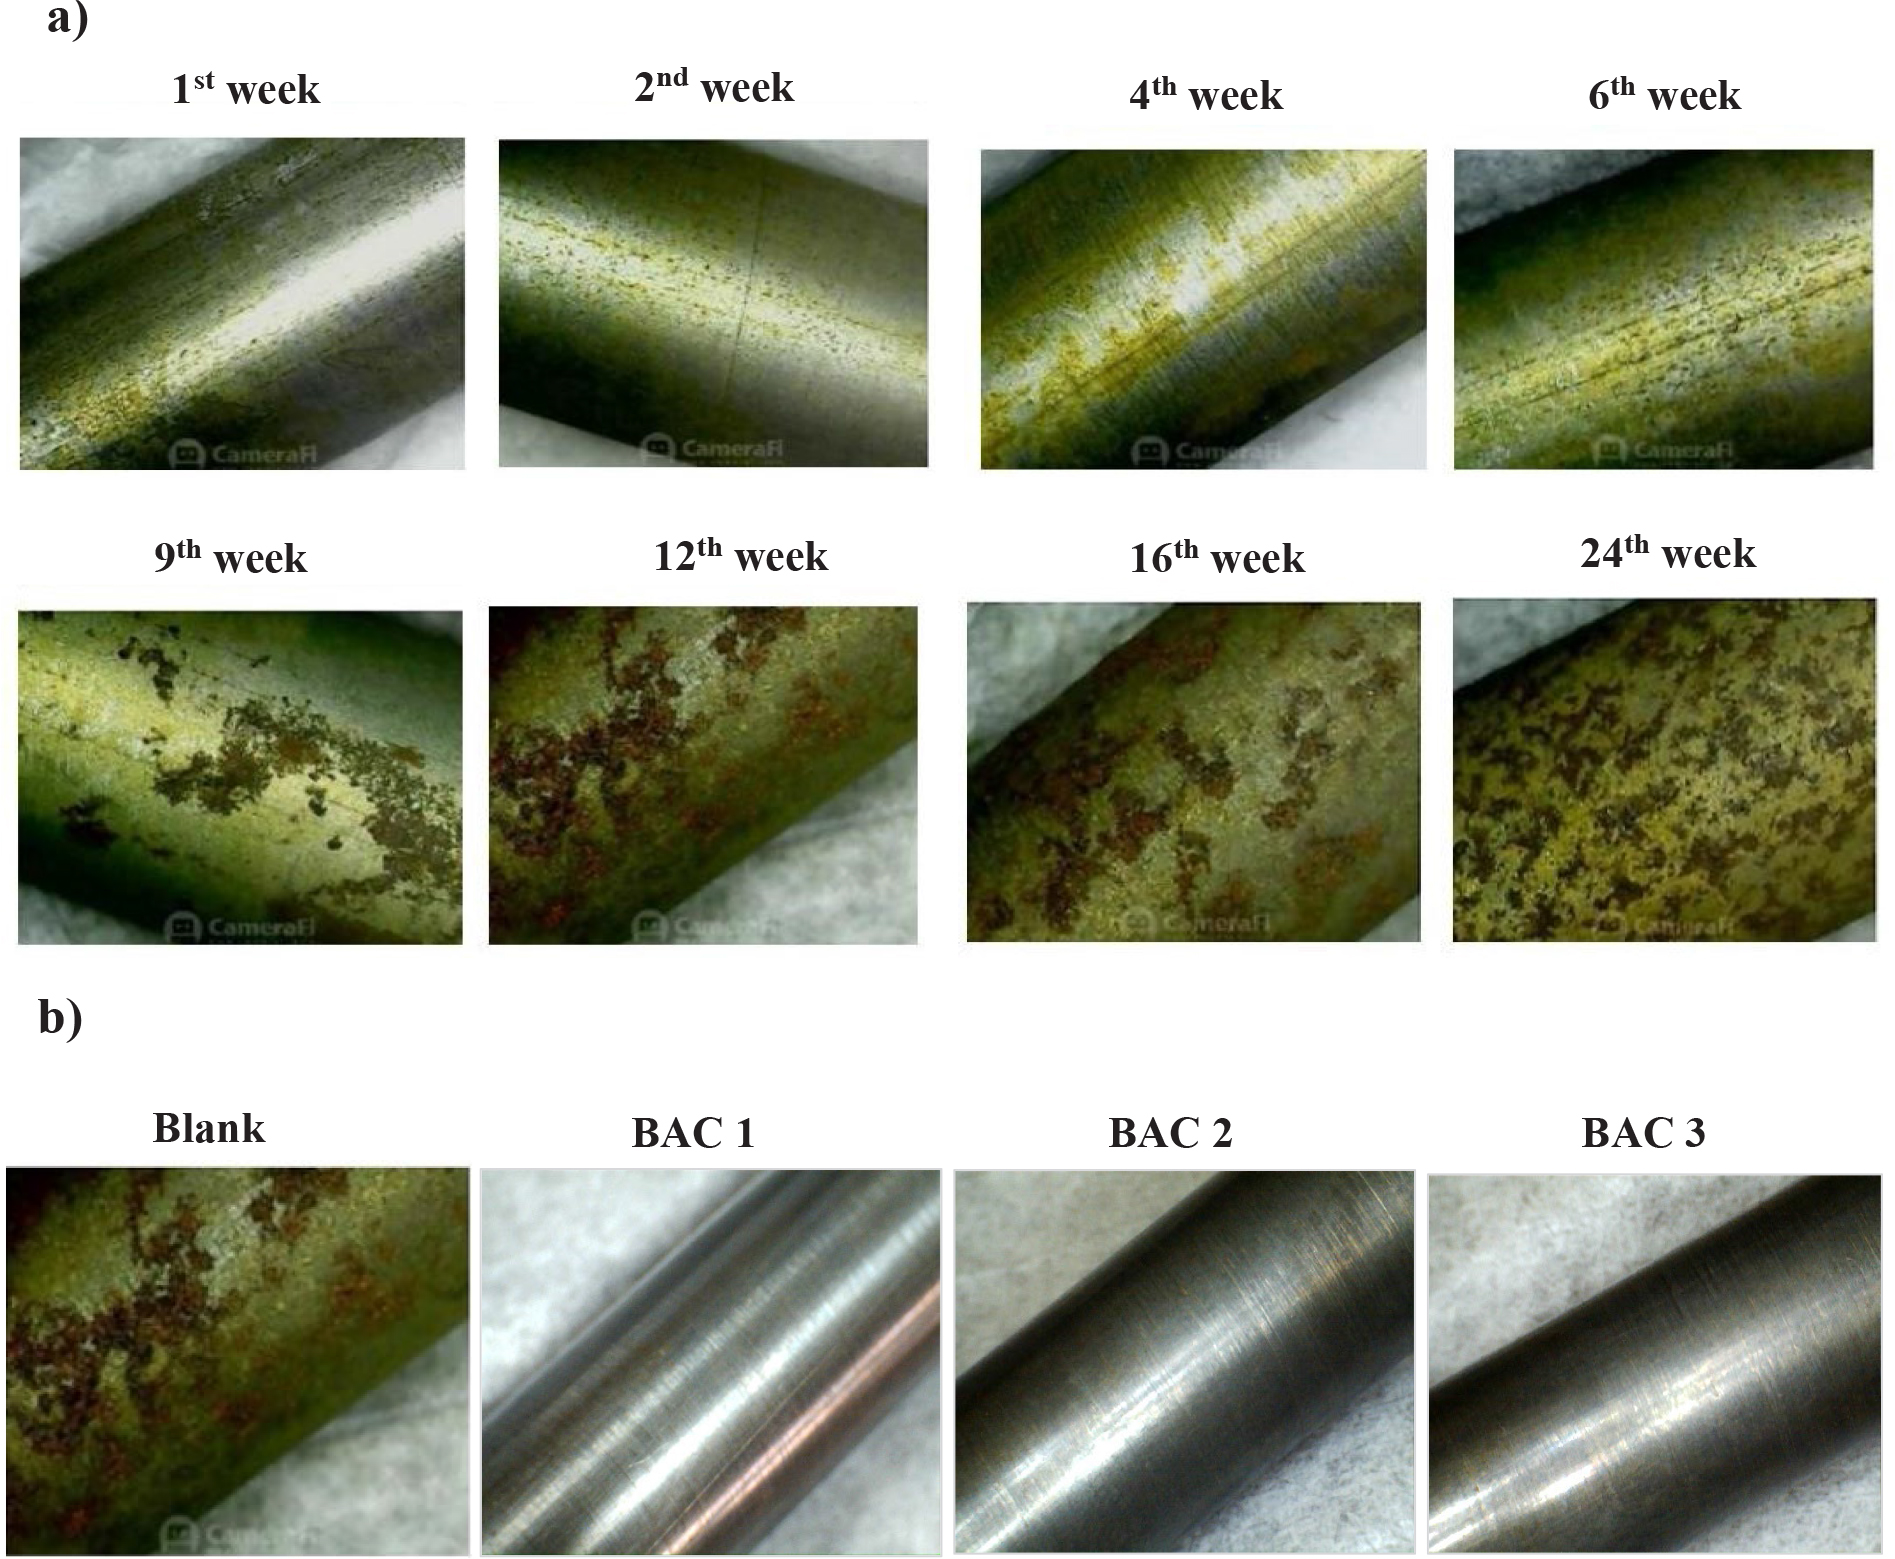
Fig. 1a.
Visual images of mild steel specimens after immersion in a) free seawater at different time intervals and b) after 12 weeks of exposure to seawater without and with bacterial inhibitors.
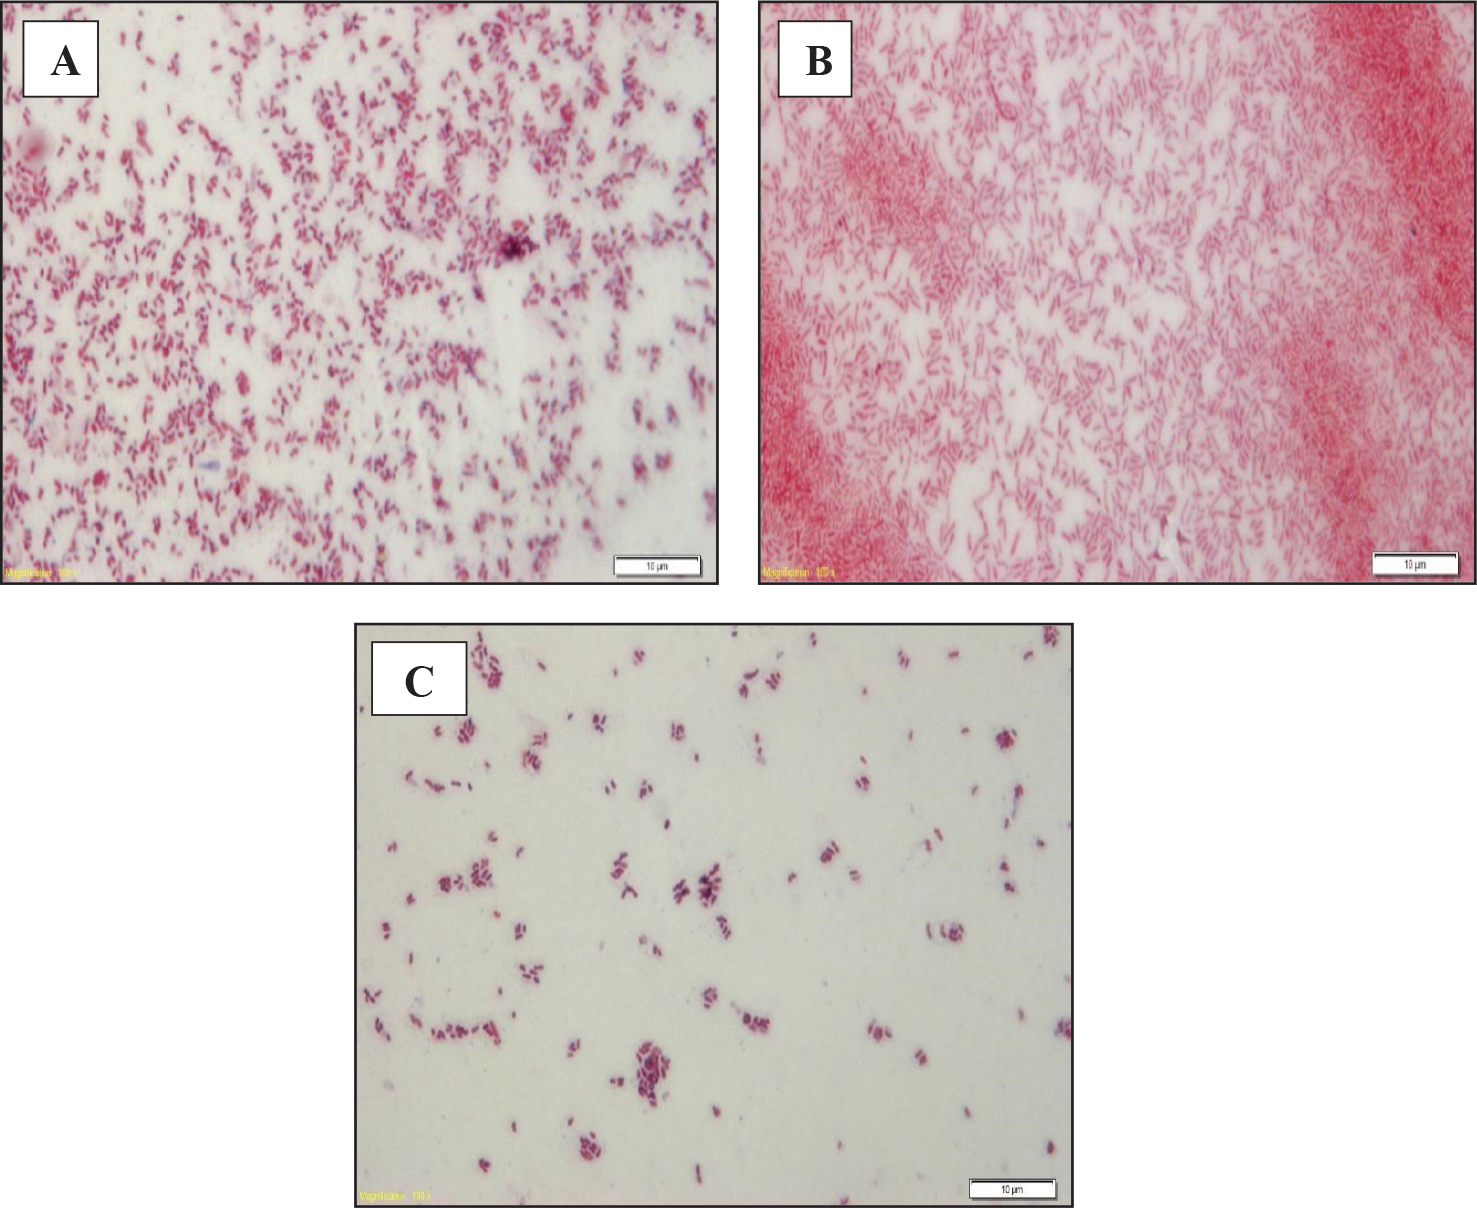
Fig. 2.
Alteromonas mediterranea isolates a) BAC1, b) BAC2, and c) BAC3. The first description was based on its motility and Gram-negative status. 100×, scale bar = 10 μm.
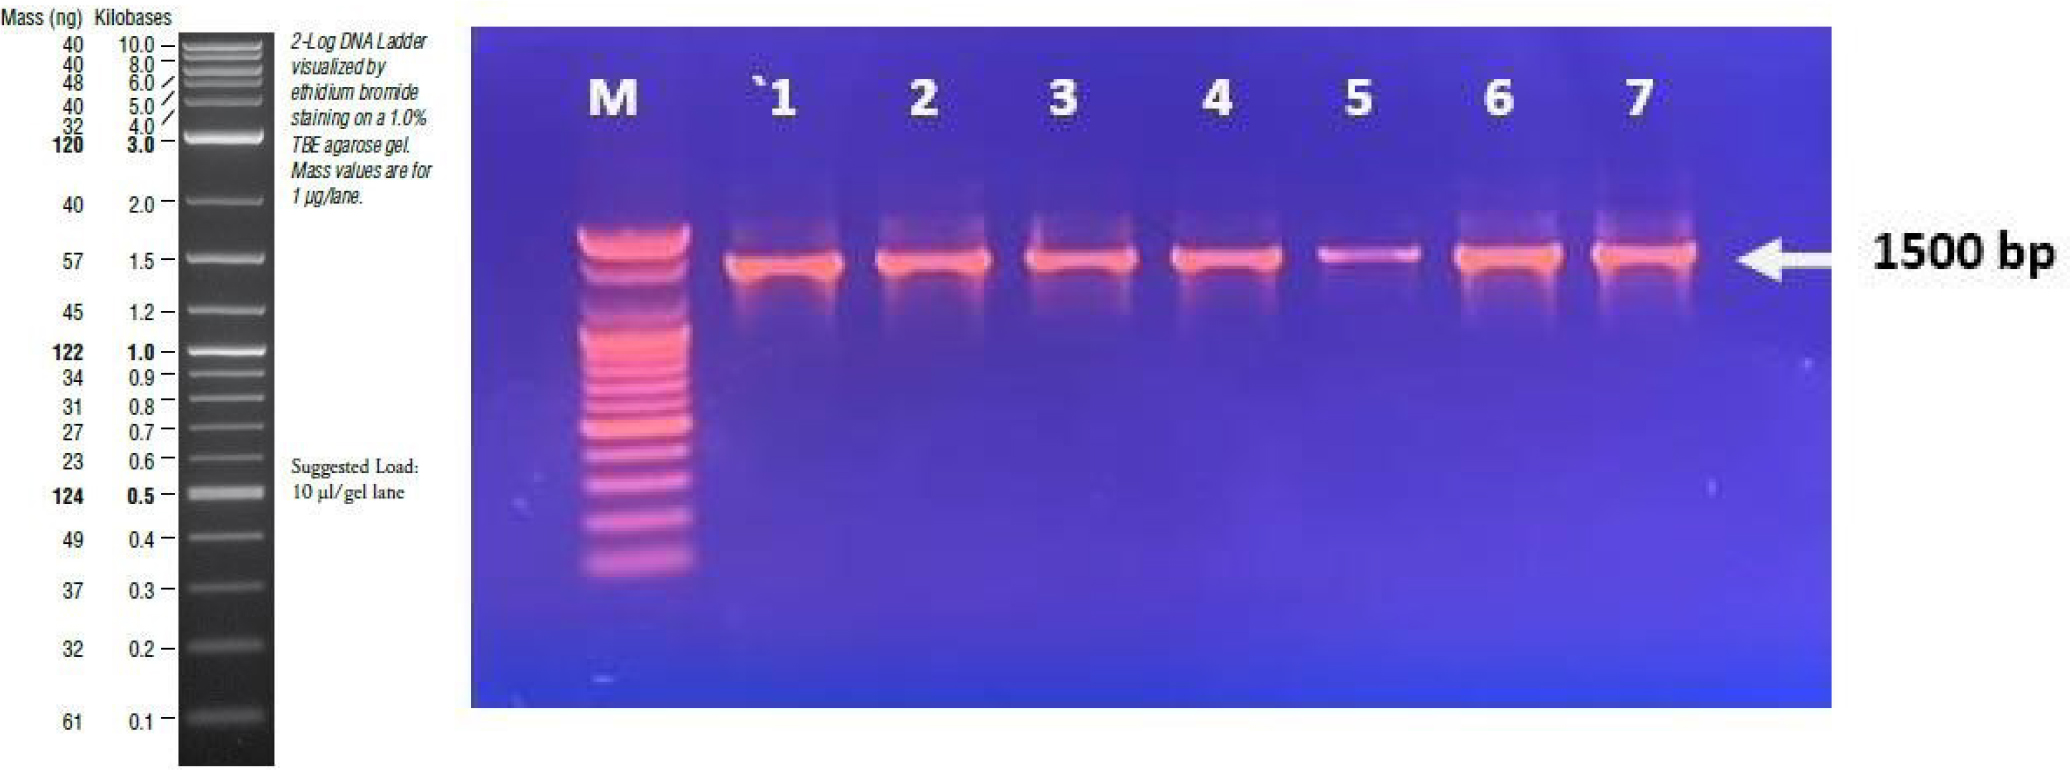
Fig. 3.
The agarose gel electrophoresis showing the amplification of 16S rRNA gene from seven bacterial isolates (1 to 7). M – DNA ladder: molecular size marker
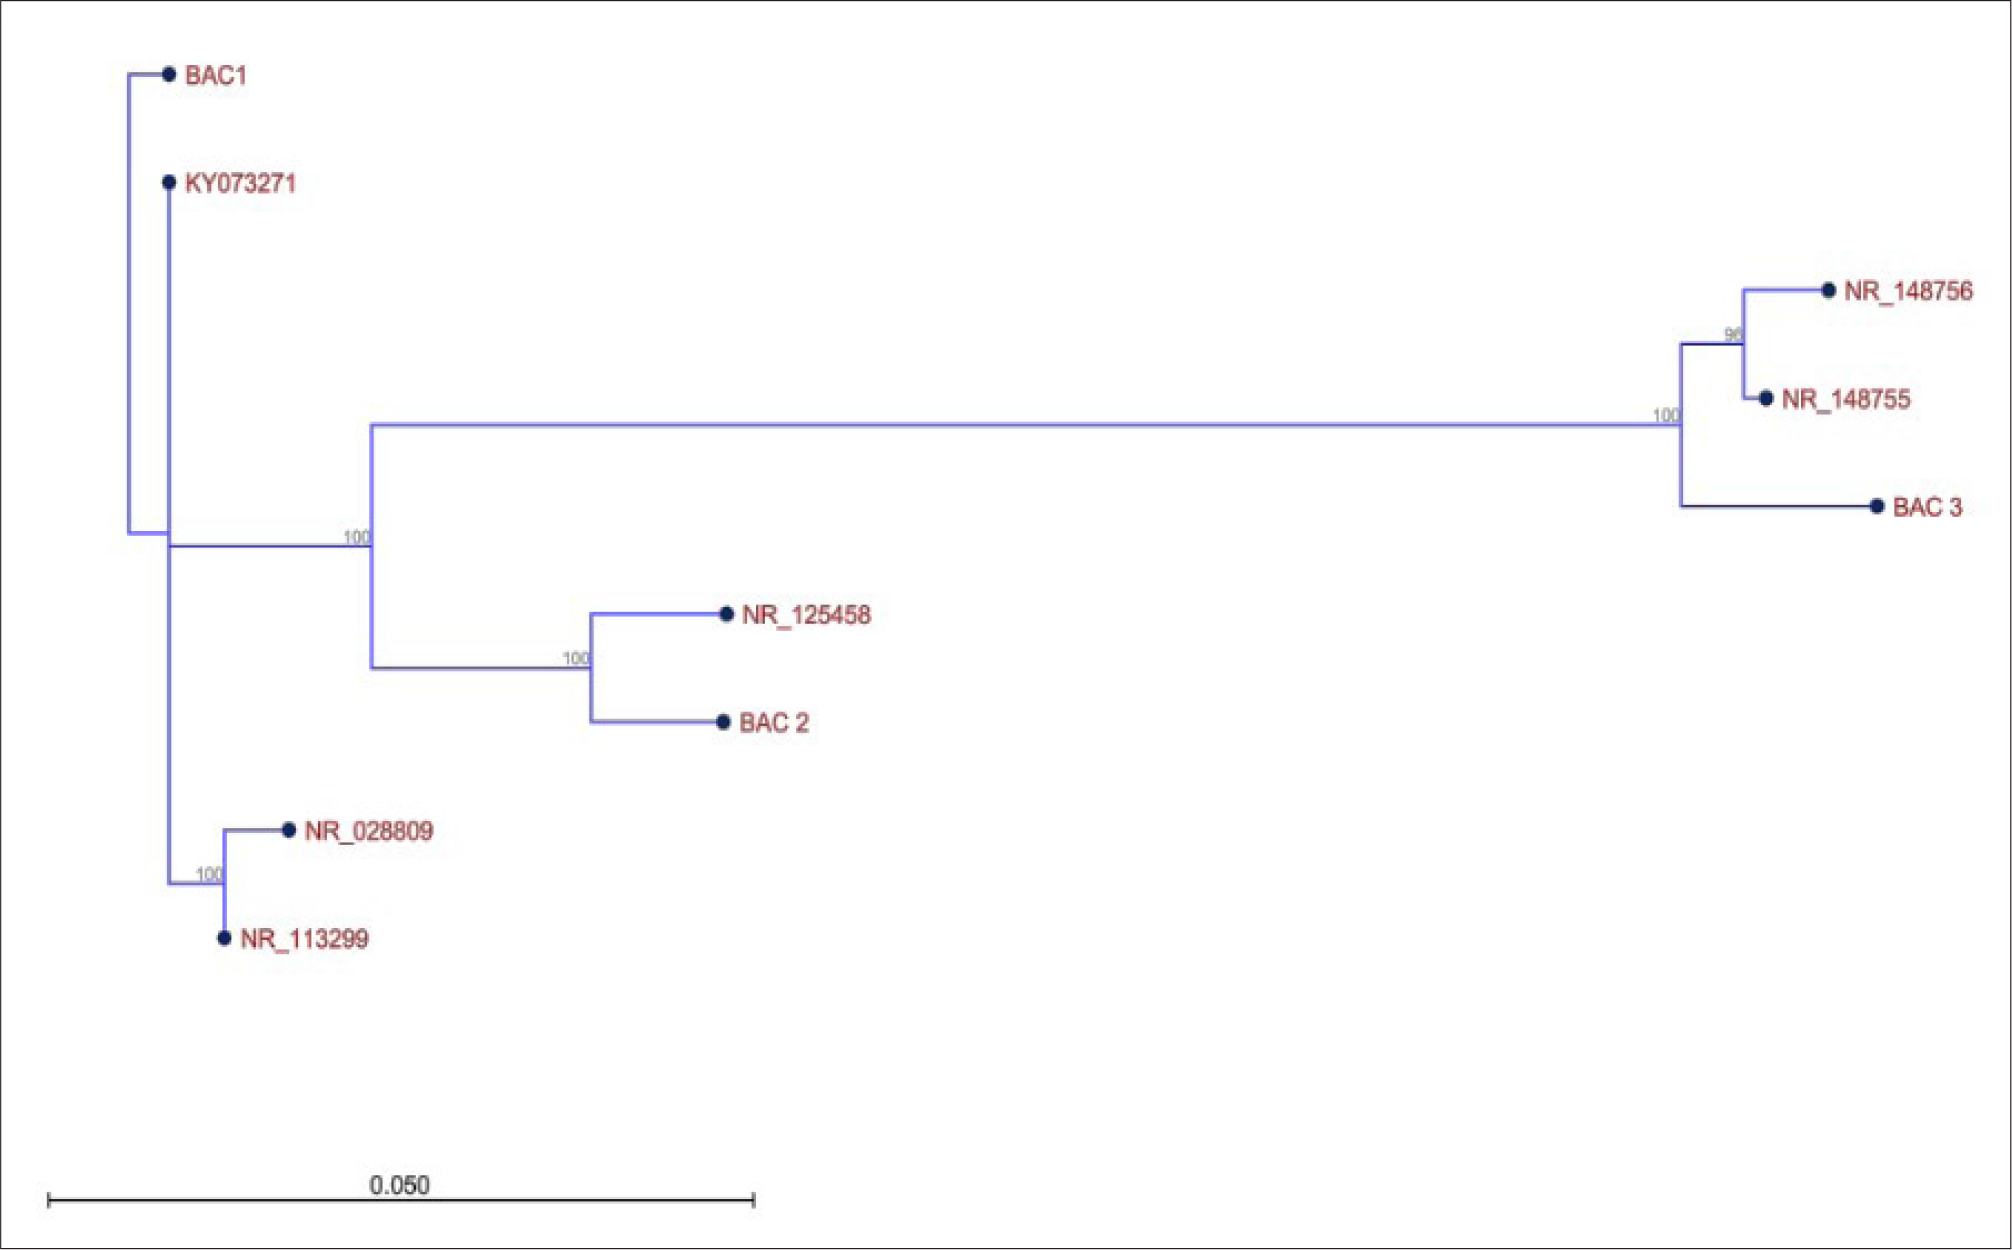
Fig. 4.
The phylogenetic tree was constructed based on the alignment of the 16S rRNA gene sequences of BAC1 (OR852740.1), BAC2 (OR852741.1), and BAC3 (OR852742.1) with other bacterial accessions available in GenBank. The tree was constructed using neighbor-joining (NJ) in CLC Main Workbench V8.1.3 (QIAGEN, Germany). The numerical values at the branch nodes indicate the bootstrap values.
Table II
Information and identification for 16S rRNA gene sequences of BAC1, BAC 2, and BAC 3.
| Code | Reference accession numbers | Identified bacterial isolates | Identity % |
|---|---|---|---|
| BAC 1 (OR852740.1) | NR 113299.1 | Pseudoalteromonas phenolica | 99.42% |
| NR 028809.1 | Pseudoalteromonas phenolica | 98.27% | |
| KY073271 | Pseudoalteromonas phenolica | 99.80% | |
| BAC 2 (OR852741.1) | NR 125458.1 | Pseudoalteromonas shioyasakiensis | 96.67% |
| BAC 3 (OR852743.1) | NR 148755.1 | Alteromonas mediterranea | 98.17% |
| NR 148756.1 | Alteromonas mediterranea | 98.46% |
Table III
Pit depth and corrosion rates of mild steel control at different immersion time in seawater.
| Immersion period (weeks) | Weight loss Δw (g) | Pit depth Pd (μm) | Corrosion rate CRWL (μm y−1) |
|---|---|---|---|
| 1st | 0.0097 ± 0.0006 | 0.70 ± 0.03 | 36.54 ± 1.12 |
| 2nd | 0.0161 ± 0.0011 | 1.13 ± 0.05 | 29.37 ± 0.94 |
| 4th | 0.0311 ± 0.0018 | 2.27 ± 0.07 | 29.55 ± 0.97 |
| 6th | 0.0484 ± 0.0024 | 3.36 ± 0.09 | 29.19 ± 1.03 |
| 9th | 0.0820 ± 0.0031 | 5.68 ± 0.12 | 32.93 ± 1.22 |
| 12th | 0.0398 ± 0.0042 | 2.75 ± 0.10 | 11.95 ± 0.81 |
| 16th | 0.0368 ± 0.0054 | 2.63 ± 0.09 | 8.56 ± 0.63 |
| 24th | 0.0789 ± 0.0079 | 5.70 ± 0.14 | 12.38 ± 0.77 |
Table IV
Corrosion rates and inhibition efficiencies for mild steel corrosion in seawater in the presence of BAC1 (Pseudoalteromonas phenolica) over a 24-week immersion period.
| Immersion period (weeks) | Weight loss Δw (g) | Pit depth Pd (μm) | Corrosion rate CRWL (μm y−1) | IEWL% |
|---|---|---|---|---|
| 1st | 0.0008 ± 0.00003 | 0.05 ± 0.01 | 2.64 ± 0.10 | 92.78 ± 1.1 |
| 2nd | 0.0016 ± 0.00005 | 0.12 ± 0.02 | 3.04 ± 0.12 | 89.65 ± 1.2 |
| 4th | 0.0021 ± 0.00007 | 0.15 ± 0.02 | 1.95 ± 0.08 | 93.41 ± 1.0 |
| 6th | 0.0023 ± 0.00008 | 0.17 ± 0.02 | 1.44 ± 0.07 | 95.08 ± 0.9 |
| 9th | 0.0029 ± 0.00009 | 0.21 ± 0.03 | 1.19 ± 0.05 | 96.37 ± 0.8 |
| 12th | 0.0028 ± 0.00008 | 0.20 ± 0.03 | 0.86 ± 0.04 | 92.76 ± 0.7 |
| 16th | 0.0150 ± 0.0004 | 1.06 ± 0.05 | 3.45 ± 0.14 | 59.74 ± 1.5 |
| 24th | 0.0255 ± 0.0006 | 1.66 ± 0.06 | 3.60 ± 0.15 | 70.94 ± 1.4 |
Table V
Corrosion rates and inhibition efficiencies for mild steel corrosion in seawater in the presence of BAC 2 (Pseudoalteromonas shioyasakiensis) over a 24-week immersion.
| Immersion period (weeks) | Weight loss Δw (g) | Pit depth Pd (μm) | Corrosion rate CRWL (μm y−1) | IEWL% |
|---|---|---|---|---|
| 1st | 0.0003 ± 0.00001 | 0.02 ± 0.01 | 1.11 ± 0.05 | 96.96 ± 0.9 |
| 2nd | 0.0010 ± 0.00004 | 0.09 ± 0.02 | 2.43 ± 0.10 | 91.72 ± 1.1 |
| 4th | 0.0024 ± 0.00006 | 0.17 ± 0.02 | 2.26 ± 0.09 | 92.37 ± 1.0 |
| 6th | 0.0025 ± 0.00007 | 0.19 ± 0.02 | 1.67 ± 0.08 | 94.28 ± 0.9 |
| 9th | 0.0027 ± 0.00008 | 0.19 ± 0.02 | 1.12 ± 0.05 | 96.60 ± 0.8 |
| 12th | 0.0022 ± 0.00007 | 0.16 ± 0.02 | 0.69 ± 0.03 | 94.18 ± 0.7 |
| 16th | 0.0156 ± 0.0005 | 1.10 ± 0.05 | 3.57 ± 0.13 | 58.27 ± 1.6 |
| 24th | 0.0228 ± 0.0006 | 1.62 ± 0.06 | 3.52 ± 0.14 | 71.55 ± 1.4 |
Table VI
Corrosion rates and inhibition efficiencies for mild steel corrosion in seawater in the presence of BAC 3 (Alteromonas mediterranea) over a 24-week immersion period.
| Immersion period (weeks) | Weight loss Δw (g) | Pit depth Pd (μm) | Corrosion rate CRWL (μm y−1) | IEWL% |
|---|---|---|---|---|
| 1st | 0.0001 ± 0.00001 | 0.007 ± 0.01 | 0.36 ± 0.02 | 99.00 ± 0.5 |
| 2nd | 0.0009 ± 0.00003 | 0.07 ± 0.02 | 1.74 ± 0.08 | 94.06 ± 0.9 |
| 4th | 0.0017 ± 0.00006 | 0.12 ± 0.02 | 1.60 ± 0.07 | 94.59 ± 0.8 |
| 6th | 0.0027 ± 0.00007 | 0.18 ± 0.03 | 1.56 ± 0.07 | 94.65 ± 0.8 |
| 9th | 0.0036 ± 0.00008 | 0.26 ± 0. 03 | 1.52 ± 0.06 | 95.39 ± 0.7 |
| 12th | 0.0038 ± 0.00009 | 0.27 ±0.04 | 1.18 ± 0.05 | 90.11 ± 0.6 |
| 16th | 0.0159 ± 0.0005 | 1.16 ± 0.05 | 3.80 ± 0.15 | 55.65 ± 1.8 |
| 24th | 0.0786 ± 0.0012 | 5.44 ± 0.10 | 11.82 ± 0.30 | 4.57 ± 2.0 |
Table VII
Impedance parameters for corrosion of mild steel in sweater in the absence and presence of bacterial inhibitors.
| Medium | Time (h) | Rs(Ω cm2) | Rct (Ω cm2) | Cdl (μF cm-2) | IER% |
|---|---|---|---|---|---|
| Blank | 1 | 3.73 ± 0.08 | 916.7 ± 35 | 15.68 ± 0.6 | – |
| BAC 1 | 5.31 ± 0.12 | 8826.0 ± 110 | 4.48 ± 0.2 | 89.61 ± 1.2 | |
| BAC 2 | 5.67 ± 0.13 | 6914.0 ± 95 | 4.923 ± 0.2 | 86.74 ± 1.1 | |
| BAC 3 | 3.19 ± 0.09 | 6128.0 ± 90 | 5.18 ± 0.2 | 85.05 ± 1.0 | |
| Blank | 24 | 4.51 ± 0.10 | 631.6 ± 30 | 20.01 ± 0.7 | – |
| BAC 1 | 4.87 ± 0.11 | 1183.0 ± 45 | 9.61 ± 0.3 | 46.61 ± 1.1 | |
| BAC 2 | 5.09 ± 0.12 | 8112.0 ± 102 | 2.07 ± 0.1 | 92.22 ± 1.3 | |
| BAC 3 | 3.45 ± 0.10 | 1118.0 ± 42 | 10.25 ± 0.4 | 43.56 ± 1.0 |
1 IER% – Inhibition Efficiency Percentage –This indicates the percentage of inhibition achieved by the inhibitor, comparing the impedance to the blank (no inhibitor) condition.
1 Cdl: (μF cm-2) – Double Layer Capacitance – It represents the capacitance associated with the interface between the electrode and the electrolyte. It’s measured in microfarads per square centimeter (μF cm2).
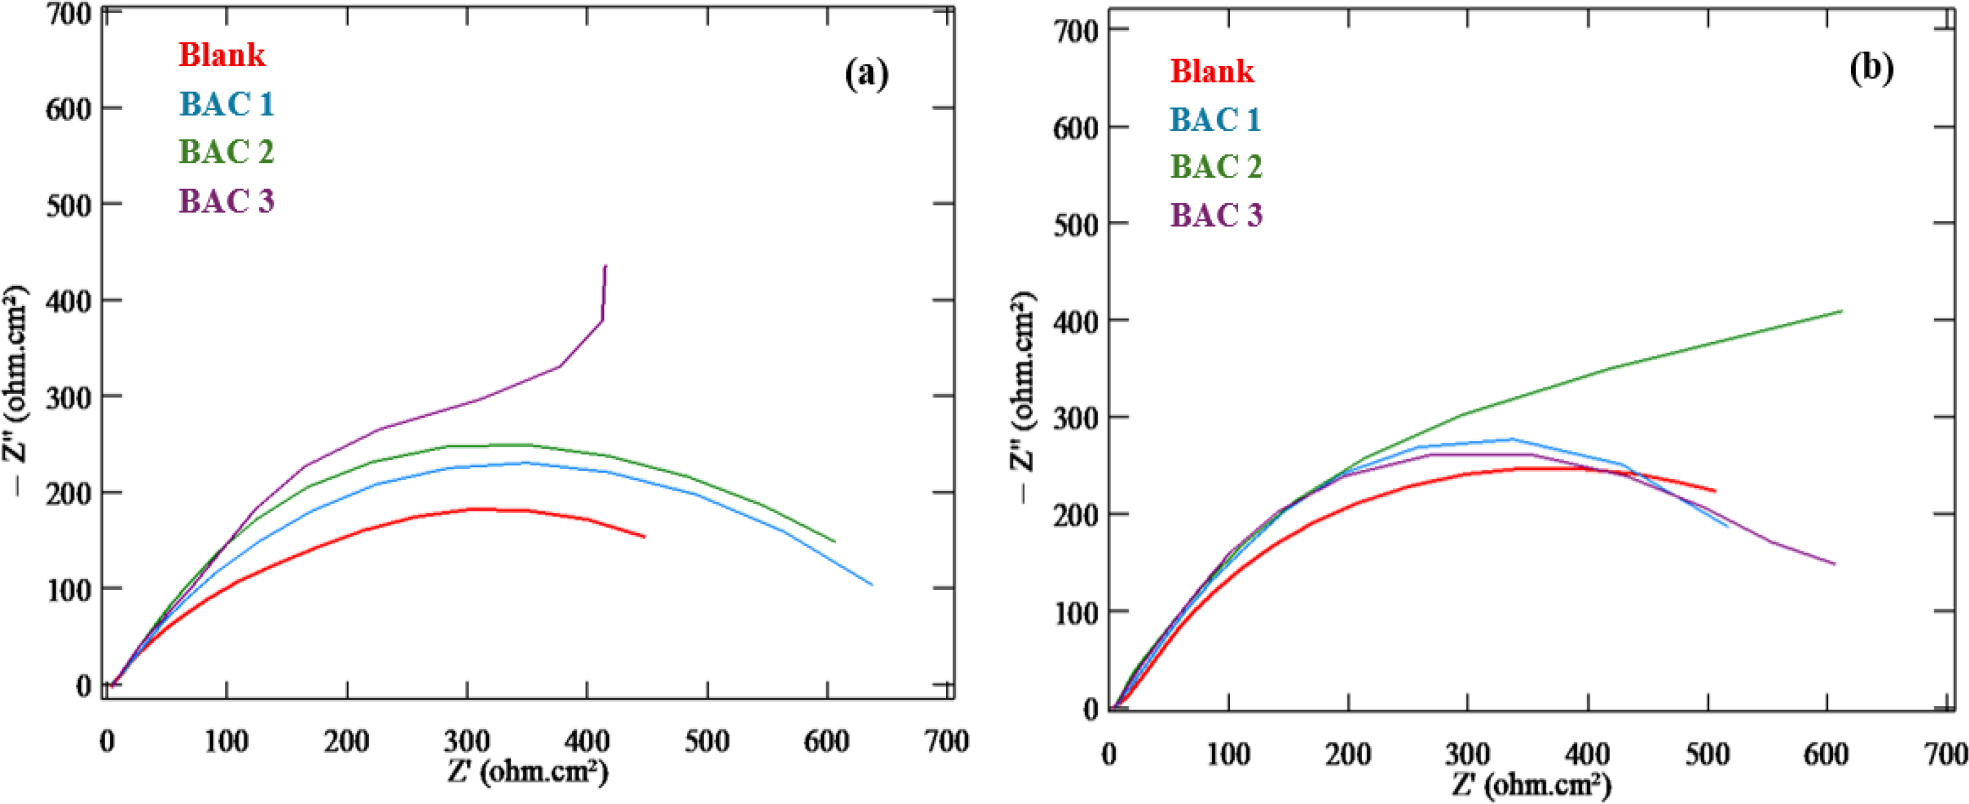
Fig. 5.
Nyquist plots for mild steel corrosion in seawater in the absence and presence of bacterial inhibitors at a) 1 hour and b) 24 hours of immersion.
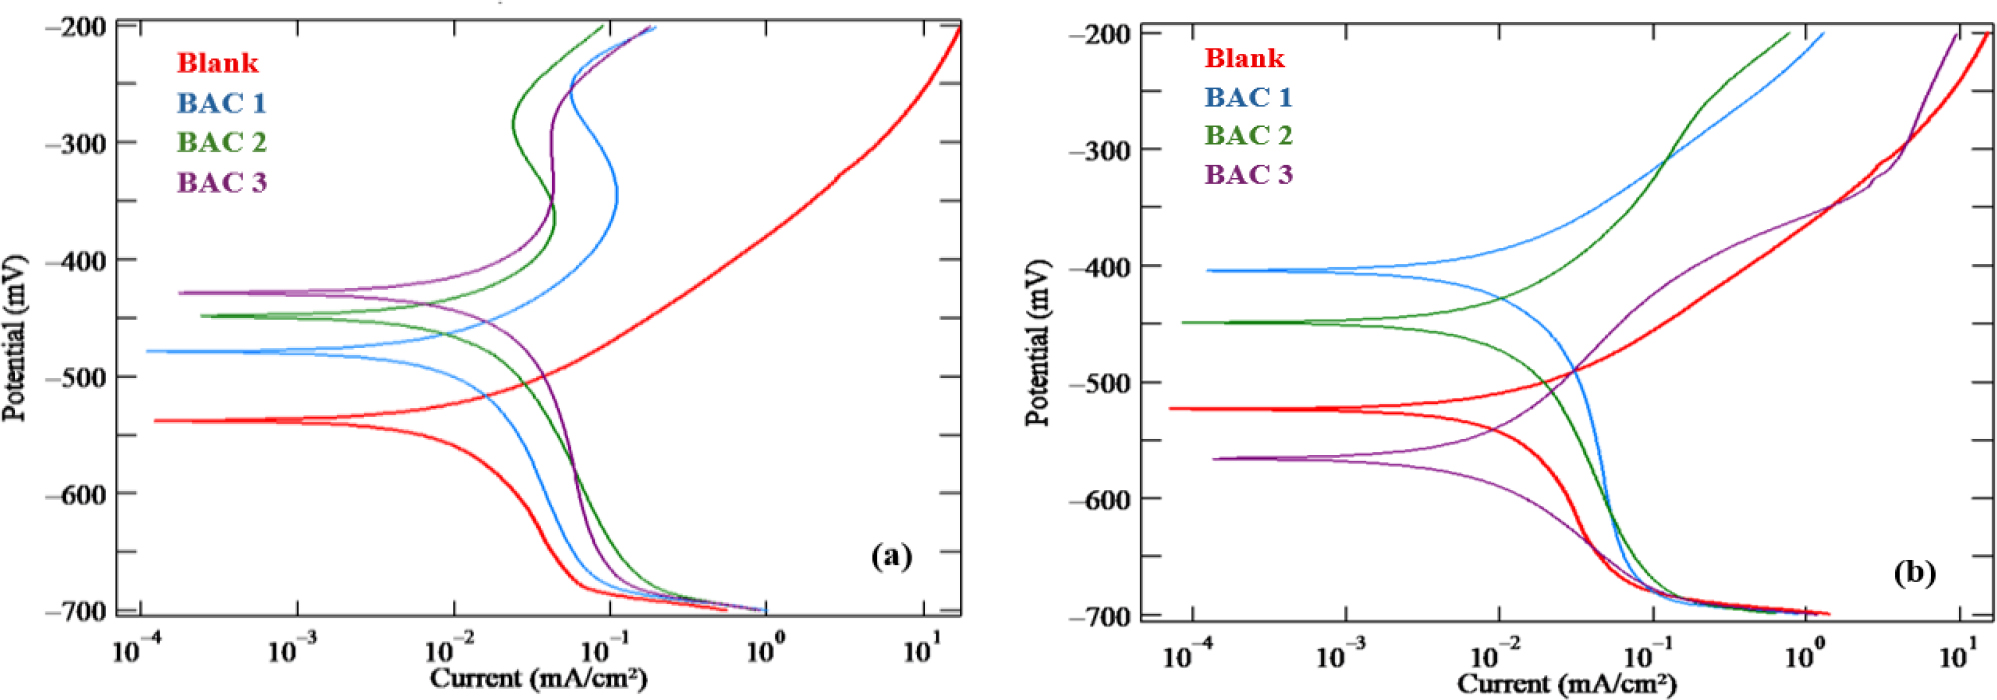
Fig. 6.
Polarization curves for mild steel corrosion in seawater in the absence and presence of bacterial inhibitors at a) 1 hour and b) 24 hours a of immersion.
Table VIII
Polarization parameters for corrosion of mild steel in sweater in the absence and presence of bacterial inhibitors.
| Medium | Time (h) | –Ecorr(mv) | βa (mV dec-1) | -βc (mV dec-1) | icorr (mA cm-2) | IEi % |
|---|---|---|---|---|---|---|
| Blank | 1 | 538.4 ± 2.1 | 80.25 ± 1.5 | 43.73 ± 1.2 | 0.3607 ± 0.012 | – |
| BAC 1 | 478.7 ± 1.8 | 70.28 ± 1.2 | 121.92 ± 1.6 | 0.0099 ± 0.0004 | 97.25 ± 0.8 | |
| BAC 2 | 449.1 ±1.7 | 84.28 ± 1.4 | 155.09 ± 1.7 | 0.0097 ± 0.0003 | 97.31 ± 0.9 | |
| BAC 3 | 429.2 ± 1.6 | 92.80 ± 1.4 | 97.73 ± 1.4 | 0.0081 ± 0.0003 | 97.75 ± 0.9 | |
| Blank | 24 | 524.1 ± 2.0 | 54.64 ± 1.3 | 57.39 ± 1.3 | 0.4991 ± 0.015 | – |
| BAC 1 | 405.0 ± 1.9 | 62.54 ± 1.1 | 123.19 ± 1.5 | 0.0229 ± 0.0006 | 95.41 ± 0.7 | |
| BAC 2 | 449.5 ± 1.8 | 97.49 ± 1.6 | 150.68 ± 1.6 | 0.0189 ± 0.0005 | 96.21 ± 0.8 | |
| BAC 3 | 566.3 ± 2.2 | 94.02 ± 1.5 | 80.17 ± 1.3 | 0.1868 ± 0.006 | 62.57 ± 1.2 |
1 IEi% – Inhibition Efficiency Percentage – Indicates the percentage of inhibition achieved by the inhibitor compared to the blank condition. icorr: Corrosion Current Density – Represents the rate of metal loss due to corrosion.
1 βc – Cathodic Tafel Slope – Denotes the slope of the cathodic Tafel line, indicating the rate of cathodic reaction in electrochemical corrosion processes.