
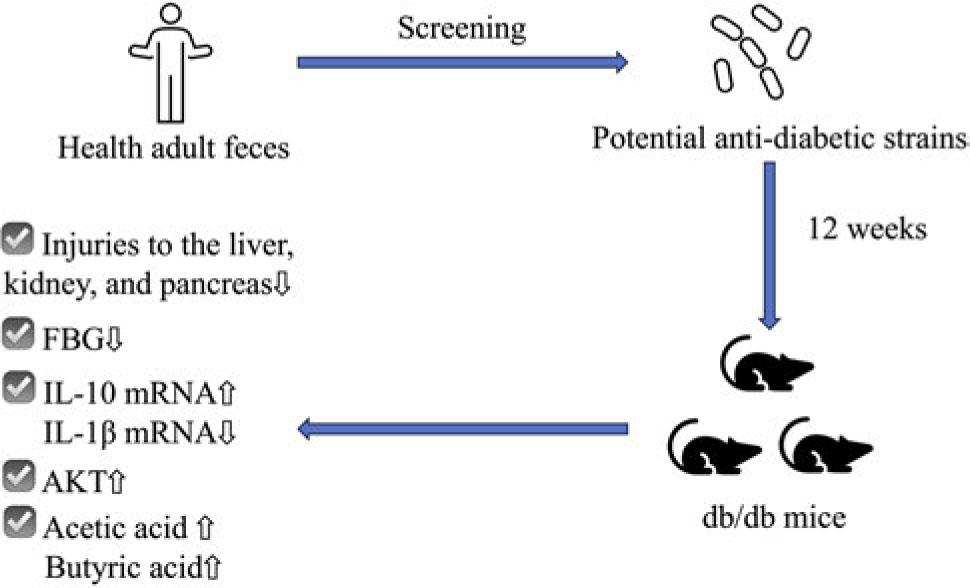
Fig 1.
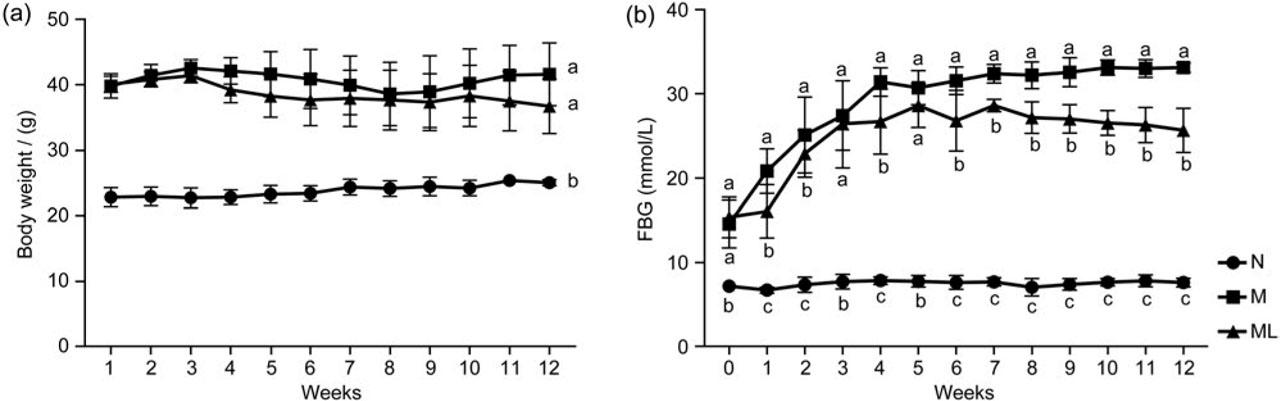
Fig 2.
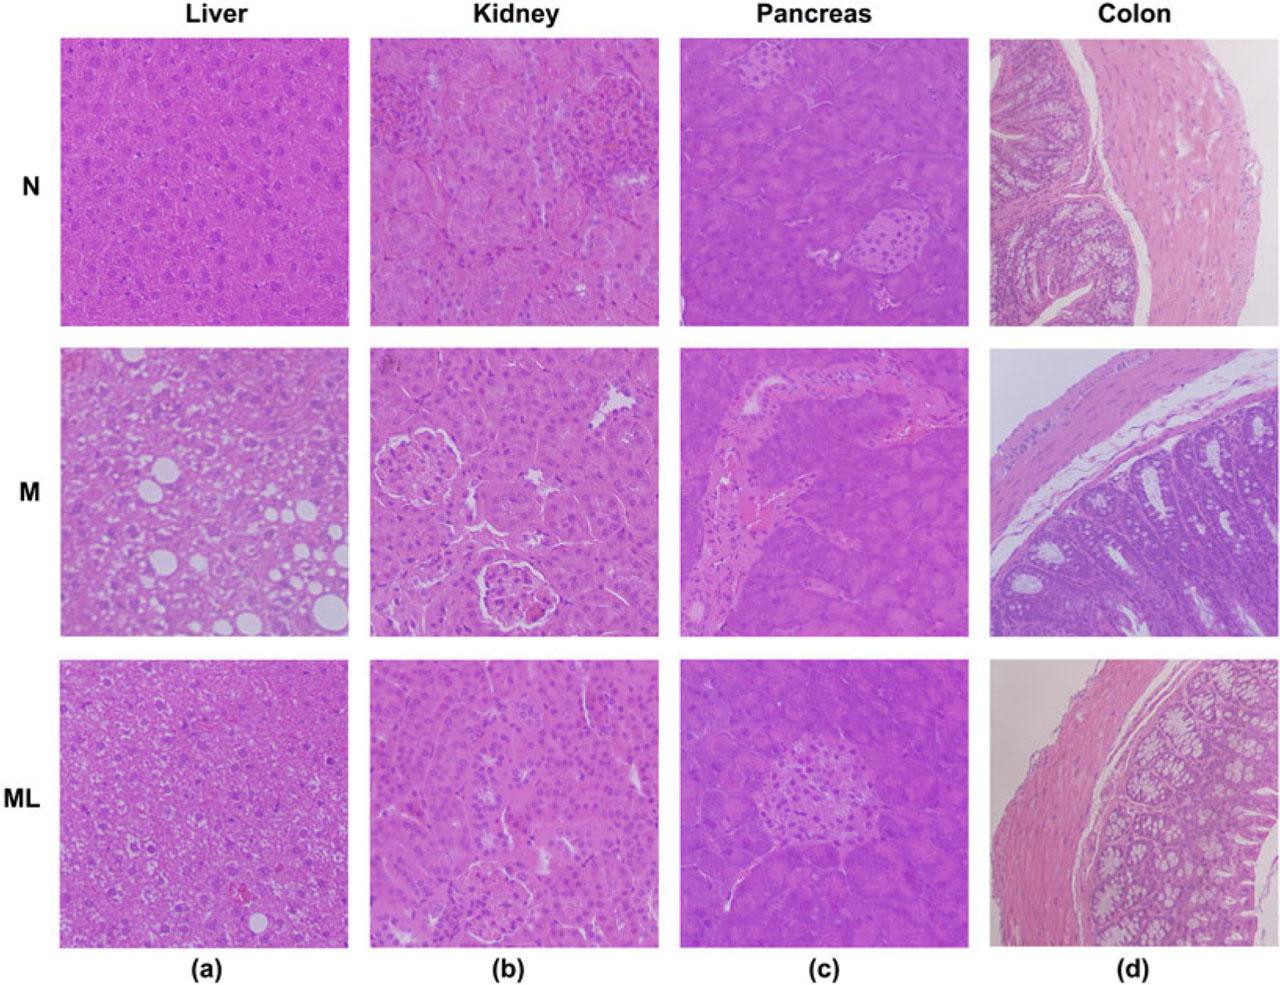
Fig 3.
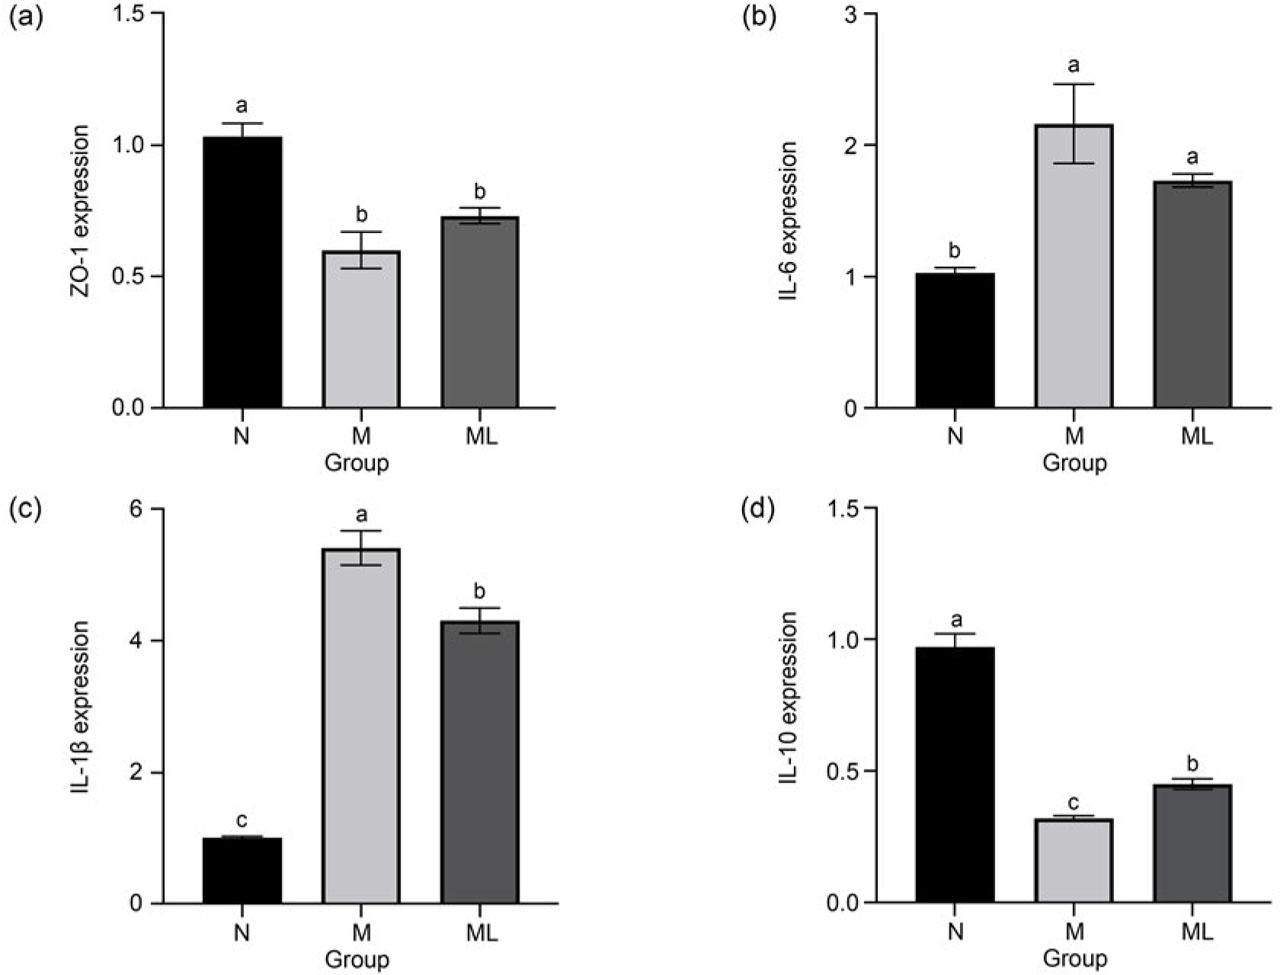
Fig 4.
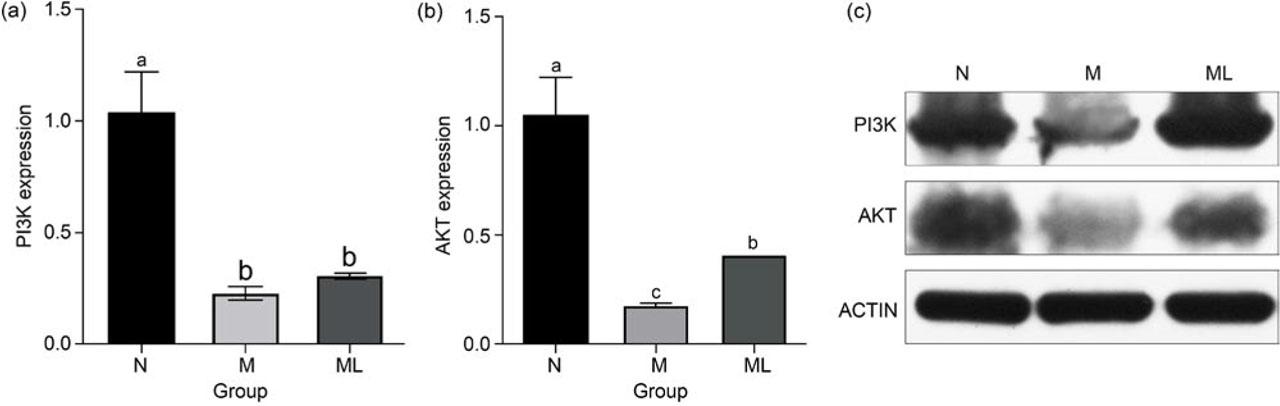
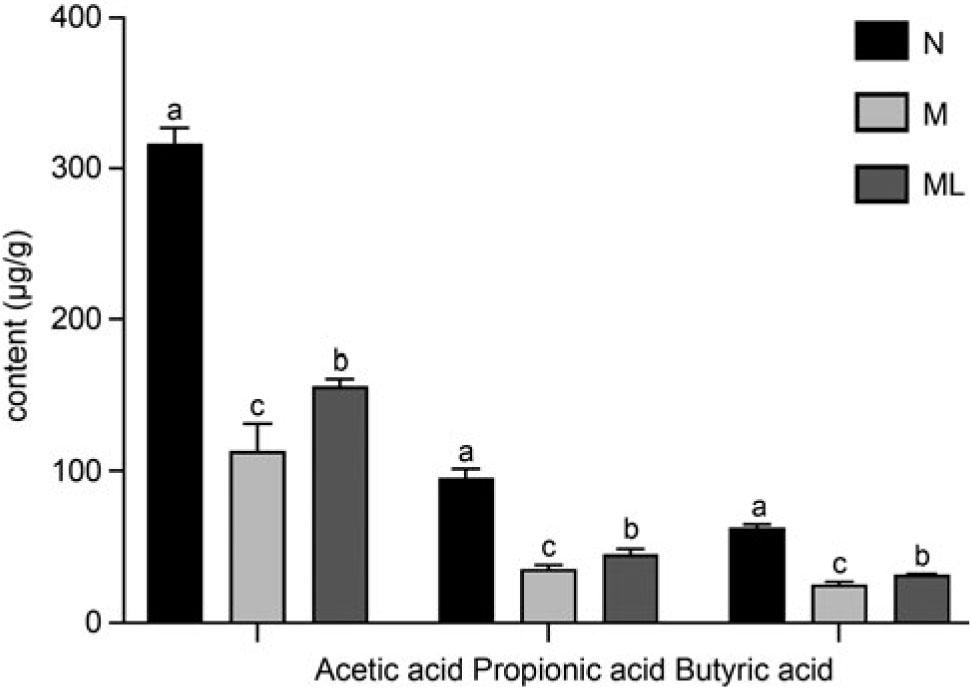
Fig 5.
Specific gene primers used for qRT-PCR_
| Gene | Primers | Length (bp) |
|---|---|---|
| IL-6 | F: CCCCAATTTCCAATGCTCTCC | 141 |
| IL-10 | F: TTTAAGGGTTACTTGGGTTGCC | 106 |
| IL-1β | F: TCAAATCTCGCAGCAGCACATC | 206 |
| GAPDH | F: CCTCGTCCCGTAGACAAAATG | 133 |
Identification of Lactobacillaceae isolated based on 16S rDNA sequences and gene accession number assigned by NCBI_
| Isolate number | Species | GenBank accession number | Similarity (%) |
|---|---|---|---|
| 4 | Limosilactobacillus fermentum | MT482589 | 99.73 |
| 5 | Limosilactobacillus fermentum | MT482590 | 99.93 |
| 6 | Limosilactobacillus fermentum | MT482591 | 99.93 |
| 8 | Lactiplantibacillus plantarum | MT482586 | 99.93 |
| 10 | Lactiplantibacillus plantarum | MT482587 | 99.80 |
| 11 | Limosilactobacillus fermentum | MT463724 | 99.93 |
| 12 | Limosilactobacillus fermentum | MT482592 | 99.93 |
| 13 | Limosilactobacillus fermentum | MT482593 | 99.93 |
| 14 | Limosilactobacillus fermentum | MT482594 | 99.93 |
| 16 | Limosilactobacillus fermentum | MT482595 | 99.93 |
| 18 | Limosilactobacillus fermentum | MT482596 | 99.93 |
| 20 | Lactiplantibacillus plantarum | MT482588 | 99.93 |
| 22 | Lactiplantibacillus plantarum | MT463726 | 99.86 |
| 25 | Lactiplantibacillus plantarum | MT463727 | 99.86 |
| 26 | Limosilactobacillus fermentum | MT482597 | 99.93 |
| 27 | Limosilactobacillus fermentum | MT482598 | 99.93 |
| 28 | Limosilactobacillus fermentum | MT482599 | 99.93 |
| 29 | Limosilactobacillus fermentum | MT482600 | 99.93 |
| 30 | Limosilactobacillus fermentum | MT482601 | 99.93 |
| 33 | Limosilactobacillus fermentum | MT482602 | 99.93 |
| 38 | Limosilactobacillus fermentum | MT482603 | 99.79 |
| 39 | Limosilactobacillus fermentum | MT482604 | 99.86 |
| 305 | Limosilactobacillus fermentum | MT463725 | 99.30 |
Orthogonal test of the inhibitory activities to α-amylase of Lactobacillaceae powders_
| Trial | A | B | C | D | Inhibitory activity (%) |
|---|---|---|---|---|---|
| 1 | 1 | 1 | 3 | 2 | 70.00 |
| 2 | 1 | 2 | 1 | 1 | 82.50 |
| 3 | 1 | 3 | 2 | 3 | 38.00 |
| 4 | 2 | 1 | 2 | 1 | 71.50 |
| 5 | 2 | 2 | 3 | 3 | 7.50 |
| 6 | 2 | 3 | 1 | 2 | 31.00 |
| 7 | 3 | 1 | 1 | 3 | 43.00 |
| 8 | 3 | 2 | 2 | 2 | 30.00 |
| 9 | 3 | 3 | 3 | 1 | 25.50 |
| K1 | 63.50 | 61.50 | 52.17 | 59.83 | |
| K2 | 36.67 | 40.00 | 46.33 | 43.67 | |
| K3 | 32.83 | 31.50 | 34.33 | 29.50 | |
| R | 30.67 | 30.00 | 17.84 | 30.33 | |
| Optimum technologies | A1B1C1D1 | 93.18 ± 1.19 | |||
| SS | 0.334 | 0.294 | 0.096 | 0.279 | |
| df | 2 | 2 | 2 | 2 | |
| F | 10.969 | 9.637 | 3.156 | 9.143 | |
| Significance | * | * | * | ||
Orthogonal test of Lactobacillaceae powders’ inhibitory activities to α-glucosidase_
| Trial | A | B | C | D | Inhibitory activity (%) |
|---|---|---|---|---|---|
| 1 | 1 | 1 | 3 | 2 | 73.57 |
| 2 | 1 | 2 | 1 | 1 | 63.28 |
| 3 | 1 | 3 | 2 | 3 | 54.32 |
| 4 | 2 | 1 | 2 | 1 | 71.93 |
| 5 | 2 | 2 | 3 | 3 | 35.05 |
| 6 | 2 | 3 | 1 | 2 | 62.74 |
| 7 | 3 | 1 | 1 | 3 | 64.79 |
| 8 | 3 | 2 | 2 | 2 | 24.18 |
| 9 | 3 | 3 | 3 | 1 | 54.39 |
| K1 | 63.72 | 70.10 | 63.60 | 63.20 | |
| K2 | 56.57 | 40.84 | 53.50 | 53.50 | |
| K3 | 47.79 | 57.15 | 51.39 | 51.39 | |
| R | 15.94 | 29.26 | 12.22 | 11.81 | |
| Optimum technologies | A1B1C1D1 | 75.33 ± 2.89 | |||
| SS | 0.076 | 0.258 | 0.057 | 0.048 | |
| df | 2 | 2 | 2 | 2 | |
| F | 74.785 | 252.387 | 55.709 | ||
| Significance | * | * | * | * | |
Simulated digestion test and adhesion rates_
| Isolate | Survival rate (%) | Adhesion rate (%) |
|---|---|---|
| Lactiplantibacillus plantarum 22 | 12.42 ± 2.84 | 6.94 ± 0.27 |
| Lactiplantibacillus plantarum 25 | 9.10 ± 1.12 | 6.91 ± 0.11 |
| Limosilactobacillus fermentum 11 | 5.86 ± 0.52 | 6.09 ± 0.39 |
| Limosilactobacillus fermentum 305 | 8.82 ± 2.50 | 6.37 ± 0.28 |
Factors and levels of the orthogonal experiment of Lactobacillaceae powders_
| Level | A (Limosilactobacillus fermentum 11 (CFU/ml)) | B (Limosilactobacillus fermentum 305 (CFU/ml)) | C (Lactiplantibacillus plantarum 22 (CFU/ml)) | D (Lactiplantibacillus plantarum 25 (CFU/ml)) |
|---|---|---|---|---|
| 1 | 108 | 108 | 108 | 108 |
| 2 | 109 | 109 | 109 | 109 |
| 3 | 1010 | 1010 | 1010 | 1010 |
The inhibitory activities to α-amylase and α-glucosidase, and the viable count of the isolates_
| Isolate | Viable bacteria count (109CFU/ml) | α-amylase inhibitory activities (%) | α-glucosidase inhibitory activities (%) | |
|---|---|---|---|---|
| Lactiplantibacillus plantarum | 8 | 1.71 ± 0.47ab | 49.93 ± 2.06c | 12.39 ± 3.05a |
| 10 | 2.61 ± 0.38a | 56.72 ± 8.78ab | 12.60 ± 3.22a | |
| 20 | 2.29 ± 0.73ab | 17.33 ± 5.03d | 11.45 ± 4.18a | |
| 22 | 1.22 ± 0.47b | 62.29 ± 0.44a | 14.89 ± 0.38a | |
| 25 | 1.84 ± 0.70ab | 51.81 ± 3.65bc | 15.32 ± 0.89a | |
| Limosilactobacillus fermentum | 4 | 2.11 ± 0.64b | 20.96 ± 4.95f | 28.51 ± 5.73b |
| 5 | 2.15 ± 0.25b | 16.84 ± 8.34f | 15.91 ± 0.91d | |
| 6 | 2.93 ± 0.28ab | 44.94 ± 3.72c | 19.33 ± 1.02cd | |
| 11 | 2.55 ± 0.30b | 58.40 ± 1.68a | 52.63 ± 3.07a | |
| 12 | 0.93 ± 0.66c | 44.05 ± 4.51c | 17.98 ± 9.09cd | |
| 13 | 2.85 ± 0.69ab | 51.86 ± 4.20b | 17.60 ± 1.84cd | |
| 14 | 2.96 ± 0.52ab | 37.19 ± 7.29d | 4.93 ± 0.94e | |
| 16 | 3.92 ± 0.38a | 32.29 ± 9.59de | 15.35 ± 8.28d | |
| 18 | 2.16 ± 0.80b | 27.35 ± 7.43e | 15.94 ± 1.38d | |
| 26 | 2.53 ± 0.98b | 49.95 ± 6.54bc | 15.60 ± 2.62d | |
| 27 | 2.49 ± 0.92b | 41.39 ± 2.52cd | 20.83 ± 4.58c | |
| 28 | 3.59 ± 0.50ab | 47.92 ± 3.62bc | 20.53 ± 0.17c | |
| 29 | 2.23 ± 0.67b | 46.74 ± 3.31bc | 4.99 ± 0.56e | |
| 30 | 2.41 ± 1.43b | 55.38 ± 0.48ab | 15.69 ± 1.93d | |
| 33 | 1.70 ± 0.90bc | 47.49 ± 2.27bc | 14.19 ± 2.13d | |
| 38 | 3.16 ± 0.77ab | 50.59 ± 3.12bc | 8.10 ± 4.18e | |
| 39 | 1.89 ± 0.59bc | 37.77 ± 8.18d | 5.24 ± 0.89e | |
| 305 | 2.04 ± 0.51bc | 57.48 ± 5.04ab | 51.79 ± 1.13e |