
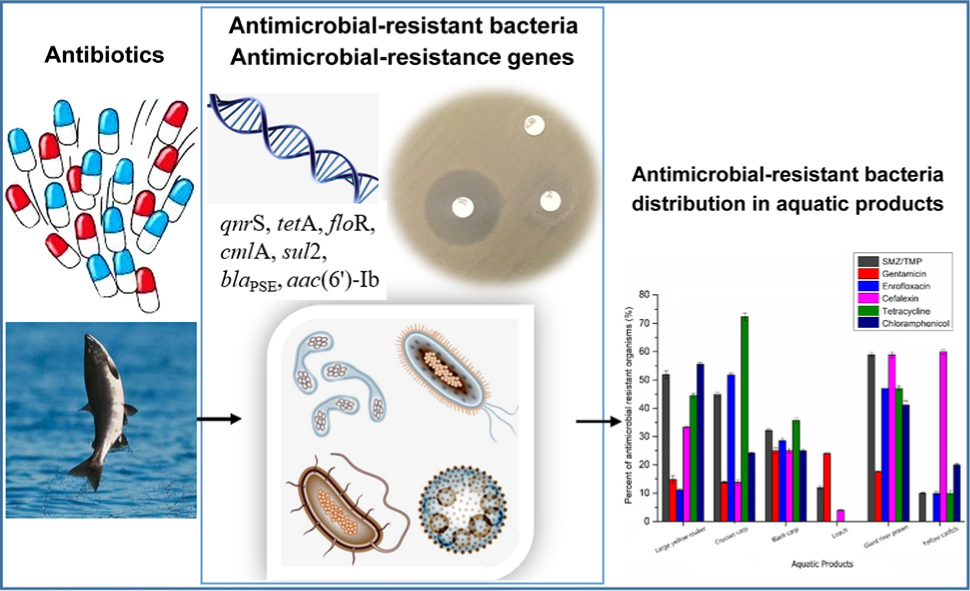
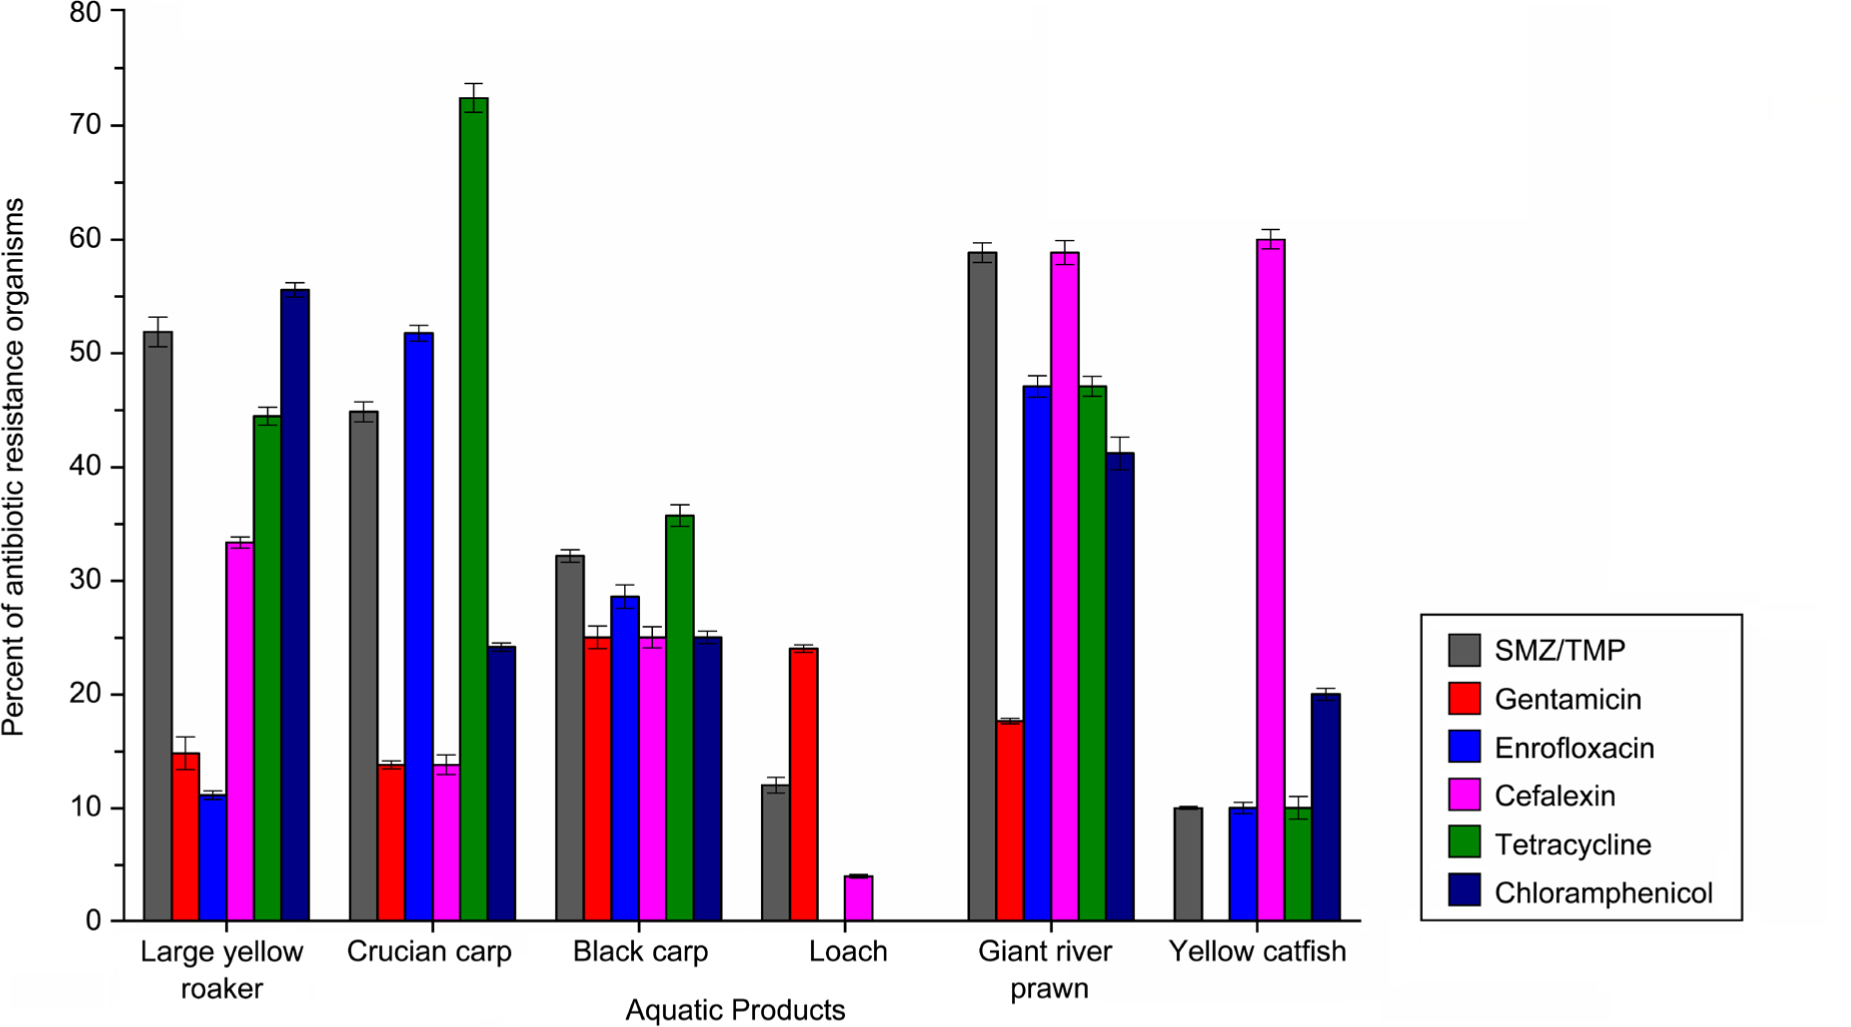
Fig. 1.
The resistance rates of the isolates originated from different aquatic products to the six tested antimicrobials.
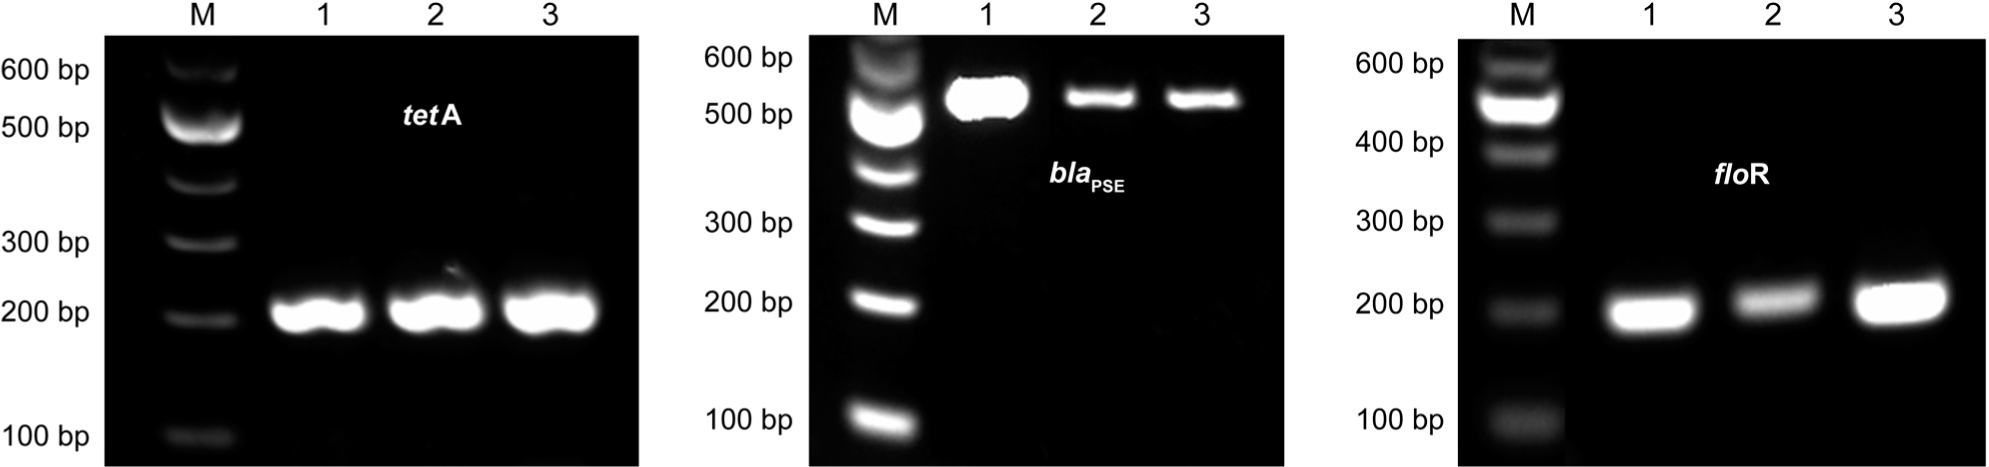
Fig. 2.
Amplicons of partial antimicrobial resistance genes.
Table I
The coincidence of the resistant phenotype and genotype among the isolates.
| Antimicrobial | No. of ARB isolates | ARGs | No. of the ARGs carrier | Coincidence rate (%) |
|---|---|---|---|---|
| Sulfadiazine | 50 | sul2 | 10 | 20% |
| Gentamicin | 24 | aac(6’)-Ib | 10 | 42% |
| Enrofloxacin | 35 | qnrS | 26 | 74% |
| Cephalexin | 37 | blaPSE | 12 | 32% |
| Tetracycline | 52 | tetA | 35 | 67% |
| Chloramphenicol | 38 | floR | 30 | 79% |
| cmlA | 30 | 79% |