
Fig. 1.
Fig. 2.
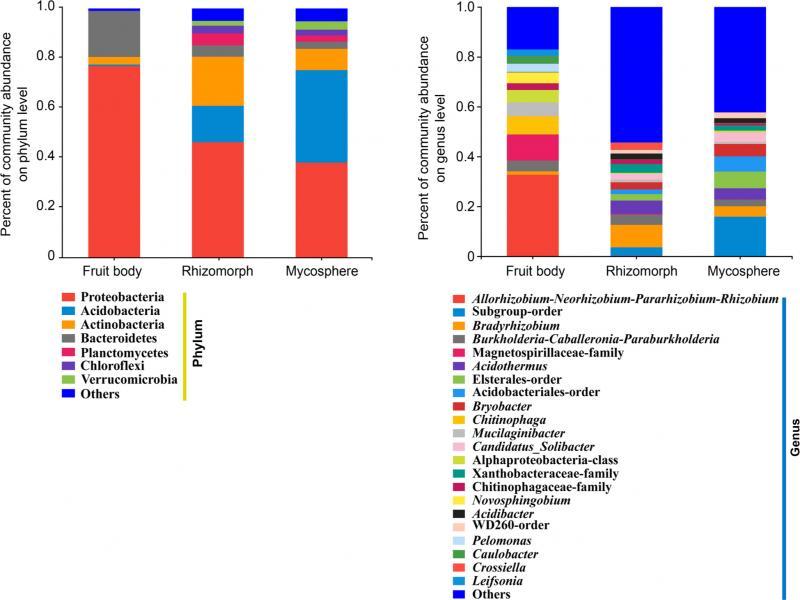
Fig. 3.
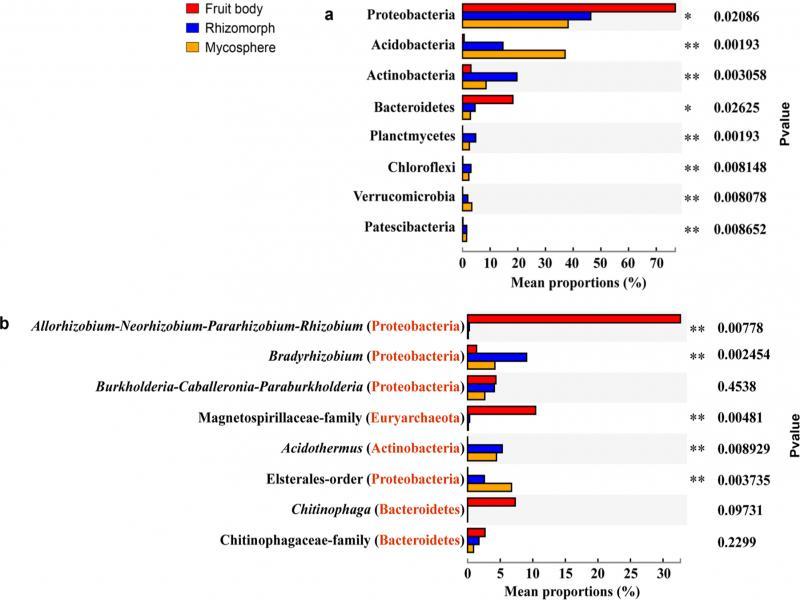
Fig. 4.
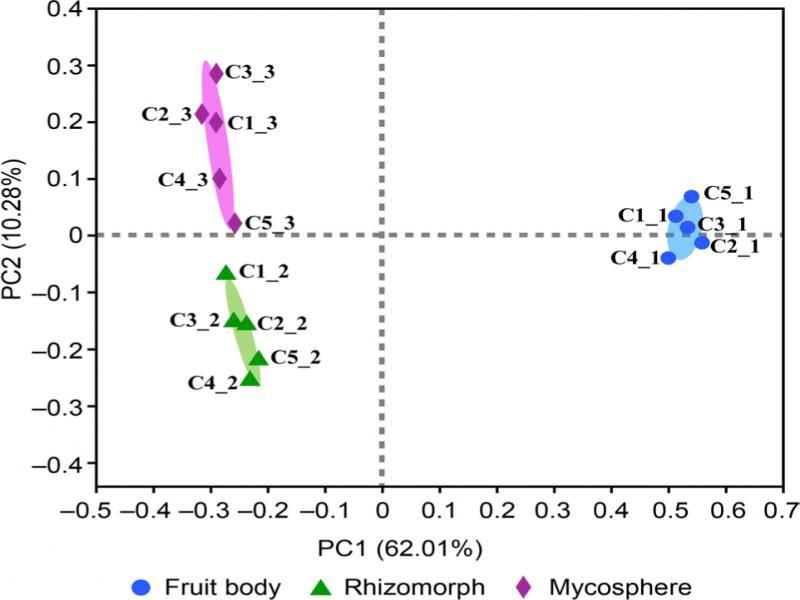
Fig. 5.
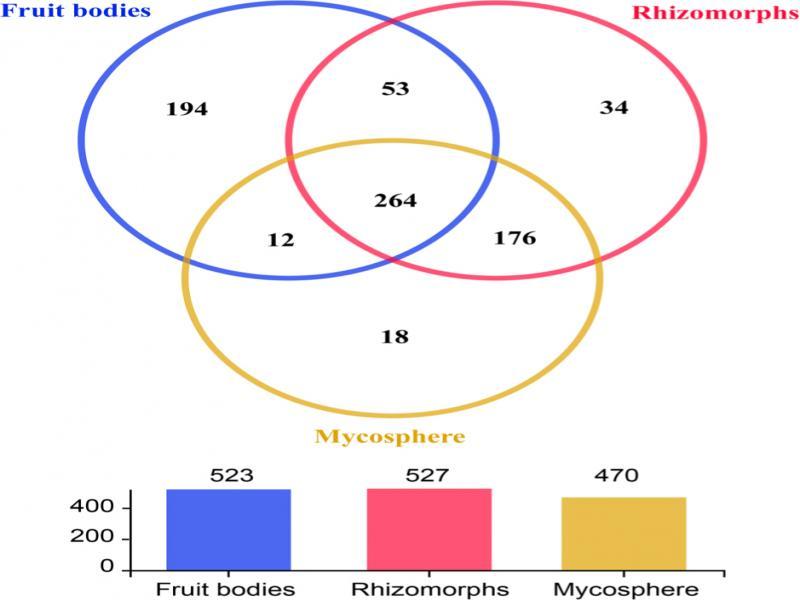
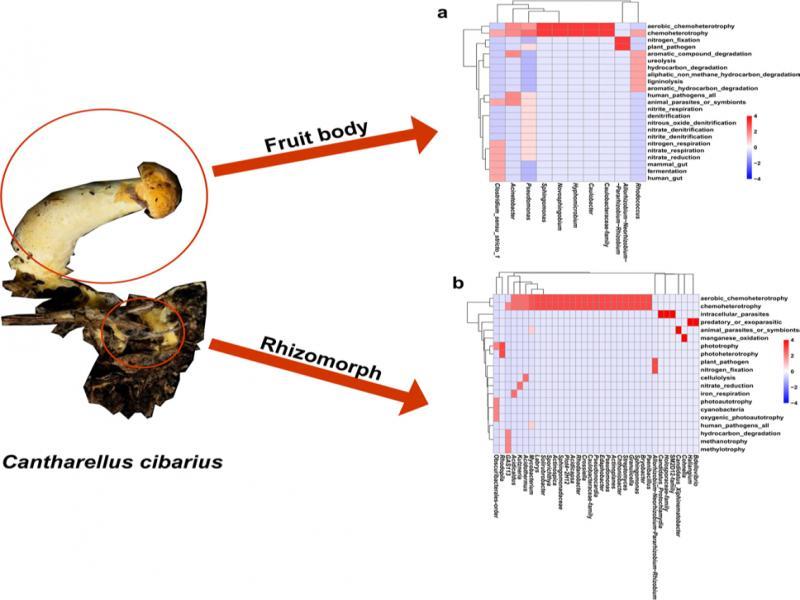
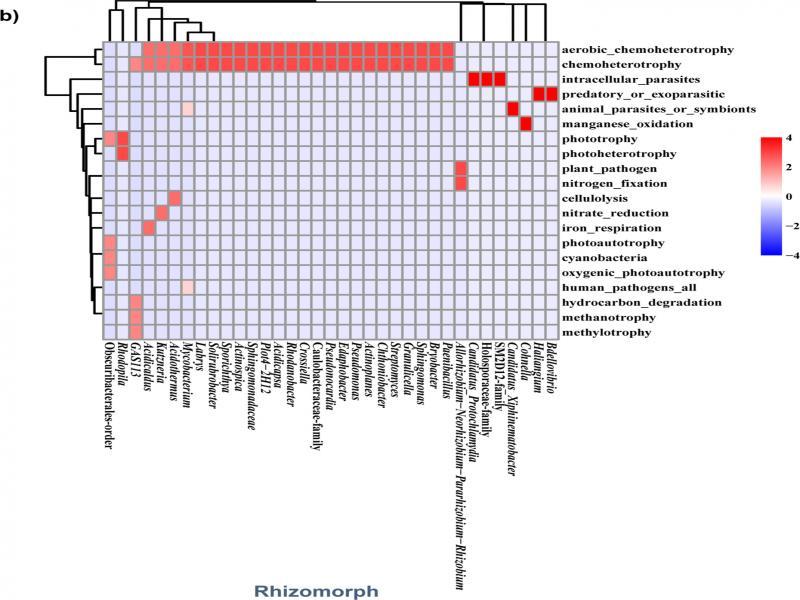
Fig. 6
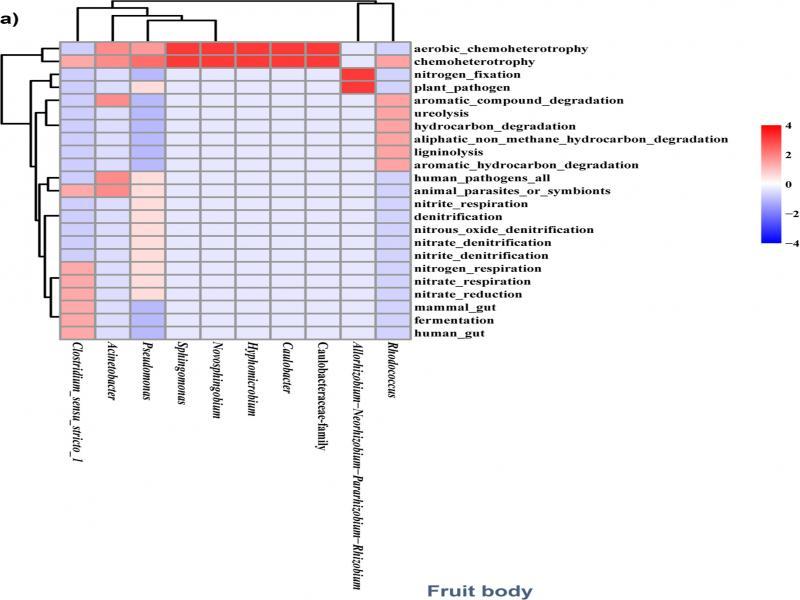
Fig. 6
Top five abundant genera in the fruit body, rhizomorph, and mycosphere of Cantharellus cibarius_
| Sample parts | Genus | Relative abundance (%) |
|---|---|---|
| Fruit body | Allorhizobium-Neorhizobium-Pararhizobium-Rhizobium | 32.68 |
| Magnetospirillaceae-family | 10.44 | |
| Chitinophaga | 7.31 | |
| Mucilaginibacter | 5.49 | |
| Bradyrhizobium | 1.37 | |
| Rhizomorph | Bradyrhizobium | 9.06 |
| Acidothermus | 5.32 | |
| Subgroup-order | 3.33 | |
| Elsterales-order | 2.57 | |
| Acidobacteriales-order | 1.88 | |
| Mycosphere | norank_o Subgroup | 15.78 |
| norank_o__Elsterales | 6.74 | |
| norank_o__Acidobacteriales | 6.11 | |
| Acidothermus | 4.43 | |
| Bradyrhizobium | 4.19 |