Introduction
Ectomycorrhizal fungi (EMF) are important participants in the nutrient cycling of forest ecosystems and play significant roles in enhancing water and nutrient absorption of plants. They promote the biogeochemical cycles of the chemical elements in the ecosystem (Calvaruso et al. 2007; Chen et al. 2009). EMF can be symbiotic with many plants, produce fruit bodies and rhizomorphs, and establish potential symbiotic relationships with the microbes in peripheral soils designated as “the mycosphere” (van Elsas and Boersma 2011; Haq et al. 2014; Liang et al. 2020). In this nested symbiosis model, bacteria on the surface of fungal hyphae can interact with host fungi and colonize mycelium and fruit body tissues, thus forming unique forms of symbiosis or metabolic complementarity. Fungi use endobacteria, which live in the fungal vegetative hyphae or reproductive structures, to make minerals weathered and obtain nutrients such as nitrogen and phosphorus from the soil to improve their adaptability and biomass (Barbieri et al. 2010; Fontaine et al. 2016; Salvioli et al. 2016; Pent et al. 2017). Simultaneously, the mycelium and fruit bodies of fungi can also provide different energy sources and habitats for bacteria to promote their growth (Schulz-Bohm et al. 2017). Mutualistic and antagonistic relationships between bacteria and fungi are prominent when adapting to environmental changes. Recognition of the role of the EMF and their related microbial community in the development of primordium and fruit bodies has resulted in the ecology of microbiota associated with mycorrhizal fungi, which has become a hot topic of research (Marupakula et al. 2015; Deveau et al. 2016; Pent et al. 2017).
Cantharellus cibarius Fr. is one of the six well-known edible fungi globally and is extremely valuable for both medicine and food. This fungus is ectomycorrhizal with economically valuable trees and plays a significant ecological role (Zhang et al. 2010). The unique evolutionary history and substantial economic value of C. cibarius have attracted considerable researchers to focus on its ecology, physiology, and phylogeny (Dunham et al. 2003; Kumari et al. 2013). In the last century, Straatsma et al. (1986a, 1986b) studied the role of carbon dioxide and carboxylated metabolic intermediates in the vegetative growth stage of C. cibarius. They found that hyphal fragments of C. cibarius grew strongly in a nutrient solution supplemented with malic acid, thymine, and Tween 80. The mixture of these three substances replaced CO2 or a living root as a growth factor. It is related to the fact that these factors promote hyphae growth by immobilization of CO2 into Krebs cycle intermediates and biosynthesis pathways of pyrimidines and fatty acids. Subsequently, Danell et al. (1993, 1994, 1997) discussed the influence of different factors on the fruit body differentiation of C. cibarius. They tried to explore the formation of fruit bodies and relate it with the effects of bacteria (Pseudomonas fluorescens) on mycorrhizal formation and mycorrhizal synthesis in vitro, although no obvious inducing factors were found. However, it also provides some valuable information for the artificial cultivation of C. cibarius, for example, the change of pH value controls the growth of mycelium and P. fluorescens, and enough hyphal biomass may form fruit bodies.
In recent years, rapid developments in high-throughput sequencing technology have facilitated analysis of the dynamics and diversity of bacteria related to C. cibarius. For example, Pent et al. (2017) compared and analyzed the diversity and structural composition of some EMF, including C. cibarius, by combining high-throughput sequencing with the assessment of the physical and chemical properties of the mycosphere. These authors suggested that the soil pH and host identity were the predominant factors affecting bacterial community composition. Pent et al. (2020) continued to merge high-throughput sequencing and chemical composition determination to compare and analyze the chemical content and bacterial community composition of the fruit bodies of EMF, including C. cibarius, and revealed that the differences in the chemical composition of fruit bodies also markedly impacted bacterial community composition. Recently, Gohar et al. (2020) analyzed bacterial community potential function variation at different development stages (young, middle-aged, and old) and in internal (cap, stipe lower internal, stipe middle internal) and external (gills, cap surface, stipe lower external, and stipe middle external) compartments of fruit bodies of C. cibarius, and compared the bacteria with that of other ectomycorrhizae. Their results demonstrated that bacterial community structure differed between internal and external parts of the fruit body but not between inner tissues. The structure of the bacterial communities showed significant variation across fruit body developmental stages. In addition, some functional groups, such as nitrogen fixation, persisted in fruit bodies during the maturation but were replaced by putative parasites/pathogens afterward.
However, despite these detailed studies, microbiota’s occurrence and interaction(s) with C. cibarius are still poorly understood. Basic information related to microbial communities and their functions in distinct ecological niches needs to be supplemented. The rapid development of bioinformatics and molecular ecology has expediated core microbiome research. The core microbiome, which is a critical component of the primary function of holobionts, is preserved, enriched, and inherited through natural selection during evolution and plays an essential ecological role in different environmental samples (Lemanceau et al. 2017). Core microbiome study has been employed in studying various samples, including plants (Dong et al. 2020), insects (Segata et al. 2016), soil (Mendes et al. 2013), and water (Ji et al. 2015), but it is scarce in the research field of C. cibarius and other EMF.
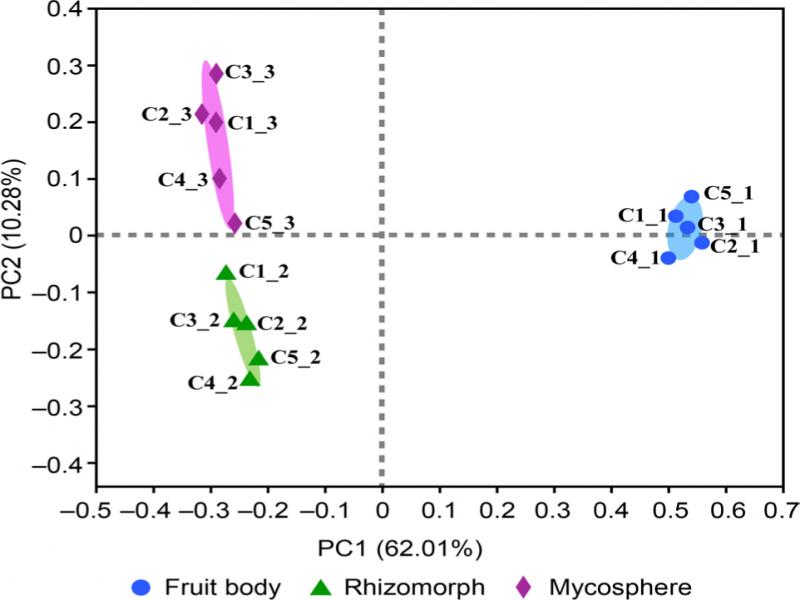
The current study used the high-throughput sequencing technology to reveal the bacterial community structure composition and dynamic changes in the fruit bodies and rhizomorphs parts of C. cibarius and mycosphere. It also compared their liquidity and correlation and further explored the potential function of core bacterial taxa of the fruit bodies and rhizomorphs. We hypothesized that (i) the structure of the rhizomorphs’ bacterial communities was similar to that of the mycosphere, but different from that of the fruit bodies; (ii) there are differences not only in composition but also in potential function between the core bacterial taxa of fruit bodies and rhizomorphs.
Experimental
Materials and Methods
Sample collection and processing. Five middle-aged C. cibarius were collected from Mount Yangchang, Yangchang Town (26°49′52″N, 106°87′56″E) in the Wudang District, Guiyang, Guizhou Province, China, in August 2019. The spacing of each sample was greater than 1 m to ensure that the samples collected were from a different host. With the fruit body as the center of the circle, the soil (10 cm in diameter and 5 cm in depth) was shoveled out with a sterile shovel to protect the samples of fruit body, the rhizomorph at the base of the fruit body, and the mycosphere. The samples were collected and rapidly transported to the laboratory in an ultra-clean box at 4°C for processing (Warmink and van Elsas 2008; Oh et al. 2016). While wearing sterile gloves, the connection between the cap and stipe of the fruit body was separated with a sterile scalpel. The cap was divided into two halves by the hands, and ~ 2 g internal tissues (unexposed and untouched part of the sterile scalpel) were picked out with sterile inoculation needles for each fruit body. Rhizomorph was the threadlike or cordlike structure in fungi made up of parallel hyphae, branched tubular filaments (Townsend 1954). Mycosphere was obtained by finding the rhizomorph, holding the stipe, slowly moving out the rhizomorph attached soil, and gently shaking the soil attached to the surface of the rhizomorphs. Then residual soil on the rhizomorphs was removed with a sterile inoculation needle (Warmink and van Elsas 2008). 2 g of mycosphere soil corresponding to each fruit body sample was collected. Rhizomorphs with the soil removed were sterilized under UV light for 5 min after disinfection with 75% alcohol for 30 seconds, and 2 g was harvested for each sample. All samples were processed and placed in a sterile centrifuge tube for the subsequent DNA extraction.
DNA extraction and PCR amplification. Total genomic DNA was extracted from fruit bodies and rhizomorphs of C. cibarius, as well as mycosphere soil samples using the E.Z.N.A.® soil DNA Kit (Omega Bio-Tek, Norcross, GA, USA), according to the manufacturer’s protocols. DNA concentration and purity were determined with a NanoDrop 2000 UV-Vis spectrophotometer (Thermo Scientific, Wilmington, USA). Variable V3-V4 regions of the 16S rRNA gene were amplified using the bacterial primers 338F (5’-ACTC-CTACGGGAGGCAGCAG-3’) and 806R (5’-GGAC-TACHVGGGTWTCTAAT-3’) in the GeneAmp 9700 PCR system (ABI, USA). The PCR program comprised an initial denaturation step at 95°C for 3 min, 27 cycles of 30 s at 95°C, 30 s for annealing at 55°C, and 45 s elongation at 72°C, followed by a final extension at 72°C for 10 min and then storing at 4°C. PCR reactions were performed in triplicate in a 20 µl mixture containing 4 µl of 5 × TransStart FastPfu Buffer, 2 µl of 2.5 mM dNTPs, 0.8 µl of each primer (5 µM), 0.4 µl of TransStart FastPfu Polymerase, and 10 ng of template DNA. There were three replicates per sample (Dong et al. 2020).
Illumina Miseq sequencing. PCR products were extracted from a 2% agarose gel, further purified using an AxyPrep DNA Gel Extraction Kit (Axygen Biosciences, Union City, CA, USA), and quantified using a QuantiTM Fluorometer (Promega, USA), according to the manufacturer’s protocol. A NEXTFLEX®Rapid DNA-Seq Kit was used to build the library via the following steps: (1) joint link; (2) screening with magnetic beads and removal of joint self-continuous segments; (3) enrichment of library templates via PCR amplification; (4) recovery of PCR products from magnetic beads to obtain the final library. Purified amplicons were sequenced by Majorbio Bio-Pharm Technology Co. Ltd. (Shanghai, China) on an Illumina MiSeq PE300 platform (Illumina, San Diego, USA), according to the standard protocols. Sequences obtained from all samples were submitted to the Sequence Read Archive (SRA) and are available under BioProject PRJNA670583 (BioSample accession numbers SAMN16515864).
Statistics and analysis of sequencing data. Raw data files were quality-filtered by fastp (https://github.com/OpenGene/fastp, version 0.20.0) (Chen et al. 2018) and merged by FLASH (http://www.cbcb.umd.edu/software/flash, version 1.2.7) with the following criteria (Magoc et al. 2011): (1) reads were truncated at any site receiving an average quality score < 20 over a 50-bp sliding window; (2) according to the overlap relation between PE reads, pairs of reads were merged into a sequence with a minimum overlap length of 10 bp; (3) the maximum mismatch ratio allowed in the overlap region of the merged sequence was 0.2, and the non-conforming sequence was screened; (4) according to barcodes and primers at the beginning and end of the sequence, the samples were distinguished, and the sequence direction was adjusted. The allowable mismatch number of barcodes was 0, and the maximum primer mismatch number was 2.
Sequences with ≥ 97% similarity were assigned to the same operational taxonomic units (OTUs), and the chimeras were filtered using UPARSE (http://drive5.com/uparse/ version 7.1) (Stackebrandt and Goebel 1994; Edgar 2013). OTUs were classified and annotated by the RDP classifier (http://rdp.cme.msu.edu, version 2.2), and compared with the SILVA 16S rRNA database (v138), setting the comparison threshold at 70% (Wang et al. 2007).
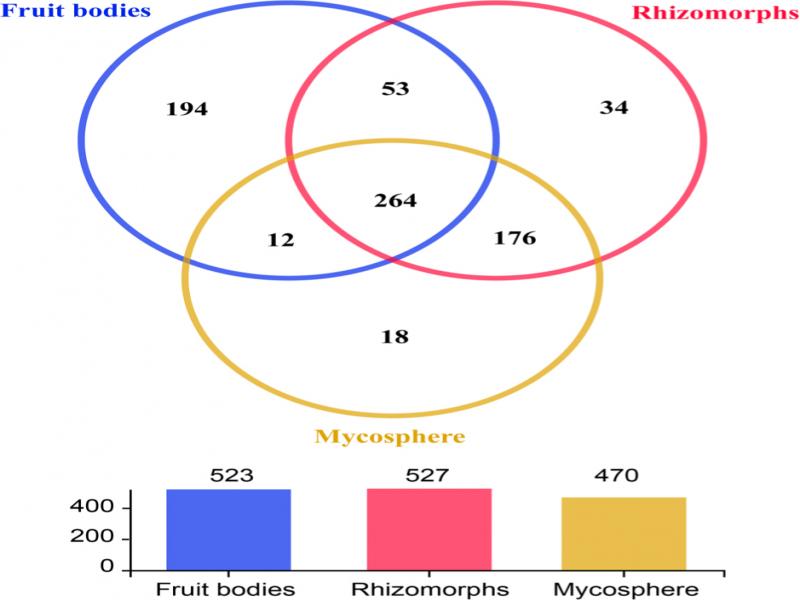
Alpha-diversity analyses, including community diversity parameters (Shannon), community richness (ACE), and a sequencing depth index (Shannon), were calculated using the mothur software (Schloss et al. 2011). Beta-diversity measurements, including microbiota trees, were calculated as previously described (Jiang et al. 2013), and principal coordinate analyses (PCoA) based on OTU compositions were determined. Bacterial taxonomic distributions of sample communities were visualized using R package software. A Venn diagram was implemented using the R package to show unique and shared OTUs. The stats package in R (3.5.0) was used for the clustering calculations and data normalization in the heatmap, and the heatmap package in R was used to generate the heatmap. Differences between populations were analyzed using a Kruskal-Wallis H test, and p ≤ 0.05 was considered statistically significant.
Correlation analysis of bacterial core taxa and FAPROTAX function prediction. MetaCoMET (http://probes.pw.usda.gov/MetaCoMET) was used to define the core microbiome and obtain the visual results (Wang et al. 2016). The raw bacterial dataset of C. cibarius was adjusted to a tab-delimited text file, which contained the OTU classification information and relative abundance values for each sample. Qiime 2.0 was used to convert the text format into the biom format data file matching MetaCoMET. According to the analysis method defined by the membership, the analysis parameters were set on the MetaCoMET platform and submitted to the network platform to obtain the results (Dong et al. 2019).
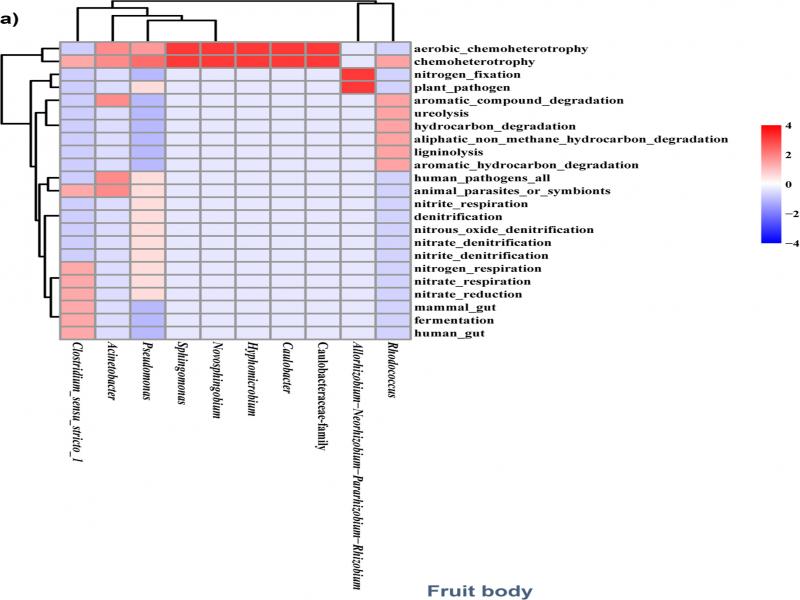
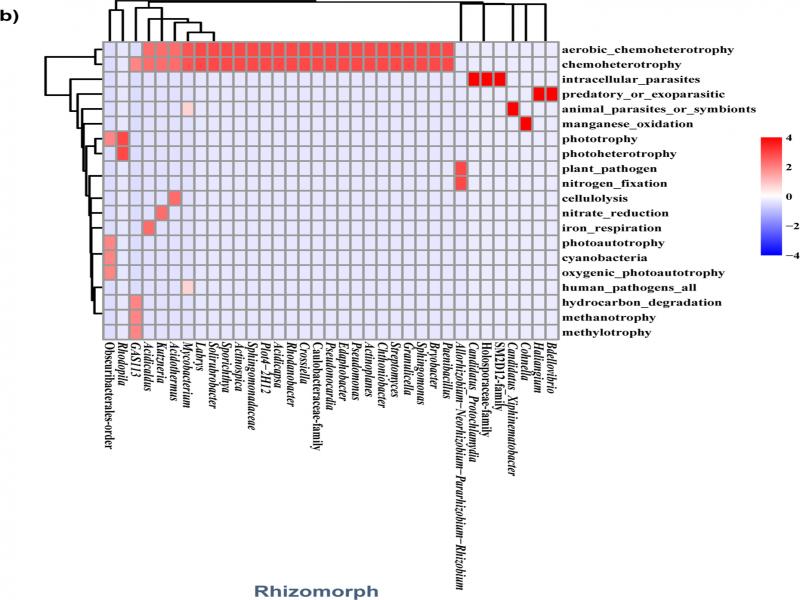
FAPROTAX is a database based on the current manual collection of cultivable bacteria, and contains more than 7,600 functional annotations collected from many prokaryotic microbiomes (Louca et al. 2016). In this study, FAPROTAX (http://www.ehbio.com/ImageGP/index.php/Home/Index/FAPROTAX.html) was used to predict the function of the core bacterial taxa that existed in fruit bodies and rhizomorphs, respectively, and the differences between the functional groups were compared and analyzed.
Results
Bacterial alpha-diversity of fruit bodies, rhizomorphs, and mycosphere. Among the 15 samples obtained from the fruit bodies, rhizomorphs, and mycosphere, a total of 860,689 sequences were detected by 16S rRNA gene amplicon sequencing; the sequence range for each sample was 35,483–74,379, with an average length of 408.85–414.07 bp. Rarefaction curves of the Shannon index indicated that the sequencing data depth in this experiment could comprehensively reflect the microbial information because the number of sample sequences increased and the curve gradually flattened out (Fig. S1) (Mao et al. 2015).
After strict quality filtering, resulting sequences were gathered into OTUs with a similarity ≥ 97%. A total of 3,628 OTUs were detected, belonging to 43 phyla, 98 classes, 243 orders, 427 families, 751 genera, and 1,396 species, and the alpha diversity indexes are shown in Fig. 1. Shannon index values were positively correlated with diversity (Dong et al. 2020). Shannon (Fig. 1a) indexes showed that the bacterial diversity of both rhizomorphs and mycosphere samples was significantly greater than that of fruit bodies (p < 0.05), but the diversity of rhizomorphs was similar to that of mycosphere samples (p < 0.05). The Ace (Fig. 1b) indexes both indicated that the bacterial richness of rhizomorphs and mycosphere samples were significantly higher than that of fruit bodies (p < 0.05). In contrast, the richness in rhizomorphs and mycosphere samples was similar (p < 0.05).
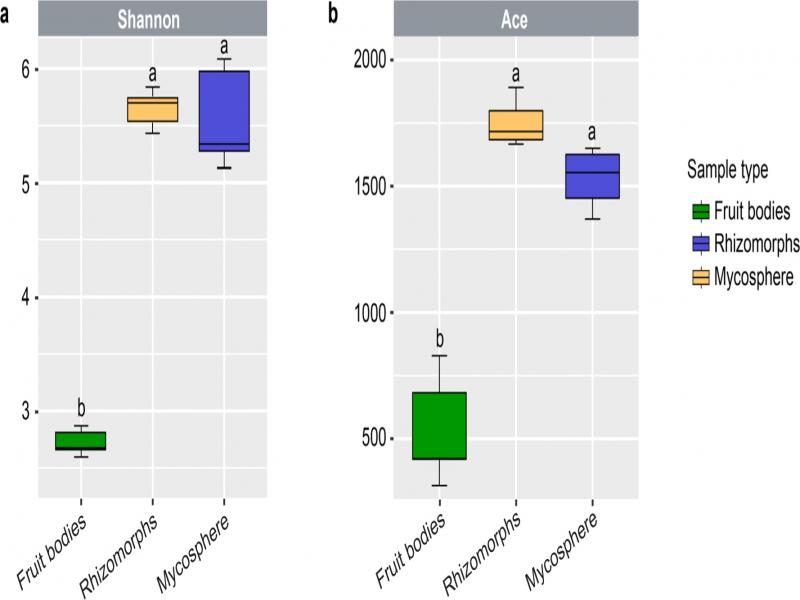
Fig. 1.
Alpha-diversity comparison among the fruit bodies, rhizomorphs of Cantharellus cibarius, and mycosphere samples based on a) the Shannon and b) Ace indexes using the 16S rRNA gene amplicons sequencing data. Samples with the same letter do not differ significantly by Tukey’s test at p > 0.05; samples with different letters are significantly different by Tukey’s test at p < 0.05. The center value of each sample represents the median for the different indexes.
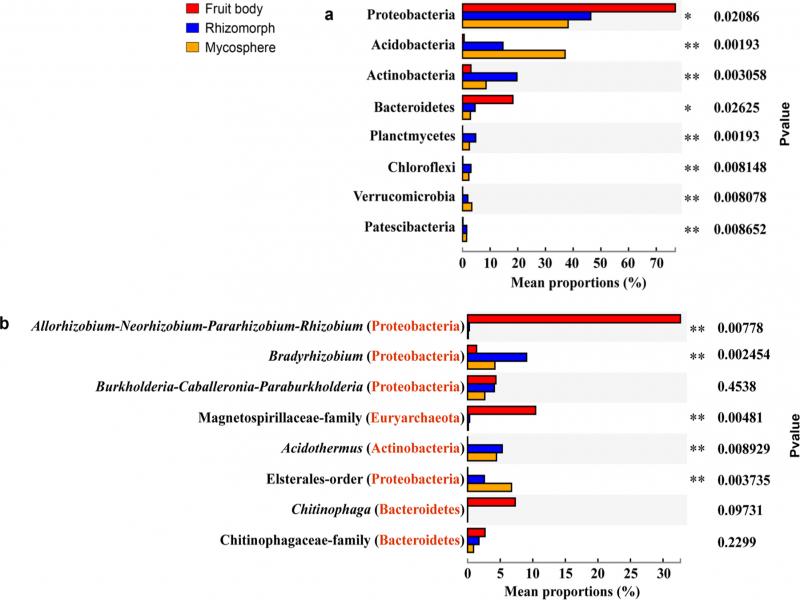
Bacterial taxonomic composition of fruit bodies, rhizomorphs, and mycosphere. Forty-three prokaryotic phyla were identified from the 16S rRNA gene amplicon sequences (Fig. 2a). Proteobacteria was the dominant phylum with the highest abundance in all three sampled parts of C. cibarius, and the proportion of Proteobacteria in the fruit bodies was as high as 76.89%. In addition, the abundance of Bacteroidetes in the fruit bodies was higher than in rhizomorphs and mycosphere soil. At the same time, Acidobacteria and Actinobacteria were predominantly concentrated in the rhizomorphs and the mycosphere.
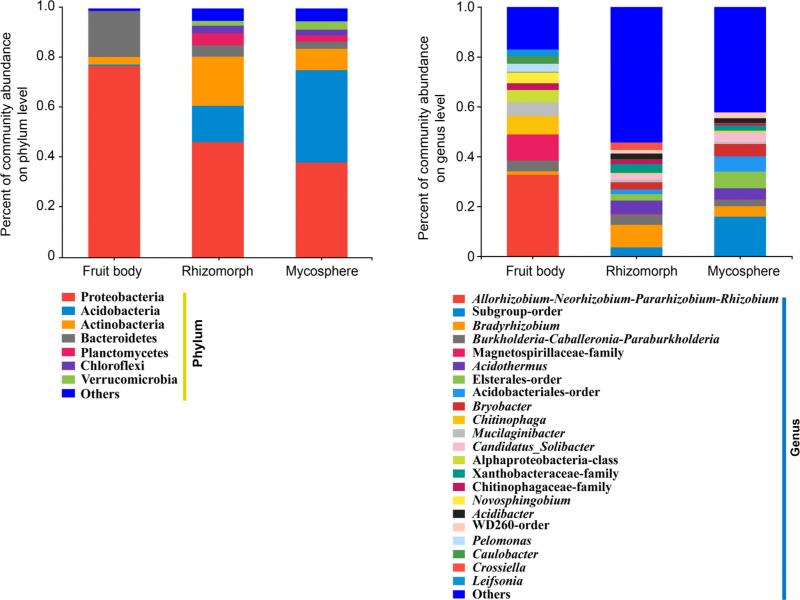
Fig. 2.
Bacterial communities of Cantharellus cibarius at a) the phylum and b) genus levels. Others represent all phyla or genera with less than 2% abundance. Each part was an average of five replicates.
At the genus level, the detected OTUs were distributed among 751 different bacterial genera in total (Fig. 2b). The top five abundant genera in each of the three sampled parts of C. cibarius are listed in Table I. The dominant genera of rhizomorph and mycosphere were similar but different from those of fruit body. It means that the dominant genera of bacteria are significantly different among the fruit body, the rhizomorph, and the mycosphere, and the relative abundance of the same taxa is also different between the rhizomorph and the mycosphere.
Table I
Top five abundant genera in the fruit body, rhizomorph, and mycosphere of Cantharellus cibarius.
| Sample parts | Genus | Relative abundance (%) |
|---|---|---|
| Fruit body | Allorhizobium-Neorhizobium-Pararhizobium-Rhizobium | 32.68 |
| Magnetospirillaceae-family | 10.44 | |
| Chitinophaga | 7.31 | |
| Mucilaginibacter | 5.49 | |
| Bradyrhizobium | 1.37 | |
| Rhizomorph | Bradyrhizobium | 9.06 |
| Acidothermus | 5.32 | |
| Subgroup-order | 3.33 | |
| Elsterales-order | 2.57 | |
| Acidobacteriales-order | 1.88 | |
| Mycosphere | norank_o Subgroup | 15.78 |
| norank_o__Elsterales | 6.74 | |
| norank_o__Acidobacteriales | 6.11 | |
| Acidothermus | 4.43 | |
| Bradyrhizobium | 4.19 |