
Fig. 1.
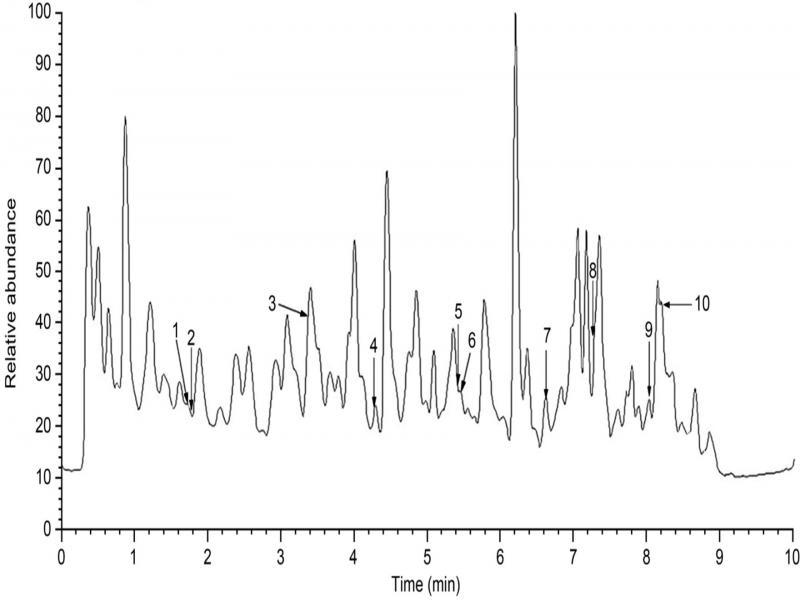
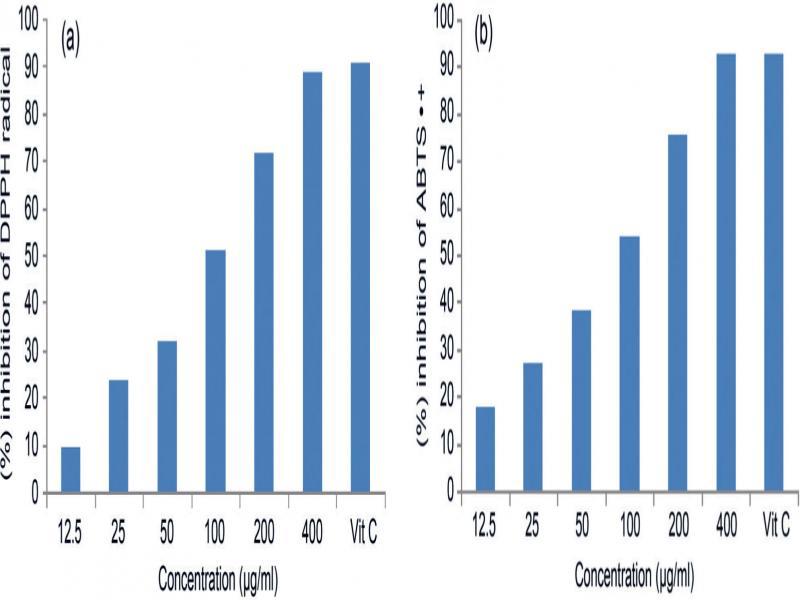
Fig. 2.
Metabolites of Aspergillus creber as determined by UHPLC-MS/MS_ The metabolites were tentatively identified using molecular mass data, MS/MS analysis and references_
| Peak No. | Putative compound name | Adduction | Measured mass (m/z) | Productions (m/z) | tRa (min) | Refb |
|---|---|---|---|---|---|---|
| 1 | Asperlactone | [M+H] + | 185.08081 | 141.05444, 113.05948 | 1.73 | Vishwanath et al. 2009 |
| 2 | NI | [M+Na] + | 211.06121 | 195.03455, 133.02816 | 1.78 | - |
| 3 | NI | [M+H] + | 308.10992 | 280.95587, 145.10104 | 3.38 | - |
| 4 | NI | [M+H] + | 327.04734 | 309.18594, 191.15396 | 4.28 | - |
| 5 | Emodin | [M+H]- | 269.04590 | ND | 5.42 | Sulyok et al. 2007; Lehner et al. 2011; Micheluz et al. 2016 |
| 6 | NI | [M+H]+ | 251.09145 | 233.09526, 204.09319 | 5.49 | - |
| 7 | Sterigmatocystin | [M+H]+ | 325.07053 | ND | 6.62 | Lehner et al. 2011; Micheluz et al. 2016 |
| 8 | NI | [M+Na] + | 423.25041 | 405.27911, 239.14821 | 7.27 | - |
| 9 | Deoxybrevianamide E | [M+H]+ | 352.20352 | ND | 8.04 | Lehner et al. 2011; Micheluz et al. 2016 |
| 10 | Norsolorinic acid | [M+H]- | 369.09892 | ND | 8.24 | Micheluz et al. 2016 |
Antimicrobial activity and minimum inhibitory concentration (MIC) of ethyl acetate extract of Aspergillus creber against human pathogens_
| Zone of inhibition (mm)a | MIC of ethyl acetate extract (mg/ml) | ||
|---|---|---|---|
| Ethyl acetate extract | Positive controlb | ||
| Bacteria | |||
| Escherichia coli | 0 | 23.4 ± 0.3 | - |
| Klebsiella pneumoniae | 10.0 ± 0.3 | 25.0 ± 0.4 | 2.5 |
| Pseudomonas aeruginosa | 0 | 20.8 ± 0.4 | - |
| Salmonella Typhi | 8.5 ± 0.6 | 21.5 ± 0.3 | 5 |
| SABLc | 12.8 ± 0.3 | 19.8 ± 0.2 | 0.625 |
| MRSEd | 14.0 ± 0.2 | 19.2 ± 0.2 | 0.625 |
| Yeasts | |||
| Candida albicans | 20.6 ± 0.8 | 22.8 ± 0.4 | 0.325 |
| Candida glabrata | 13.0 ± 0.3 | 25.7 ± 0.5 | 1.25 |
Antioxidant activities of Aspergillus creber ethyl acetate extract by DPPH and ABTS assays and its total phenolic content_
| Activity | Extract | Ascorbic acida |
|---|---|---|
| DPPHa | 89.28 ± 0.32 | 91.39 ± 0.39 |
| ABTSa | 92.93 ± 0.30 | 93.03 ± 0.45 |
| Total phenolic content (mg GAE/g) | 85.76 ± 0.96 | - |