
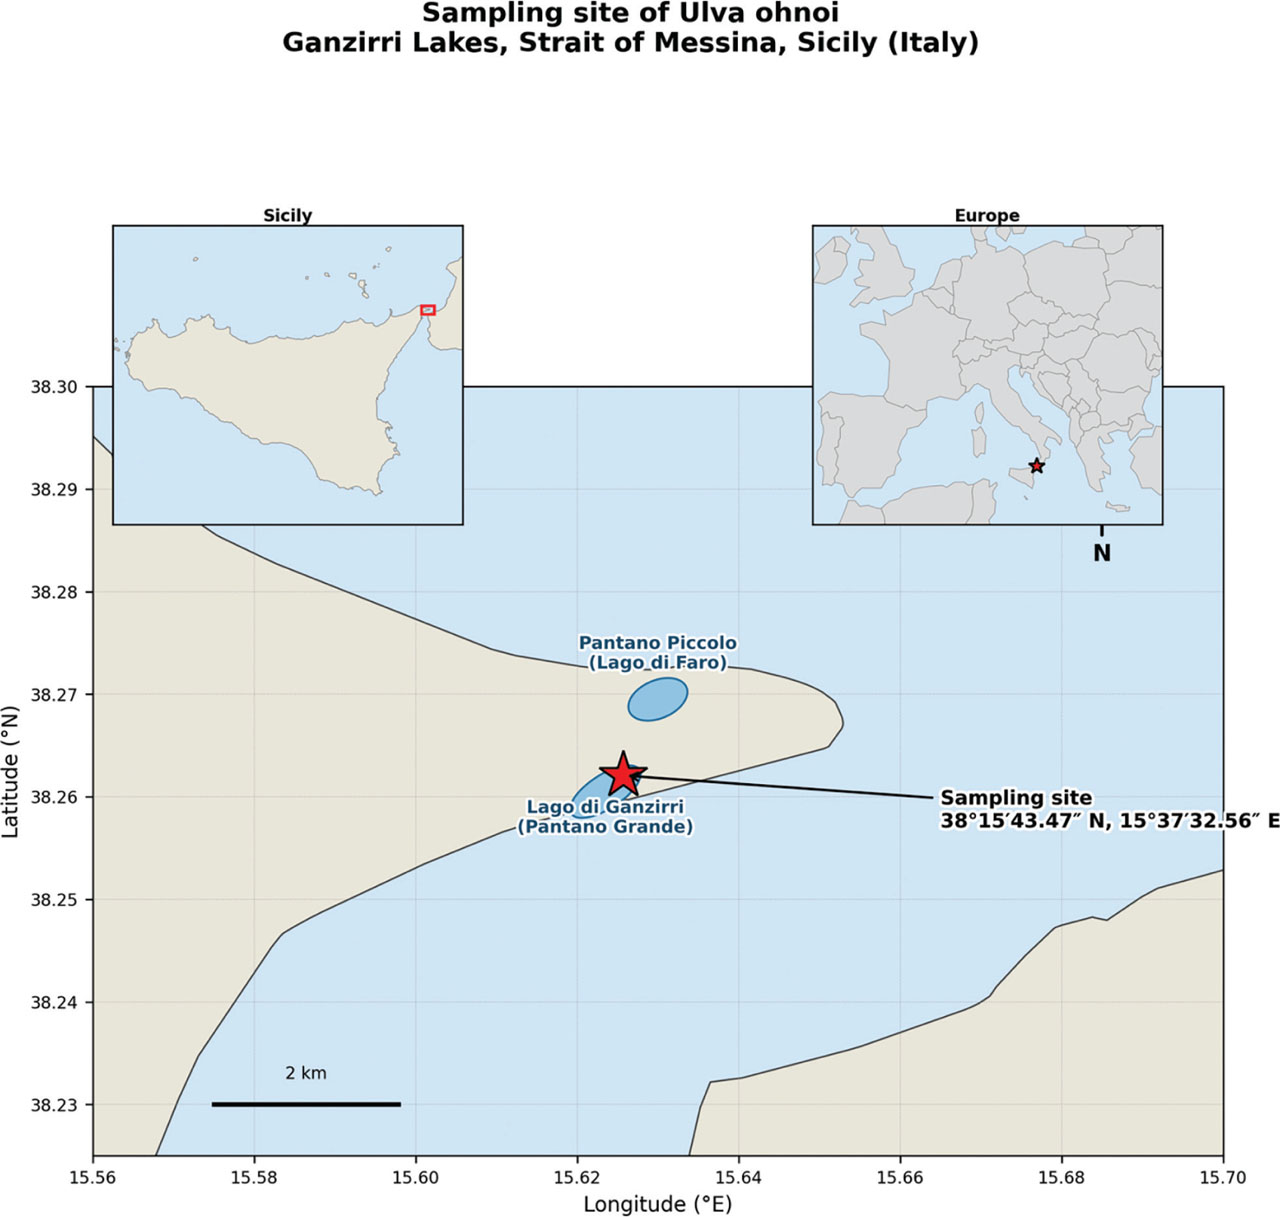
Figure 1
Map showing the location of the sampling site in the Ganzirri Lakes (Strait of Messina, north-eastern Sicily, Italy; (38°15′43.47″ N, 15°37′32.56″ E), where U. ohnoi biomass was collected. The inset map shows the position of the study area within the broader context of Italy and the central Mediterranean.
Table 1
Physicochemical parameters of the water column.
| Parameter | Value | Unit |
|---|---|---|
| Temperature | 18.5 | °C |
| Salinity | 35.0 | PSU |
| pH | 8.1 | - |
| Dissolved oxygen | 6.2 | mg · L−1 |
| Nitrate ( ) | <0.5 | µg · L−1 |
| Phosphate ( ) | <0.05 | µg · L−1 |
| Cadmium (Cd) | <0.005 | µg · L−1 |
| Lead (Pb) | <0.01 | µg · L−1 |
| Copper (Cu) | <0.02 | µg · L−1 |
| Nickel (Ni) | <0.02 | µg · L−1 |
Table 2
Quantitative composition of lipophilic extracts (milligrams per gram of extract, mean ± SD, n = 3).
| Metabolite | n-hexane extract | Ethyl acetate extract |
|---|---|---|
| Saturated fatty acids (stearic acid eq.) | 279.77 ± 13.99 | 270.81 ± 13.54 |
| Monounsaturated fatty acids (oleic acid eq.) | 24.94 ± 1.25 | 41.41 ± 2.07 |
| PUFAs ω6 (linoleic acid eq.) | 0.67 ± 0.03 | 8.33 ± 0.42 |
| PUFAs ω3 (linolenic acid eq.) | 1.96 ± 0.10 | 13.82 ± 0.69 |
| Triglycerides | 8.62 ± 0.43 | 3.18 ± 0.16 |
| Phospholipids | 0.038 ± 0.002 | 0.11 ± 0.01 |
| Carotenoids | 14.15 ± 0.71 | 14.12 ± 0.71 |
| Liposoluble phenols | 0.78 ± 0.04 | 0.25 ± 0.01 |
| Aldehydes (acetaldehyde eq.) | 2.42 ± 0.12 | 0.06 ± 0.003 |
| Campesterol | 0.034 ± 0.002 | 0.40 ± 0.02 |
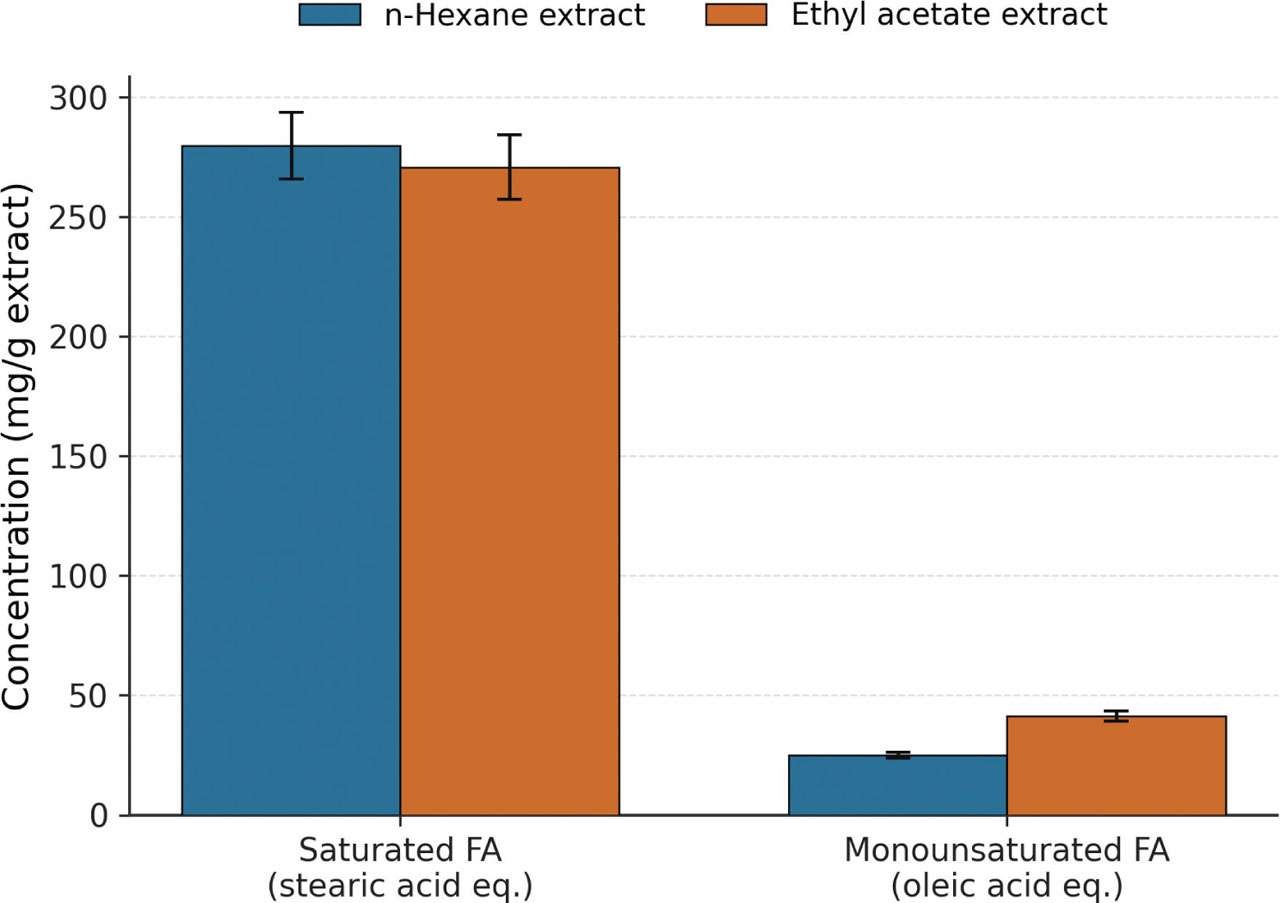
Figure 2
Quantification of lipophilic extracts (n-hexane and ethyl acetate). Saturated fatty acids (stearic acid equivalent) and monounsaturated fatty acids (oleic acid equivalent), expressed in milligrams per gram.
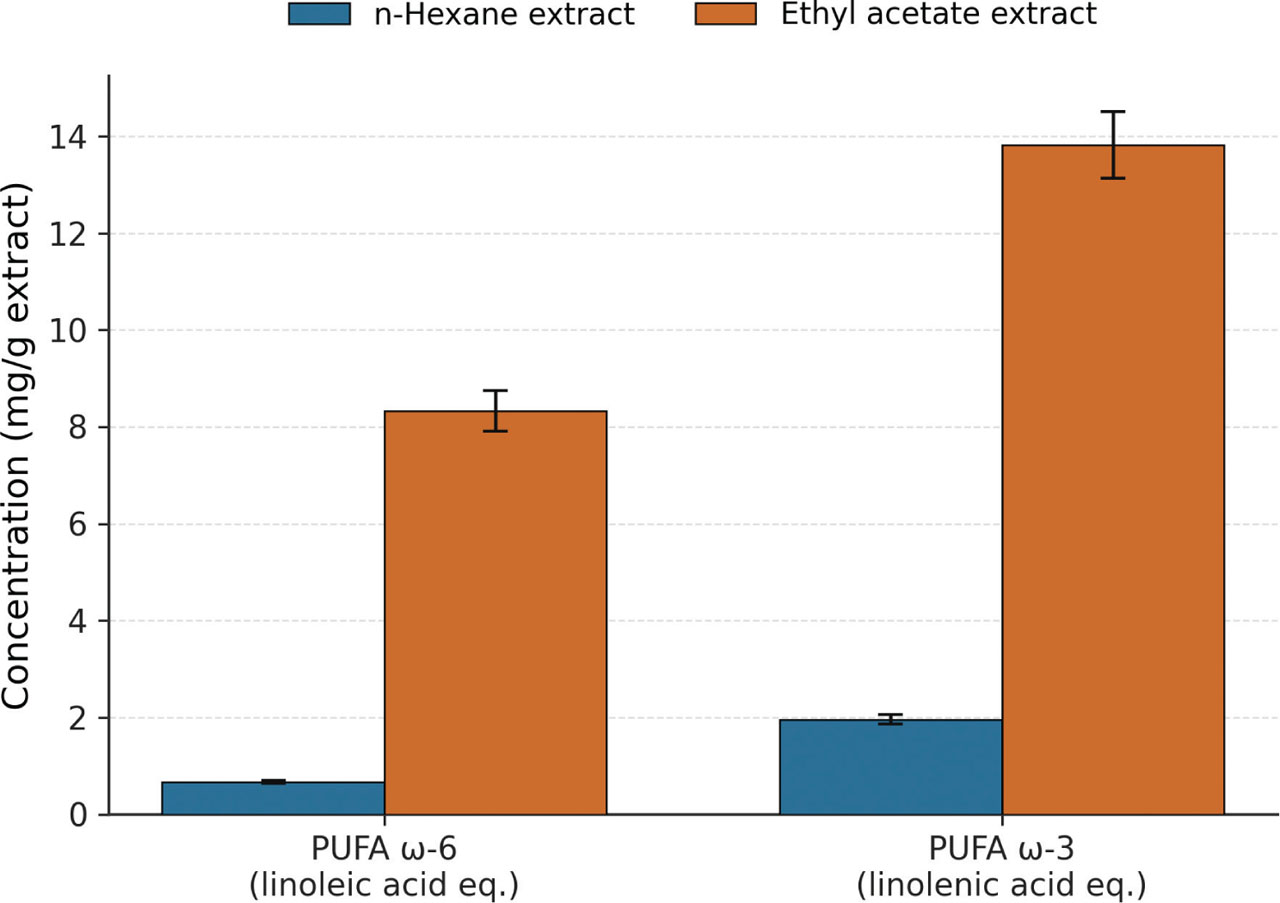
Figure 3
Quantification of lipophilic extracts (n-hexane and ethyl acetate). PUFA ω-6 (linoleic acid equivalent) and PUFAs ω-3 (linolenic acid equivalent) expressed in milligrams per gram. PUFAs, polyunsaturated fatty acids.
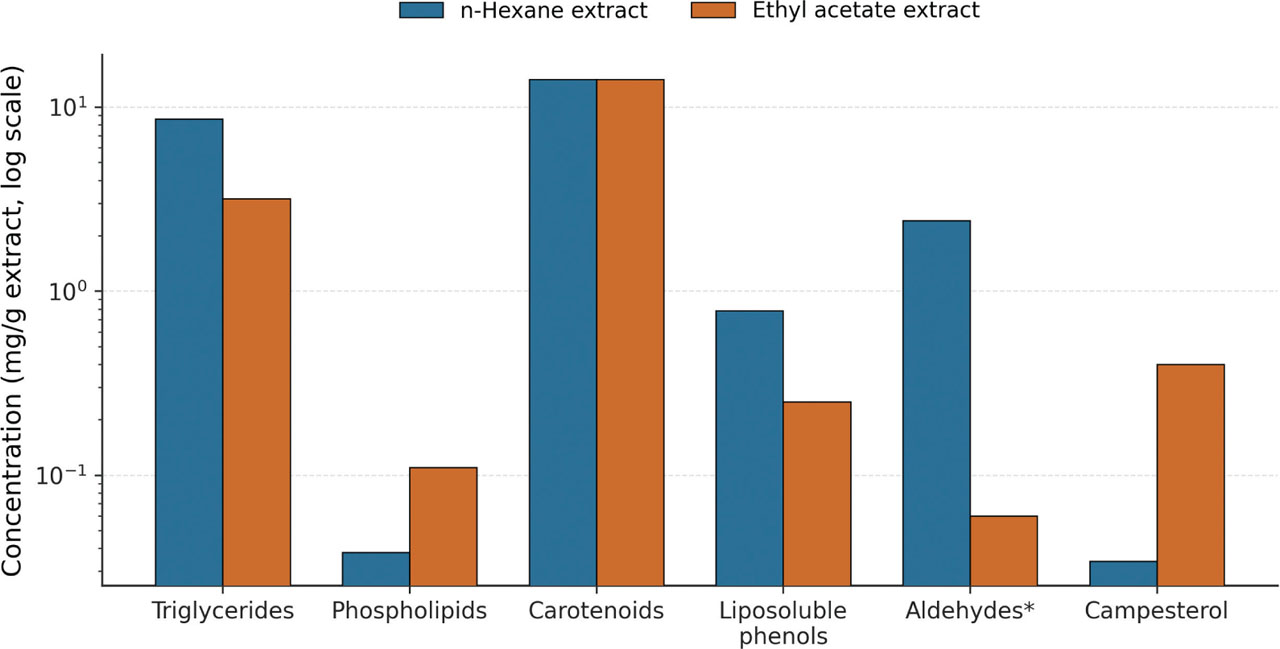
Figure 4
Quantification of lipophilic extracts (n-hexane and ethyl acetate). Triglycerides, carotenoids, aldehydes (acetaldehyde equivalent), phospholipids, liposoluble phenols, and campesterol, expressed in milligrams per gram.
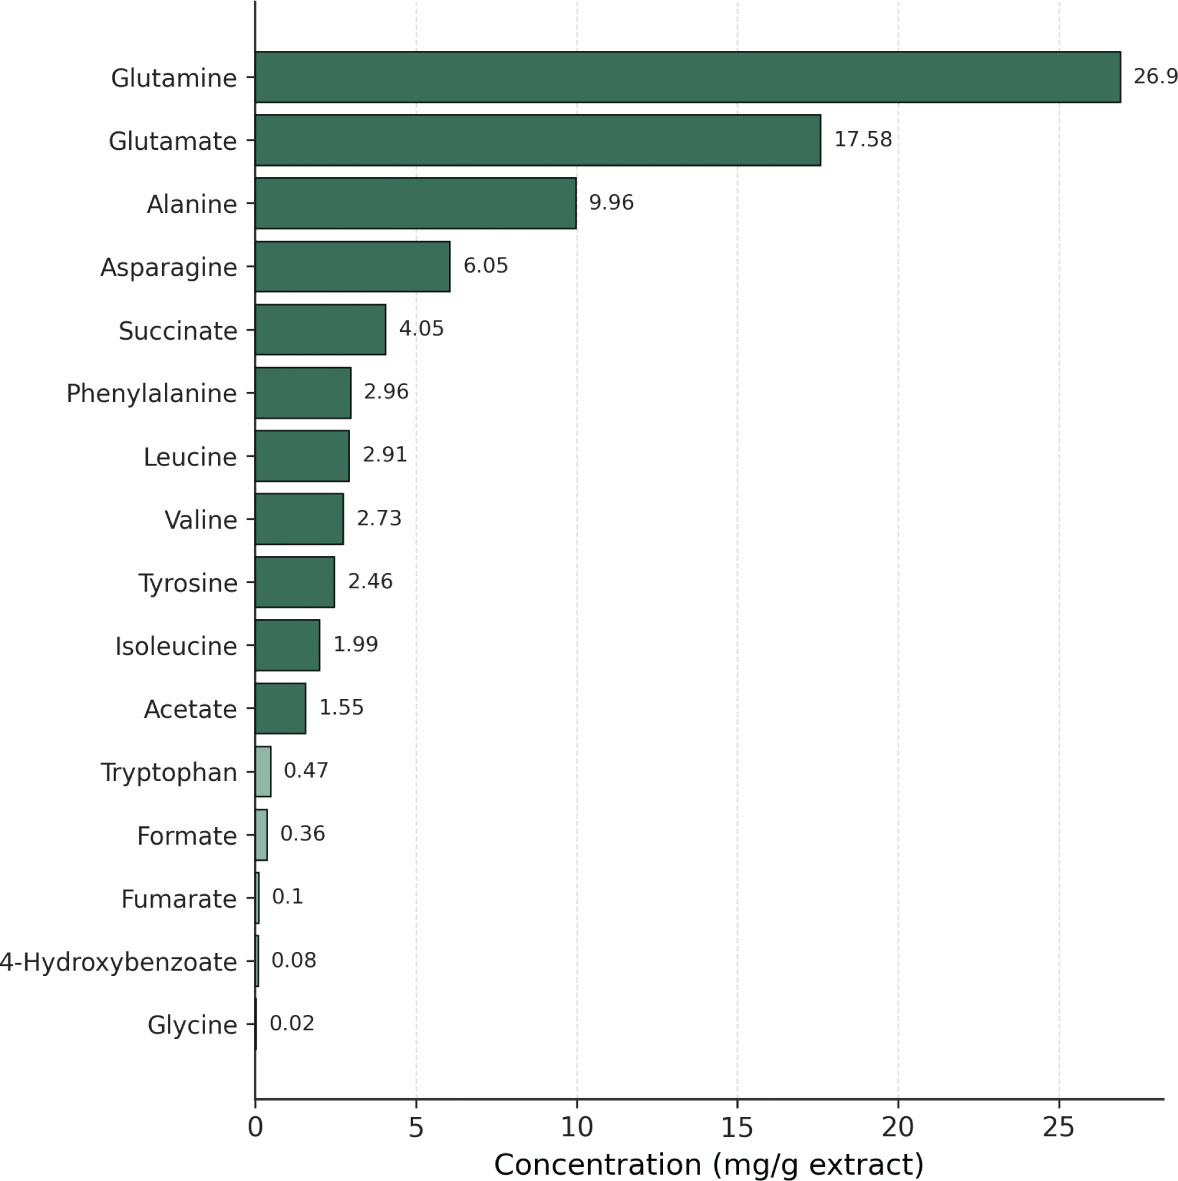
Figure 5
Concentration of amino acids, organic acids, and a simple phenolic compound in the hydroalcoholic extract of U. ohnoi, expressed in milligrams per gram.
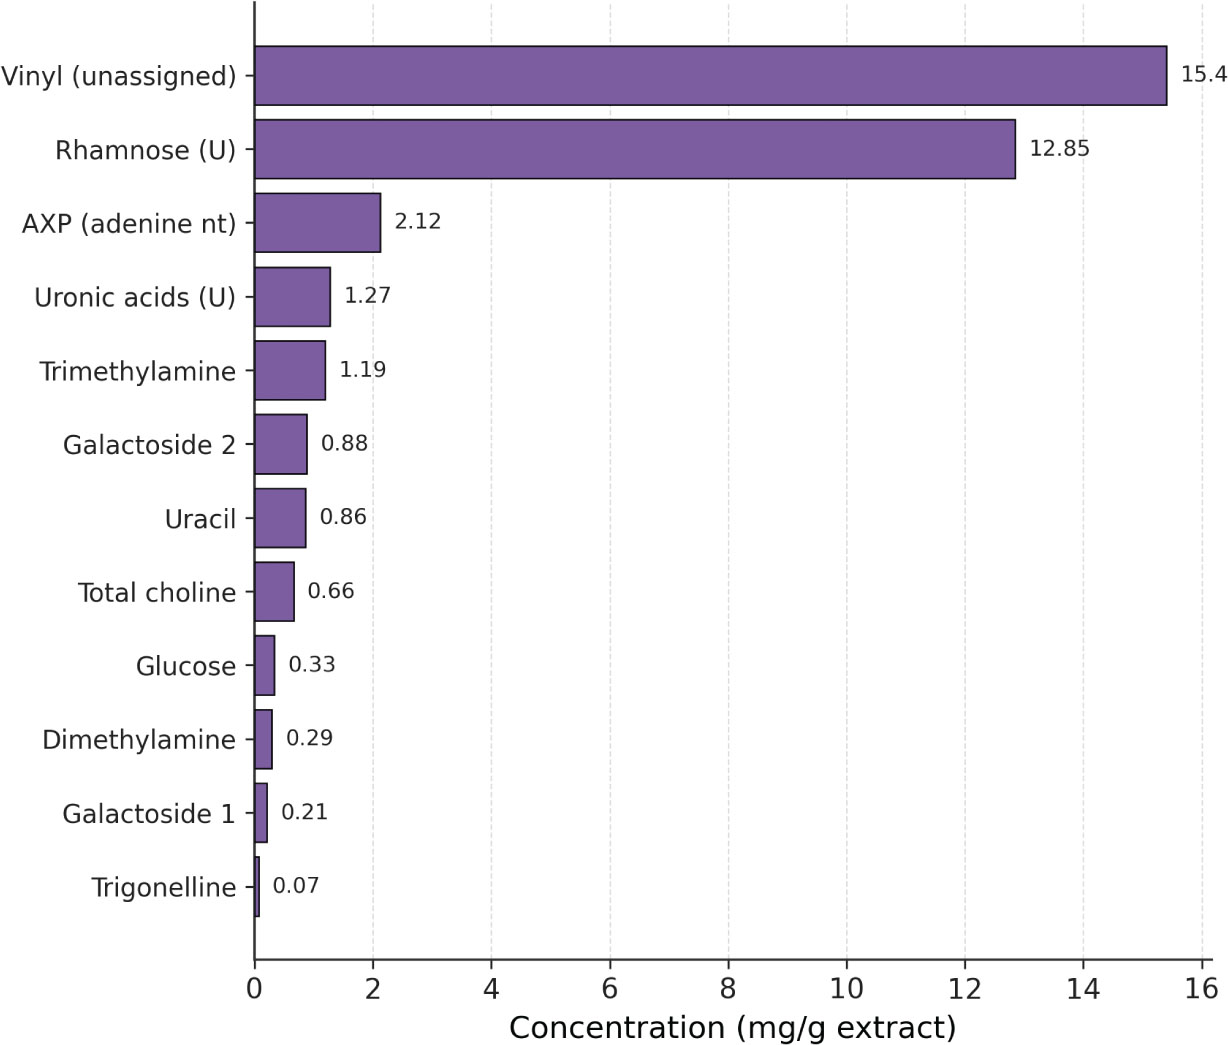
Figure 6
Concentration of carbohydrates, ulvan-derived fragments, vinyl compounds, nitrogenous bases, nucleotides, and quaternary amines in the hydroalcoholic extract of U. onhoi, expressed in milligrams per gram.
Table 3
Quantitative composition of the hydroalcoholic extract (milligrams per gram of extract, mean ± SD).
| Compound | Concentration (mg/g) |
|---|---|
| Glutamine | 26.9 ± 1.35 |
| Glutamate | 17.58 ± 0.88 |
| Alanine | 9.96 ± 0.52 |
| Asparagine | 6.05 ± 0.31 |
| Leucine | 2.91 ± 0.15 |
| Isoleucine | 1.99 ± 0.11 |
| Valine | 2.73 ± 0.14 |
| Phenylalanine | 2.96 ± 0.15 |
| Tyrosine | 2.46 ± 0.12 |
| Tryptophan | 0.47 ± 0.02 |
| Glycine | 0.02 ± 0.01 |
| Succinate | 4.05 ± 0.21 |
| Acetate | 1.55 ± 0.08 |
| Formate | 0.36 ± 0.02 |
| Fumarate | 0.10 ± 0.01 |
| 4-Hydroxybenzoate | 0.08 ± 0.01 |
| Rhamnose (U) | 12.85 ± 0.64 |
| Glucose | 0.33 ± 0.02 |
| Galactoside 1 | 0.21 ± 0.01 |
| Galactoside 2 | 0.88 ± 0.04 |
| Uronic acids (U) | 1.27 ± 0.06 |
| Vinyl (unassigned) | 15.4 ± 0.77 |
| Uracil | 0.86 ± 0.04 |
| AXP (adenine nucleotides) | 2.12 ± 0.11 |
| Trigonelline | 0.07 ± 0.01 |
| Total choline | 0.66 ± 0.03 |
| Dimethylamine | 0.29 ± 0.01 |
| Trimethylamine | 1.19 ± 0.06 |
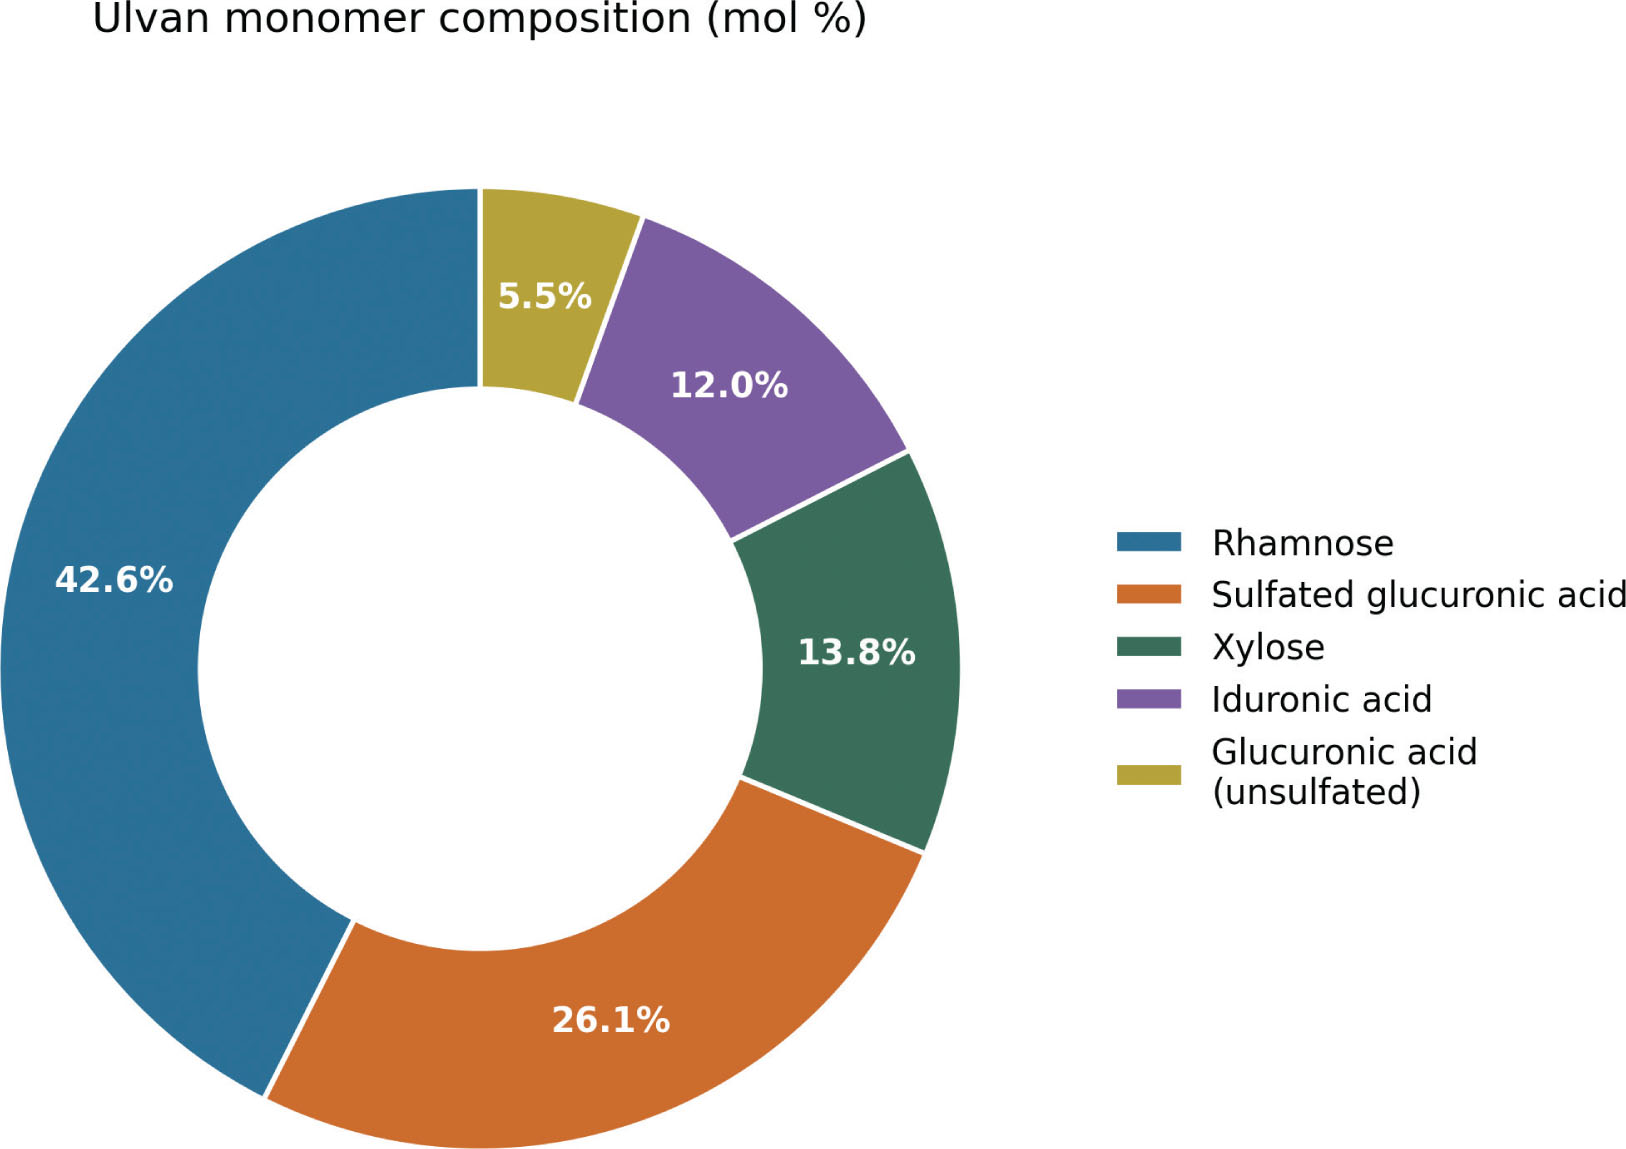
Figure 7
Visualizing chart showing the monomeric composition of ulvan isolated from U. onhoi after acid hydrolysis.