
1. Introduction
The progressive shift toward a sustainable bio-economy has placed marine macroalgae at the center of scientific and industrial attention (Camarena-Gómez et al., 2022). Among the thousands of known species, the green algal genus Ulva (Chlorophyta, Ulvaceae), commonly referred to as sea lettuce, stands out for its cosmopolitan distribution, rapid growth, and remarkable ability to thrive in eutrophic and highly variable coastal environments (Pirian et al., 2016; Simon et al., 2022). Species such as Ulva lactuca Linnaeus 1753: 1163, Ulva rigida C. Agardh 1823: 410, Ulva fasciata Delile 1813: 297, Ulva pertusa Kjellman 1897: 4–7 pl. 1; pl. 3, Ulva prolifera O.F. Müller 1778: 7, U. ohnoi M. Hiraoka and S. Shimada 2004: 20; and many others have been documented on every continent, from arctic to tropical waters, and are increasingly considered as a renewable feedstock for functional foods, animal feed, biofuels, and high-value bioactive compounds (Laramore et al., 2022; Steinhagen et al., 2022). Ethnobotanical records provide a rich backdrop to the modern interest in Ulva. In traditional medicine across Asia, Africa, the Pacific Islands and the Mediterranean, various Ulva species have been used for centuries (Pereira, 2015). Decoctions and poultices of Ulva australis Areschoug 1854: 370, Ulva conglobata Kjellman 1897: 10, U. fasciata, U. lactuca, and U. pertusa were employed to treat fevers, urinary tract infections, water retention, burns, insect bites, skin rashes, epistaxis, and even sun burn (Anggadiredja, 2009; Chengkui et al., 1984; Dumilag & Javier, 2022). These traditional uses have driven a wave of contemporary pharmacological and non-pharmacological investigations. In vitro and in vivo studies have reported antioxidant, anti-inflammatory, antimicrobial, antiviral, immunomodulatory, hepatoprotective, anti-obesity, and antifouling activities for various Ulva extracts and purified polysaccharides (Cao et al., 2022; Chi et al., 2020; Ghallab et al., 2022; Roach et al., 2022; Ruggeri et al., 2026; Shobier et al., 2023; Sohail et al., 2024; Wan et al., 2022). A clinical study used a commercial ulvan-based product (SXRG84) to reduce inflammatory markers in overweight and obese subjects, further underscoring the translational potential (Pappou et al., 2022). These bioactivities have been variously attributed to the different chemical fractions of the alga (Babich et al., 2022). The primary metabolite of Ulva is quantitatively dominant, accounting for approximately 90% of the dry weight (He et al., 2018). The most characteristic components are the cell-wall sulfated heteropolysaccharides known as ulvans, which can constitute up to 50% of the biomass in U. lactuca (Kidgell et al., 2019). Ulvans are primarily composed of l-rhamnose, d-xylose, d-glucuronic acid and its sulfated forms, and l-iduronic acid; they have been extensively reviewed for their gelling, antioxidant, antiviral, and immunomodulating properties (Kendel et al., 2015; Lahaye & Robic, 2007). Besides ulvans, Ulva is a source of proteins and free amino acids, with a balanced essential amino acid profile, as well as lipids rich in polyunsaturated fatty acids (PUFAs), particularly ω-3 α-linolenic acid, and phytosterols (Li et al., 2023; Trentin et al., 2020; Yi et al., 2022). In contrast, the secondary metabolome of Ulva has been a matter of intense debate (Alsufyani et al., 2017). A substantial body of literature describes the presence of a wide array of phenolic acids and flavonoids. For example, Yi et al. (2022) reported a U. lactuca polyphenol-rich extract dominated by rutin, epigallocatechin gallate, hesperidin, epigallocatechin and catechin and associated it with anti-inflammatory effects on the colon. El-Bilawy et al. (2022) identified caffeic acid, ferulic acid, chlorogenic acid, ellagic acid, protocatechuic acid, rutin, quercetin, kaempferol, luteolin, 7-hydroxy-flavone, 4-hydroxy-benzoic acid, and salicylic acid in U. fasciata by HPLC-UV. Many other studies claim the presence of similar phenolics compounds in multiple Ulva species using a variety of extraction and detection methods (Abou-ElWafa et al., 2009; Alamsjah et al., 2005; Chakraborty & Paulraj, 2010; El Ashry et al., 2011; El-Mesallamy et al., 2021; Gupta & Kushwaha, 2017; Kammoun et al., 2018; Marques et al., 2021; Mohy El-Din & Alagawany, 2019; Pakingking et al., 2022; Silva et al., 2013; Unnikrishnan et al., 2022; Zaatout et al., 2019). However, a closer examination reveals that many of these identifications rely on nonspecific techniques such as simple phytochemical screening tests (e.g., coloration reactions for alkaloids, tannins, saponins), which are known to produce false positives in polysaccharide-rich matrices (Anjali et al., 2019; Flodin & Whitfield, 1999). Even when more advanced techniques such as HPLC-UV or LC-MS are used, peak identification often rests solely on retention time or UV spectra without confirmation by authentic standards spiked into the matrix, leaving open the possibility of misidentification due to matrix interferences (Yao et al., 2022). Moreover, the environmental source of the algae matters; some reports of unusual compounds (e.g., the synthetic opioid tramadol in U. lactuca from Oman) have been plausibly attributed to contamination from anthropogenic sources rather than algal biosynthesis (Ruan et al., 2023). This dichotomy between a literature rich in reported phenolic secondary metabolites and the absence of their biosynthetic pathways typically associated with higher plants or specific algal clades has created a significant knowledge gap (Del Mondo et al., 2022). A rigorous, metabolomics-guided reevaluation of the Ulva metabolome is, therefore, urgently needed to clarify which compounds are genuinely present in the biomass and which are artifacts or contaminants (Nwokorogu & Sabiu, 2026). Such a clarification is essential not only for basic phycochemistry but also for the rational development of Ulva-based products, where bioactivity must be correctly attributed to the responsible chemical entities (Putra et al., 2024). To address this challenge, the present study employed a multi-platform analytical approach that combines high-performance thin-layer chromatography (HPTLC) with quantitative nuclear magnetic resonance (qNMR) spectroscopy. HPTLC offers unique advantages for the comparison of extracts and pure standards on the same plate, allowing a direct visual and densitometric assessment of compound presence or absence (Vyas et al., 2023). By using cochromatography with internal standards, matrix effects can be ruled out. 1H-NMR, on the other hand, provides an unbiased, simultaneous detection and quantification of all proton-bearing metabolites in solution, without the need for extensive sample pre-fractionation or derivatization (He et al., 2025). The combination of these two orthogonal techniques was applied to a sequentially extracted U. onhoi biomass (n-hexane, ethyl acetate, acidified 70% ethanol) and the isolated ulvan fraction. The objectives were to (i) obtain a complete qualitative and quantitative metabolomic fingerprint, (ii) critically test the presence of the most cited phenolic secondary metabolites using HPTLC with spiked standards, (iii) quantify the lipid, amino acid, organic acid, and sugar pools by qNMR, and (iv) determine the monomeric composition of the extracted ulvan.
2. Materials and methods
2.1. Algal material and sample preparation
The biomass, free-floating, of U.ohnoi used in this study was sampled from a well-settled population in the lagoon-coastal area of the Ganzirri Lakes (38°15′43.47″ N 15°37′32.56″ E), Fig. 1. Biomass was immediately stored at −50°C until processing to quench enzymatic activity. Taxonomic identification was based on detailed morphological and anatomical examination (thallus shape, blade thickness, cell arrangement, and chloroplast position) under a Nikon SMZ745 stereomicroscope (Nikon Instruments Inc., Tokyo, Japan. Molecular (DNA barcoding, e.g., tufA) confirmation was not performed on the present specimens and is acknowledged as a limitation of this study; morphological identification as U. ohnoi is consistent with populations documented in the same geographic area (Strait of Messina) that have been molecularly confirmed by tufA barcoding in an independent study (Spagnuolo et al., 2022). Physicochemical parameters of the water column at the collection site (temperature, salinity, pH, dissolved oxygen, nutrient levels) are present in Table 1. Temperature, salinity, pH, and dissolved oxygen were recorded using a portable multiparametric probe (HI9829, Hanna Instruments, Woonsocket, RI, USA), calibrated prior to use according to the manufacturer’s instructions. Water samples for nutrient analysis were collected in acid-washed polyethylene bottles and filtered through 0.45 μm cellulose acetate membrane filters. Nitrate and phosphate concentrations were determined colorimetrically using commercial test kits (Nitrate and Phosphate Test Kit, Hanna Instruments) with a portable photometer (HI96728/HI96717, Hanna Instruments), following the manufacturer’s standard protocol. For trace metal analysis, water samples were collected in acid-washed polyethylene bottles, acidified with ultrapure HNO3 (pH <2), and stored at 4°C until analysis. Concentrations of cadmium (Cd), lead (Pb), copper (Cu), and nickel (Ni) were determined using rapid semi-quantitative colorimetric test strips (QuanTab® or Hach heavy metal test kits, Hach Company, Loveland, CO, USA), suitable for screening-level detection of trace metal concentrations in coastal waters. The whole frozen alga was ground under liquid nitrogen to a fine powder and used immediately for extraction.
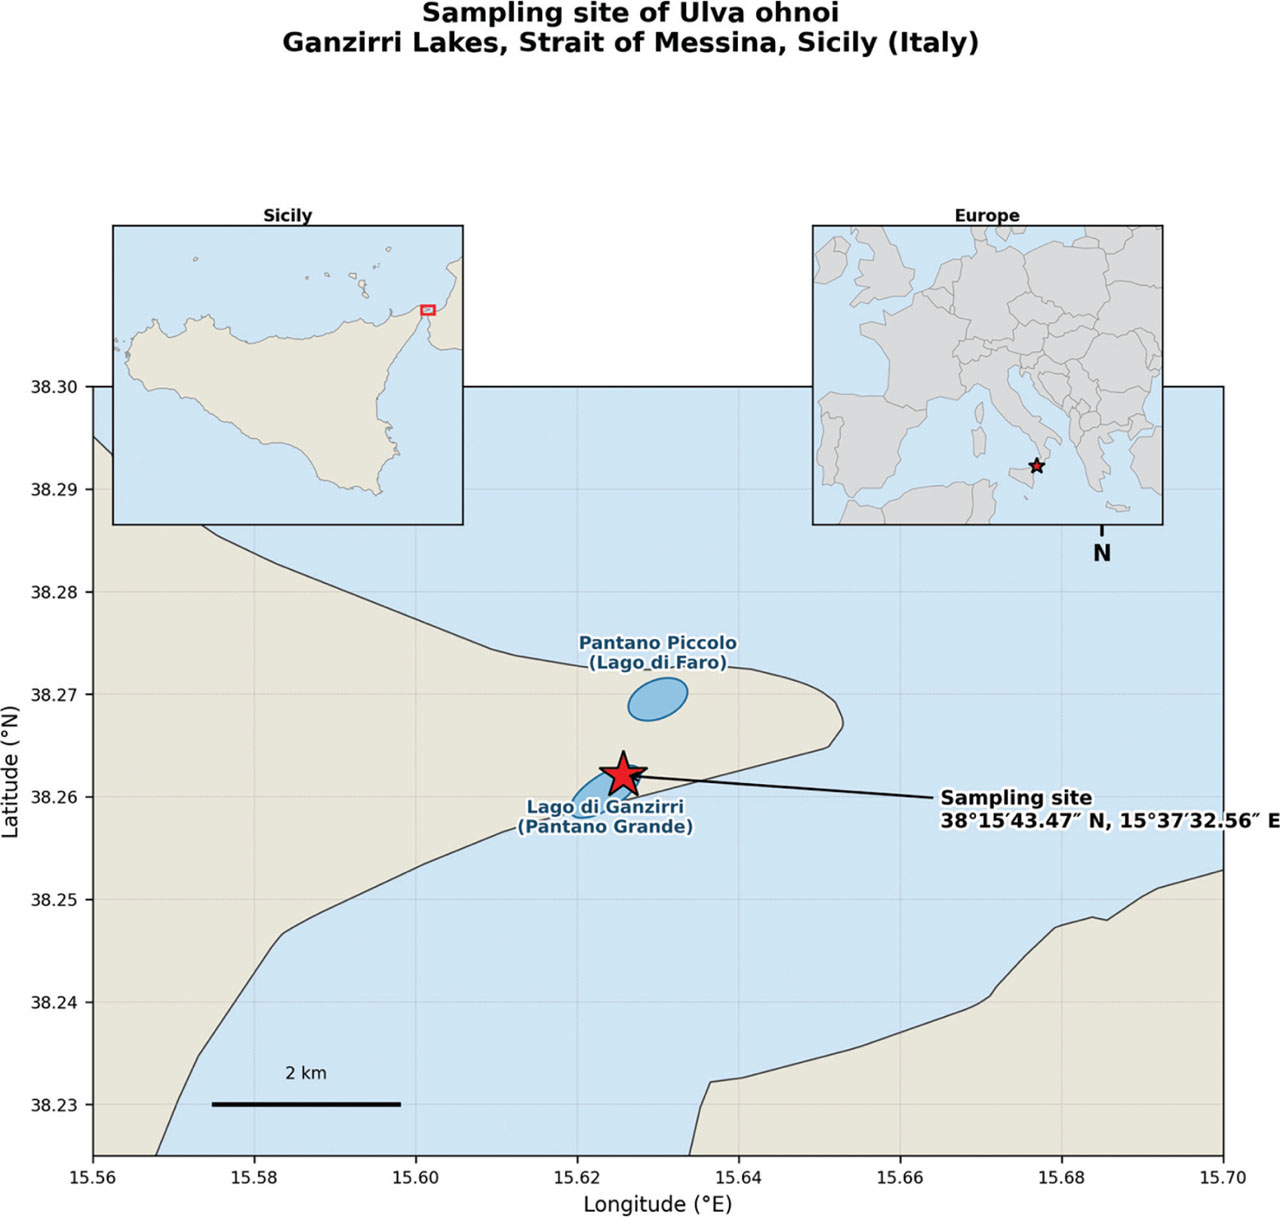
Figure 1
Map showing the location of the sampling site in the Ganzirri Lakes (Strait of Messina, north-eastern Sicily, Italy; (38°15′43.47″ N, 15°37′32.56″ E), where U. ohnoi biomass was collected. The inset map shows the position of the study area within the broader context of Italy and the central Mediterranean.
2.2. Sequential extraction
A three-step sequential extraction was performed to fractionate metabolites according to polarity. All steps were carried out at room temperature with constant magnetic stirring. Lipophilic extraction (n-hexane): 20 g of algal powder was extracted three times with 200 mL of n-hexane (each 1 hr). Combined extracts were filtered through Whatman No. 1 paper, dried over anhydrous Na2SO4, and evaporated to dryness under reduced pressure at ≤40°C. Intermediate polarity extraction (ethyl acetate): The residual marc was air-dried and then extracted three times with 200 mL of ethyl acetate under the same conditions. After filtration and drying, the solvent was removed by rotary evaporation. Hydroalcoholic extraction: The remaining biomass was extracted with 200 mL of ethanol/water (70:30, v/v) acidified with 1% formic acid (three times, 1 hr each). The combined hydroalcoholic extracts were filtered and concentrated under vacuum. A second independent batch was prepared using new solvent lots to exclude contamination from solvents; extracts never contacted plastic materials to avoid plasticizer leaching. Yields were recorded for each extract and expressed as milligrams per gram of dry biomass. Aliquots were dissolved in appropriate deuterated solvents for NMR analysis.
2.3. Ulvan extraction and hydrolysis
Crude ulvans were extracted following a hot-water protocol. Fresh minced alga (20 g) was suspended in 200 mL distilled water and heated at 95°C for 2 hr. After cooling, the mixture was vacuum-filtered, and the filtrate was precipitated with four volumes of cold absolute ethanol. The suspension was kept at 4°C for 48 hr, then filtered. The resulting white solid was lyophilized to obtain crude ulvan (yield: 2% of fresh weight). For monomeric analysis, 10 mg of ulvan was hydrolyzed with 1 mL of 2 M trifluoroacetic acid (TFA) at 90°C for 6 hr. The hydrolysate was dried under a nitrogen stream, washed three times with methanol to remove residual TFA, and reconstituted in D2O for NMR.
2.4. HPTLC profiling and phenolic screening
All HPTLC analyses were performed on silica gel 60 F254 plates (Merck, Darmstadt, Germany); 10 cm × 10 cm or 20 cm × 10 cm). Samples were applied as 8 mm bands using an automatic TLC sampler 4 (ATS4, CAMAG, Switzerland) with nitrogen as spray gas. Plates were developed in a twin trough chamber (TTC 20 × 10) or an automatic developing chamber ADC2 (CAMAG) under controlled humidity. Visualization was done with a TLC Visualizer under UV 254, 366 nm, and white light. Densitometric scanning was performed with a TLC Scanner 4 (CAMAG) at appropriate wavelengths. Lipid profiling: For a general lipid overview, plates were developed with a double run—first with diethyl ether/n-hexane/methanol/acetic acid (60:40:5:1, v/v/v/v) for 70 mm, dried, then redeveloped with n-hexane/diethyl ether/acetic acid (80:20:2, v/v/v) to 70 mm. Post-chromatographic derivatization was with anisaldehyde-sulfuric acid reagent (heating at 120°C for 5 min) or phosphomolybdic acid reagent. Secondary metabolite screening (phenolics): To specifically search for the most cited phenolic compounds, plates were developed in ADC2 with two optimized mobile phases:
MP1: acetone/toluene/formic acid (9:9:2, v/v/v)
MP2: ethyl acetate/dichloromethane/acetic acid/formic acid/water (100:25:10:10:11, v/v/v/v/v)
Authentic standards (caffeic acid, cinnamic acid, chlorogenic acid, o-coumaric acid, p-coumaric acid, coumarin, gallic acid, (+)−catechin, quercetin, rutin, vanillin, and apigenin; 2 mg · mL−1 in methanol) were applied (0.5 μL) alongside the Ulva extracts (4 μL of 60 mg · mL−1 solutions). For unambiguous proof of absence, cochromatography was carried out by spiking the hydroalcoholic extract with chlorogenic acid and o-coumaric acid as internal standards. Derivatization was performed by dipping in natural product reagent (NP) followed by anisaldehyde reagent, with heating. UV spectra of bands were recorded in situ using the TLC Scanner 4 between 200 nm and 500 nm.
2.5. Quantitative 1H-NMR spectroscopy
Spectra were recorded at 298 K on a Bruker Avance spectrometer operating at 600 MHz (1H) equipped with a cryoprobe. For quantification, 90°pulses, a relaxation delay of ≥5 × T1 (typically 10 s), and 64 k data points were used. Solvent suppression was applied for D2O samples (presaturation). Lipophilic extracts (n-hexane, ethyl acetate) were dissolved in CDCl3 containing tetramethylsilane as internal standard. Quantitative determinations were based on the integrated signals of terminal methyl of saturated fatty acids (δ 0.88), methyl of ω-3 PUFA (δ 0.98), allylic protons of unsaturated fatty acids, glycerol backbone of triglycerides, choline headgroup of phospholipids, carotenoid conjugated olefinic protons, and sterol protons. Calibration was done against a known amount of 1, 2, 4, 5-tetrachlorobenzene as internal standard. The hydroalcoholic extract was dissolved in D2O with 3-(trimethylsilyl)propionic-2, 2, 3, 3-d4 acid (TSP) as internal standard. Identified metabolites (amino acids, organic acids, sugars, etc.) were quantified by integrating well-resolved resonances and normalizing to the TSP concentration and the number of protons of the signal. All samples were prepared and measured in triplicate. Results are expressed as milligrams of compound per gram of extract ± standard deviation (SD).
2.6. Data analysis and statistics
All data are presented as mean ± SD from three independent extractions/analyses. Metabolite identification in NMR was supported by 2D experiments (COSY, TOCSY, HSQC, HMBC) and comparison with the Human Metabolome Database and Chenomx NMR Suite. For HPTLC, comparisons were made by visual inspection of band Rf and in-situ UV-Vis spectra. The choice of three independent replicates (n = 3) reflects standard practice in quantitative analytical chemistry, where the main source of variance is instrumental/methodological rather than biological: qNMR quantification against a calibrated internal standard typically shows method-level relative SDs below 5% (as reflected in the SD values reported in Tables 1 and 2), so that three independent extractions/measurements are sufficient to establish measurement precision and support the quantitative comparisons drawn in this study. This design choice is distinct from ecological or biological replication (i.e., sampling multiple individuals/populations to capture biological variability), which was not the aim of the present analytical characterization; algal biomass availability was not a limiting factor.
Table 2
Quantitative composition of lipophilic extracts (milligrams per gram of extract, mean ± SD, n = 3).
| Metabolite | n-hexane extract | Ethyl acetate extract |
|---|---|---|
| Saturated fatty acids (stearic acid eq.) | 279.77 ± 13.99 | 270.81 ± 13.54 |
| Monounsaturated fatty acids (oleic acid eq.) | 24.94 ± 1.25 | 41.41 ± 2.07 |
| PUFAs ω6 (linoleic acid eq.) | 0.67 ± 0.03 | 8.33 ± 0.42 |
| PUFAs ω3 (linolenic acid eq.) | 1.96 ± 0.10 | 13.82 ± 0.69 |
| Triglycerides | 8.62 ± 0.43 | 3.18 ± 0.16 |
| Phospholipids | 0.038 ± 0.002 | 0.11 ± 0.01 |
| Carotenoids | 14.15 ± 0.71 | 14.12 ± 0.71 |
| Liposoluble phenols | 0.78 ± 0.04 | 0.25 ± 0.01 |
| Aldehydes (acetaldehyde eq.) | 2.42 ± 0.12 | 0.06 ± 0.003 |
| Campesterol | 0.034 ± 0.002 | 0.40 ± 0.02 |
3. Results and discussion
3.1. Qualitative HPTLC screening of lipids and secondary metabolites
Preliminary HPTLC experiments established that the optimal sample concentration for band sharpness was 60 mg · mL−1 and that the lipidic nature of both n-hexane and ethyl acetate extracts was overwhelming. Under both anisaldehyde and phosphomolybdic acid derivatization conditions, these extracts displayed intense bands corresponding to neutral lipids (triglycerides, free fatty acids, sterols, and carotenoids). In particular, the ethyl acetate extract exhibited a broader range of bands in the polar lipid region, consistent with the presence of glycolipids and phospholipids. The dedicated screening for phenolic secondary metabolites produced the most critical results of this study. On plates developed with either MP1 or MP2, all authentic standards migrated as discrete, UV-quenching bands at their characteristic Rf values. Caffeic acid, chlorogenic acid, quercetin, rutin, and other standards were readily visible under UV 254 nm and/or 366 nm and gave positive reactions with NP/PEG derivatization. In stark contrast, the U. ohnoi extract, in either the ethyl acetate or the hydroalcoholic fraction, showed no band at the Rf positions of these standards, either before or after derivatization. More importantly, when the hydroalcoholic extract was spiked with chlorogenic acid and o-coumaric acid, the spiked samples clearly showed the additional bands of the added standards at the exact Rf and with the same spectral properties as the pure standards, while the unspiked extract remained devoid of those bands. This cochromatography experiment definitively rules out any matrix suppression effect: if the compounds were present, even at low concentrations, they would have been detectable in the spiked configuration. The in-situ UV spectra of the extracts’ bands further confirmed the absence of the characteristic polyphenolic absorption profiles. Thus, the HPTLC data force the conclusion that the commonly reported phenolic metabolites caffeic acid, quercetin, rutin, chlorogenic acid, and related compounds are not present in detectable amounts in the analyzed U. onhoi biomass. This finding aligns with the observations of some researchers who have questioned the specificity of the Folin-Ciocalteu and other colorimetric tests in algal matrices (Anjali et al., 2019; Flodin & Whitfield, 1999), but it directly contradicts a large body of literature that relies on non-spiked HPLC or LC-MS methods. Residual minor phenolics (e.g., liposoluble phenols in the lipophilic extracts quantified at sub-milligram per gram levels) may still exist, but they are not the major secondary metabolite pool.
3.2. Quantitative 1H-NMR analysis of the lipophilic fractions
The quantitative NMR analysis of the n-hexane and ethyl acetate extracts confirmed and refined the HPTLC picture. Quantitative data are summarized in Table 2 and Figs 2–4.
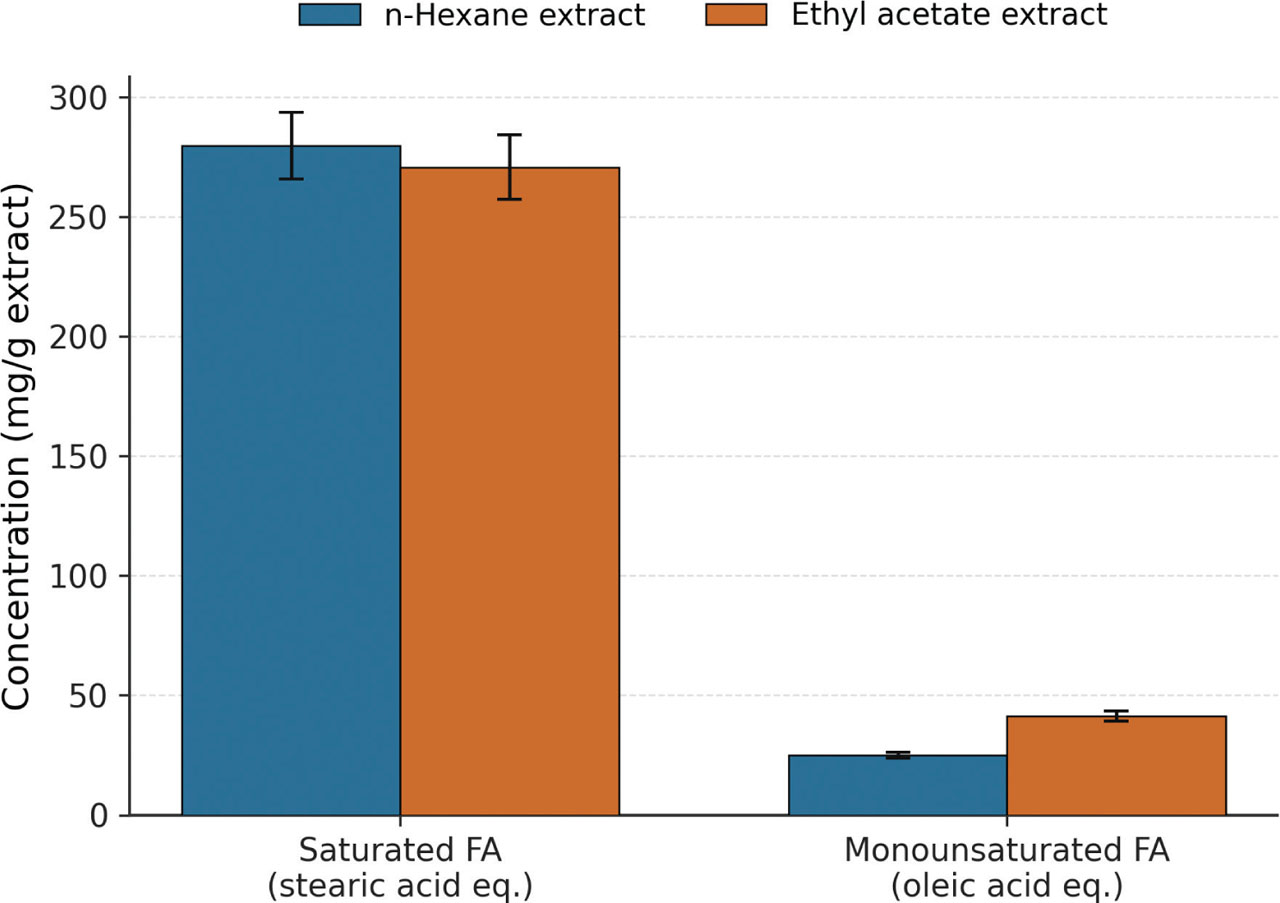
Figure 2
Quantification of lipophilic extracts (n-hexane and ethyl acetate). Saturated fatty acids (stearic acid equivalent) and monounsaturated fatty acids (oleic acid equivalent), expressed in milligrams per gram.
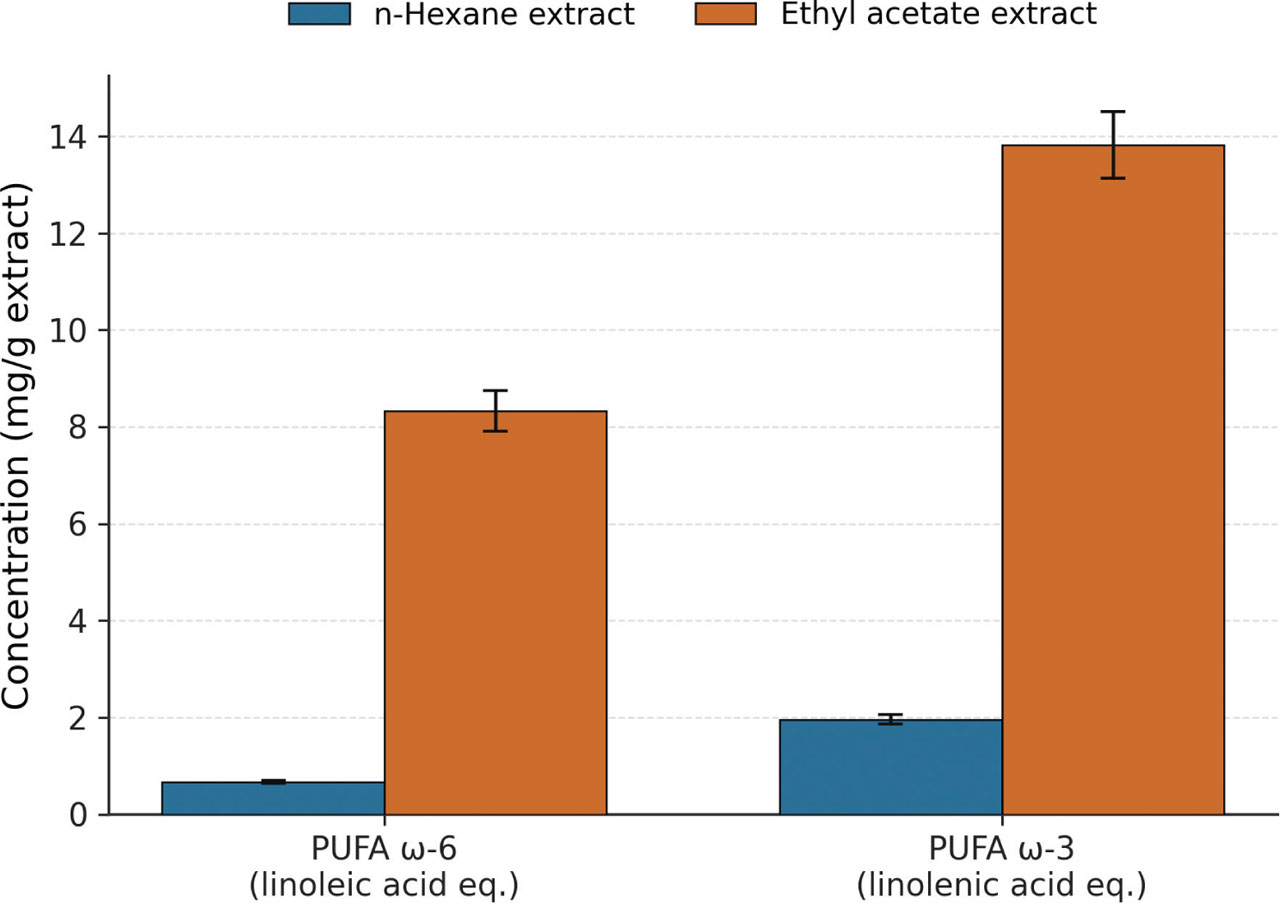
Figure 3
Quantification of lipophilic extracts (n-hexane and ethyl acetate). PUFA ω-6 (linoleic acid equivalent) and PUFAs ω-3 (linolenic acid equivalent) expressed in milligrams per gram. PUFAs, polyunsaturated fatty acids.
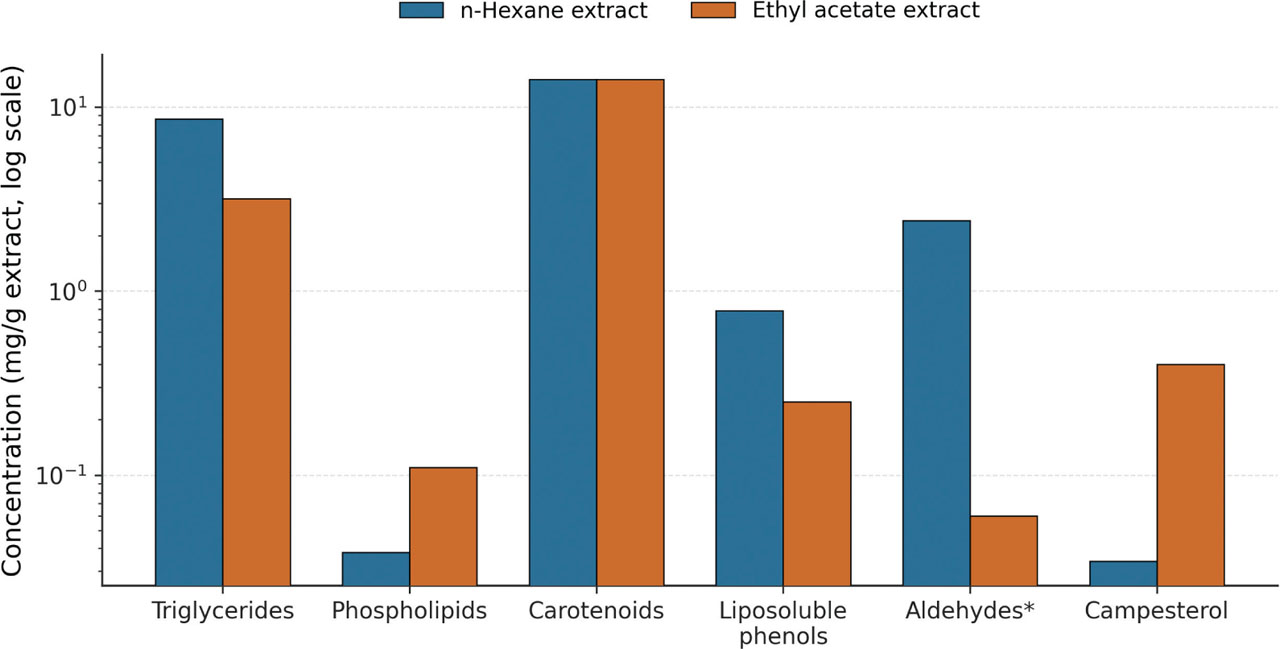
Figure 4
Quantification of lipophilic extracts (n-hexane and ethyl acetate). Triglycerides, carotenoids, aldehydes (acetaldehyde equivalent), phospholipids, liposoluble phenols, and campesterol, expressed in milligrams per gram.
The fatty acid profile is dominated by saturated chains, a feature consistent with the known lipid composition of Chlorophyta where palmitic and stearic acids are often prevalent. The n-hexane extract is particularly efficient at recovering saturated fatty acids (279.77 mg · g−1) and triglycerides (8.62 mg · g−1), making it a suitable source for biofuel or lipid-based formulations. The ethyl acetate extract, on the other hand, shows a significantly enhanced content of ω-3 PUFAs (13.82 mg · g−1 vs 1.96 mg · g−1, a 7-fold increase) and ω-6 PUFAs (8.33 mg · g−1 vs 0.67 mg · g−1), as well as a substantially higher campesterol concentration (0.40 mg · g−1 vs 0.034 mg · g−1). This enrichment in nutritionally valuable PUFAs and phytosterols highlights the importance of solvent selection when targeting bioactive lipids. The carotenoid content is nearly identical in both solvents (≈14 mg · g−1), indicating that these pigments are extracted with similar efficiency by both nonpolar and slightly polar solvents. Aldehydes, a potential marker of lipid oxidation, were more abundant in the n-hexane extract, likely reflecting the higher triglyceride content and possible oxidation during processing. These quantitative values place U. ohnoi biomass in a favorable position compared to other edible green algae and even some terrestrial plants, especially as a source of ω-3 fatty acids and carotenoids like lutein and β-carotene (detected in the carotenoid signal envelope).
3.3. The hydroalcoholic metabolome: Amino acids, organic acids, and carbohydrates
The 1H-NMR spectrum of the hydroalcoholic extract (Table 3 and Figs 5 and 6) revealed an exceptionally rich mixture of primary polar metabolites. The amino acid profile is particularly noteworthy. Glutamine (26.9 ± 1.35 mg · g−1) and glutamate (17.58 ± 0.88 mg · g−1) are the most abundant, together accounting for over 44 mg · g−1. Alanine (9.96 mg · g−1), asparagine (6.05 mg · g−1), leucine (2.91 mg · g−1), valine (2.73 mg · g−1), phenylalanine (2.96 mg · g−1), and tyrosine (2.46 mg · g−1) are present in significant amounts, while isoleucine, glycine, and tryptophan are found at lower concentrations. This comprehensive essential amino acid profile underscores the nutritional potential of U. onhoi hydroalcoholic extracts as a plant-based protein/amino acid supplement. Among organic acids, succinate (4.05 mg · g−1) and acetate (1.55 mg · g−1) are dominant, together with formate (0.36 mg · g−1) and fumarate (0.10 mg · g−1). 4-Hydroxybenzoate, a simple phenolic acid often reported in Ulva, was detected here at a very minor level (0.08 mg · g−1), consistent with the HPTLC findings that exclude more complex phenolics. The presence of dimethylamine (0.29 mg · g−1), trimethylamine (1.19 mg · g−1), and total choline (0.66 mg · g−1) reflects the algal metabolism of quaternary ammonium compounds, which may serve as osmolytes.
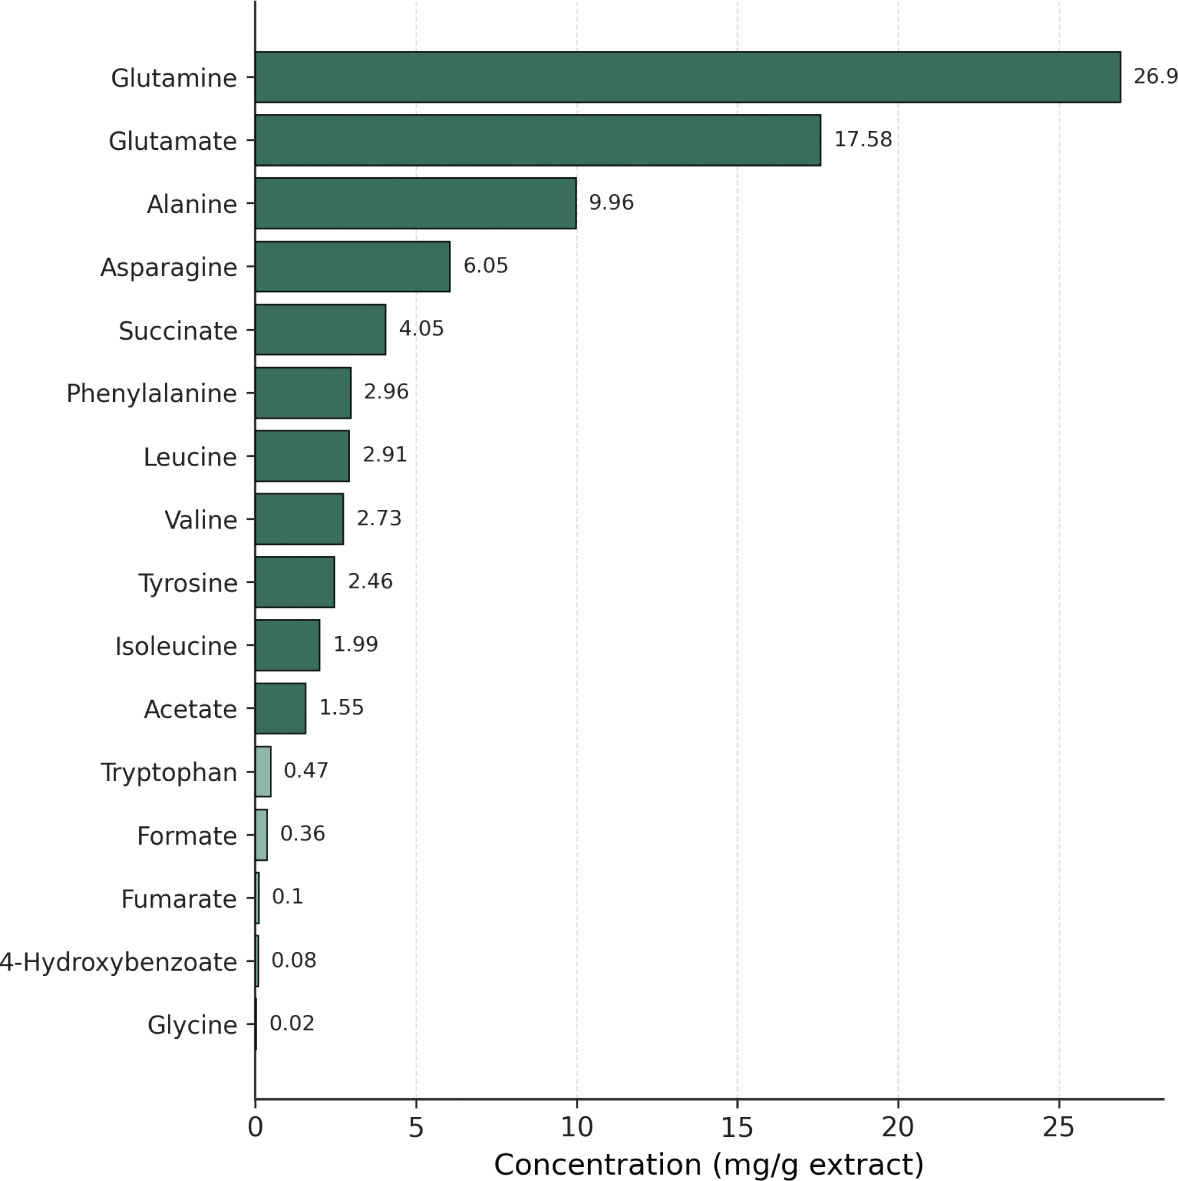
Figure 5
Concentration of amino acids, organic acids, and a simple phenolic compound in the hydroalcoholic extract of U. ohnoi, expressed in milligrams per gram.
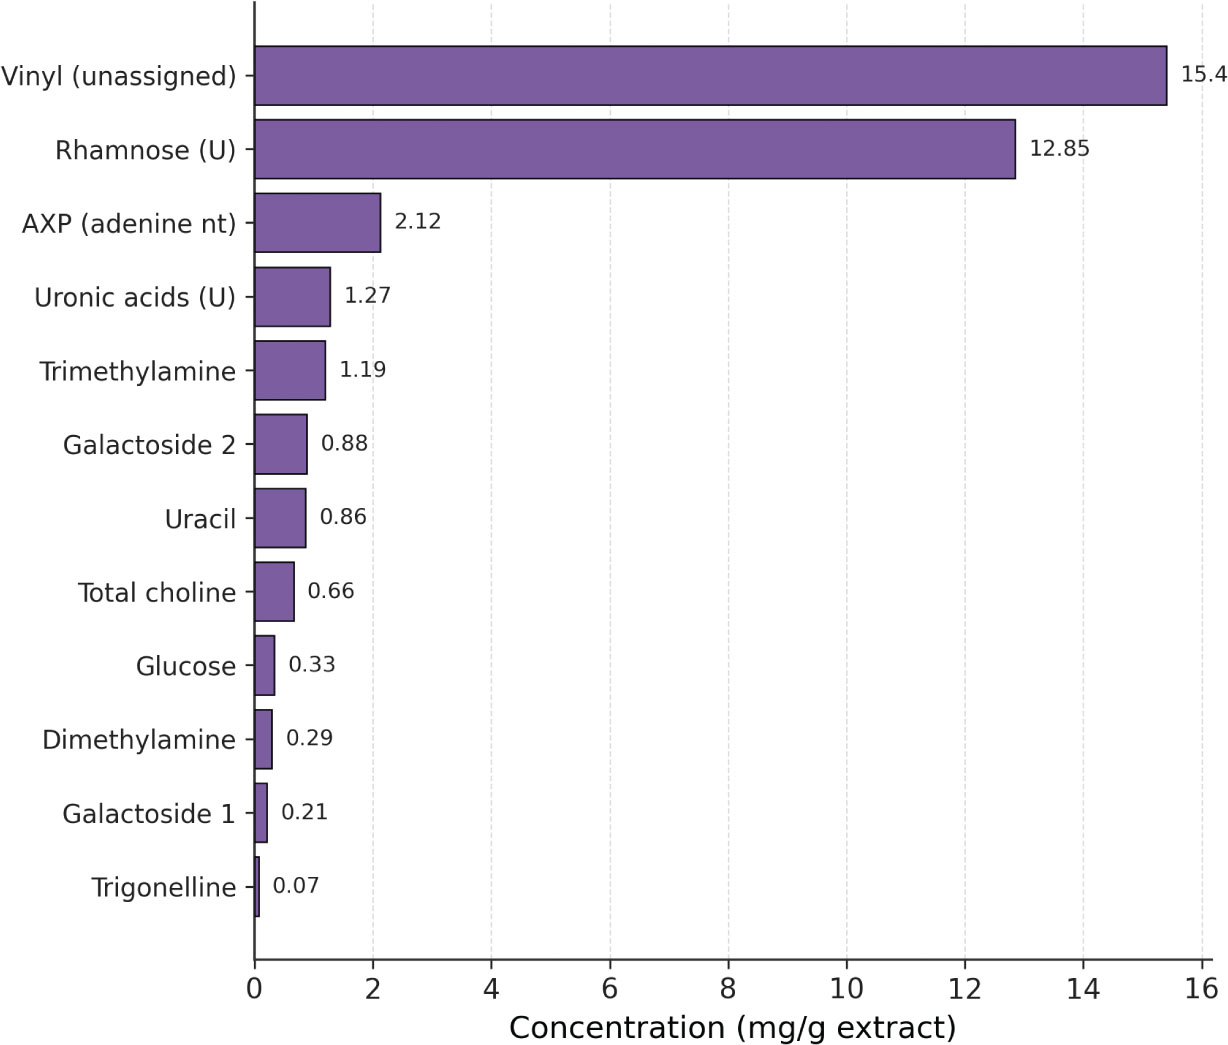
Figure 6
Concentration of carbohydrates, ulvan-derived fragments, vinyl compounds, nitrogenous bases, nucleotides, and quaternary amines in the hydroalcoholic extract of U. onhoi, expressed in milligrams per gram.
Table 3
Quantitative composition of the hydroalcoholic extract (milligrams per gram of extract, mean ± SD).
| Compound | Concentration (mg/g) |
|---|---|
| Glutamine | 26.9 ± 1.35 |
| Glutamate | 17.58 ± 0.88 |
| Alanine | 9.96 ± 0.52 |
| Asparagine | 6.05 ± 0.31 |
| Leucine | 2.91 ± 0.15 |
| Isoleucine | 1.99 ± 0.11 |
| Valine | 2.73 ± 0.14 |
| Phenylalanine | 2.96 ± 0.15 |
| Tyrosine | 2.46 ± 0.12 |
| Tryptophan | 0.47 ± 0.02 |
| Glycine | 0.02 ± 0.01 |
| Succinate | 4.05 ± 0.21 |
| Acetate | 1.55 ± 0.08 |
| Formate | 0.36 ± 0.02 |
| Fumarate | 0.10 ± 0.01 |
| 4-Hydroxybenzoate | 0.08 ± 0.01 |
| Rhamnose (U) | 12.85 ± 0.64 |
| Glucose | 0.33 ± 0.02 |
| Galactoside 1 | 0.21 ± 0.01 |
| Galactoside 2 | 0.88 ± 0.04 |
| Uronic acids (U) | 1.27 ± 0.06 |
| Vinyl (unassigned) | 15.4 ± 0.77 |
| Uracil | 0.86 ± 0.04 |
| AXP (adenine nucleotides) | 2.12 ± 0.11 |
| Trigonelline | 0.07 ± 0.01 |
| Total choline | 0.66 ± 0.03 |
| Dimethylamine | 0.29 ± 0.01 |
| Trimethylamine | 1.19 ± 0.06 |
The carbohydrate region showed signals for free rhamnose and uronic acids (carried over from ulvan solubilization), free glucose, and two galactosides. Their concentrations are relatively low in the hydroalcoholic extract, as the bulk of structural carbohydrates remained in the pellet. A major highlight is the intense, sharp vinyl signal at 5.31 ppm, quantified as 15.4 mg · g−1. This signal does not correspond to any common primary metabolite and is discussed in detail in Section 3.5.
3.4. Structural characterization of ulvan
The crude ulvan yield (2% of fresh weight) is in line with literature values obtained by hot-water extraction without pH adjustment or enzymatic assistance. After TFA hydrolysis, the monomeric profile determined by 1H-NMR is summarized in Table 4 and Fig. 7.
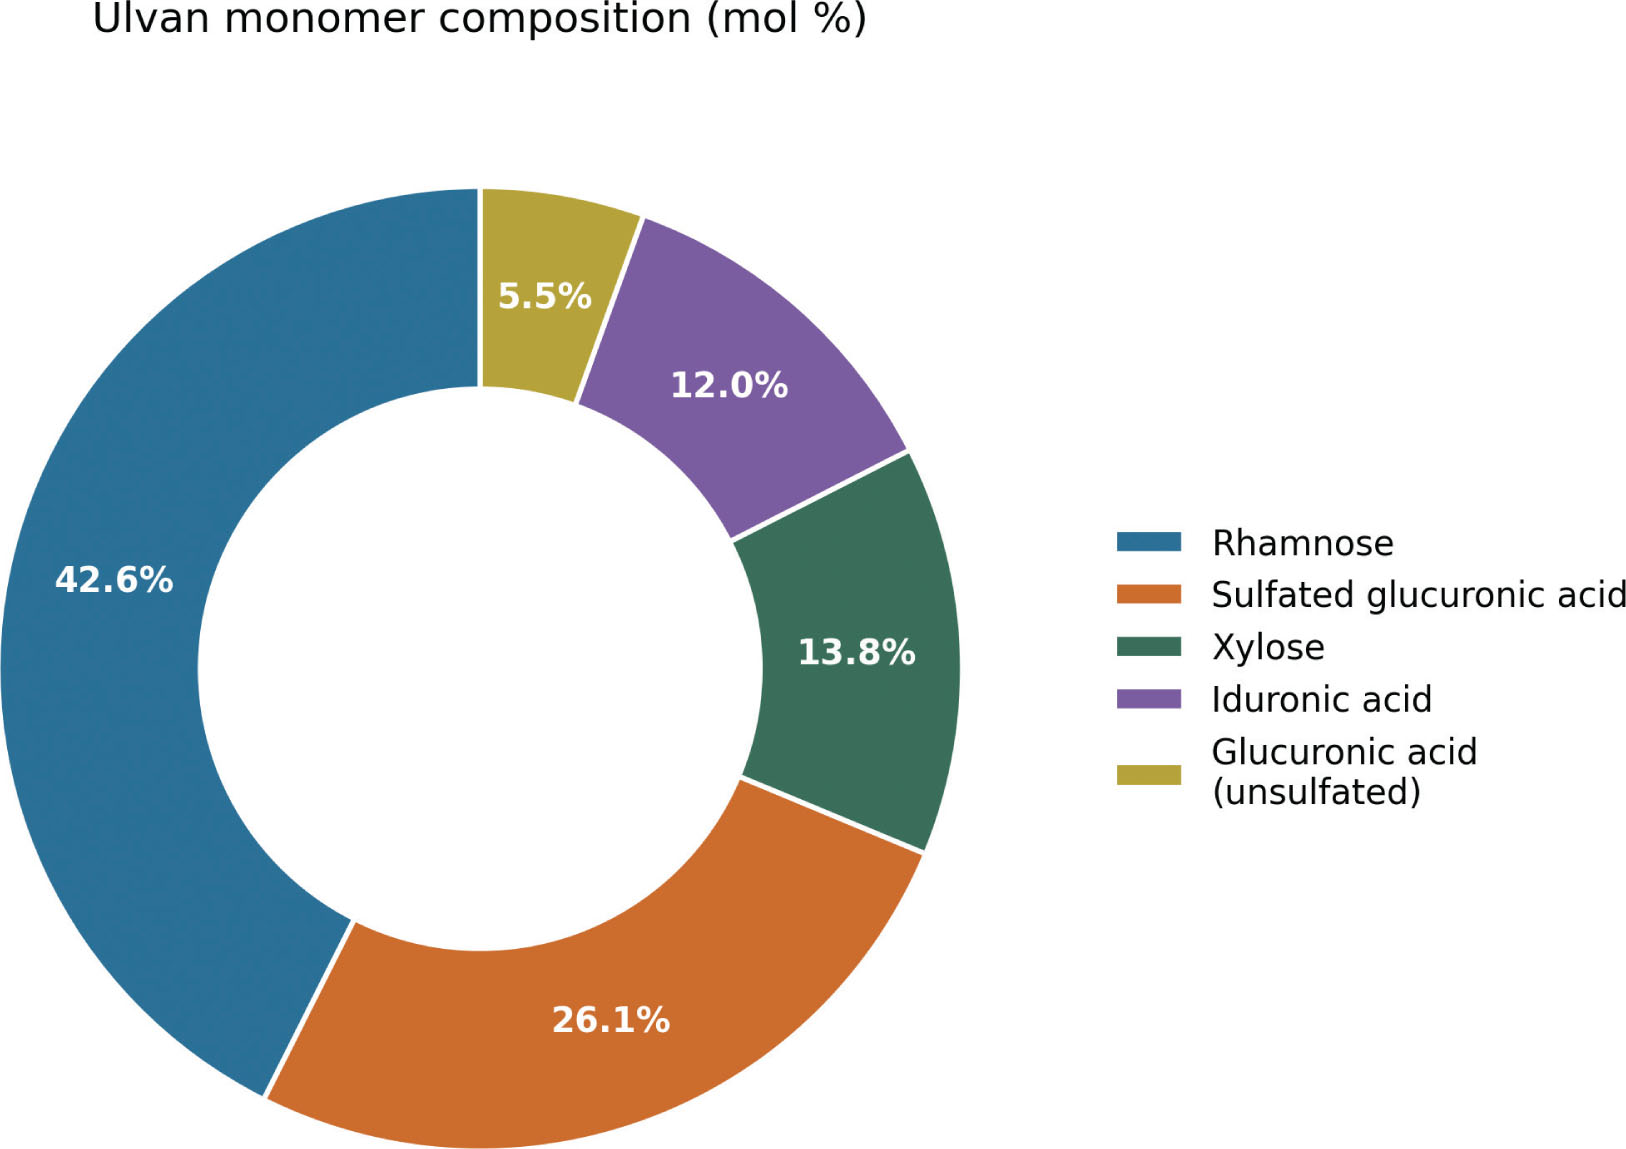
Figure 7
Visualizing chart showing the monomeric composition of ulvan isolated from U. onhoi after acid hydrolysis.
Table 4
Monomeric composition of ulvan isolated from U. ohnoi after acid hydrolysis, expressed as percentage of total identified monomers.
| Compound | Percentage |
|---|---|
| Rhamnose | 42.59 |
| Sulfated glucuronic acid | 26.14 |
| Xylose | 13.77 |
| Iduronic acid | 12 |
| Glucuronic acid (unsulfated) | 5.5 |
The total uronic acid content (sum of unsulfated and sulfated glucuronic acid plus iduronic acid) is 43.64%, while rhamnose remains the single major neutral sugar. The high proportion of sulfated glucuronic acid (26.14%) confirms a substantial degree of sulfation, a key structural feature responsible for the biological activity of ulvan. The presence of iduronic acid (12%) distinguishes this ulvan from other algal sulfated polysaccharides and is typical of Ulva species. Xylose is present as a minor branching sugar. This composition is consistent with a backbone of disaccharide repeating units composed of →4) − β-d-GlcA-(1→4) − α-l-Rha-(1→ with sulfation primarily at C-3 of rhamnose and/or C-2 of glucuronic acid, as previously reported (Lahaye & Robic, 2007). The iduronic acid is likely formed by C-5 epimerization of glucuronic acid during biosynthesis or extraction.
3.5. The enigmatic vinyl signal: Proposed polyacetylenes
Throughout all fractions, particularly evident in the hydroalcoholic extract but also present in the lipophilic spectra, a sharp, intense signal at δ 5.31 ppm was observed. This chemical shift falls within the vinyl proton region (CH = CH), but the signal’s multiplicity and integration are inconsistent with unsaturated fatty acids (which would show broader, coupled patterns). The signal does not correlate with any known Ulva metabolite in standard databases. Given its prominence (15.4 mg · g−1 in the hydroalcoholic extract alone), these vinyl-bearing compounds represent a significant portion of the metabolome. Based on literature reports of polyacetylene derivatives in green algae and the characteristic NMR signal pattern, we hypothesize that this resonance arises from conjugated or isolated vinyl groups in linear polyacetylene structures. Polyacetylenes are a class of specialized metabolites known from certain Chlorophyta, often possessing antimicrobial or cytotoxic properties. Their unexpectedly high concentration in this Ulva sample suggests either constitutive production or induction under specific cultivation/storage conditions. Definitive identification will require bioassay-guided fractionation and extensive 2D NMR and mass spectrometric analysis of the purified compounds. This finding opens a new avenue for the discovery of novel marine natural products from a widely available biomass.
4. Discussion
The integrated data from this study prompt a fundamental reinterpretation of the U. onhoi metabolome. The HPTLC cochromatography experiments provide unequivocal evidence that caffeic acid, chlorogenic acid, quercetin, rutin, and related compounds are absent. The qNMR data show that the hydroalcoholic fraction is instead dominated by primary nitrogenous compounds (amino acids, amines) and organic acids, with only trace levels of simple phenolics such as 4-hydroxybenzoate. How can this discrepancy be explained? First, many of the earlier studies employed nonspecific total phenolic assays (Folin-Ciocalteu) that are highly susceptible to interference from reducing sugars, ascorbic acid, and proteins, all abundant in Ulva (Torres et al., 2024). Second, HPLC-UV or LC-MS identifications without spiked standards and careful matrix-matched calibration can misassign peaks (Martin, 2017). Third, contamination from epiphytic microalgae or from the environment (e.g., seagrass debris, anthropogenic pollutants) might introduce exogenous phenolics (Mannino & Micheli, 2020). Fourth, there could be genuine intraspecific and environmental variability; some Ulva populations under specific stress conditions might indeed produce trace phenolic compounds, but these are clearly not a consistent, major feature of the metabolome (Ghaderiardakani et al., 2022). From a practical standpoint, the industrial value of Ulva, therefore, relies on its primary metabolites: the lipid fraction rich in ω-3 fatty acids and carotenoids (Table 1), the free amino acid pool (Table 2) that can serve as a natural osmolyte/amino acid supplement, and the ulvan polysaccharide with its specific sulfation pattern (Costa et al., 2024; Spagnuolo et al., 2022). The high concentration of the unassigned vinyl/polyacetylene compounds adds a potential high-value niche if future studies confirm a desirable bioactivity (e.g., antimicrobial, anti-inflammatory). This study, thus, provides the first rigorous, multi-analytical baseline against which future Ulva compositional analyses should be measured.
5. Conclusions
The comprehensive HPTLC-qNMR metabolomic profiling of U. ohnoi has delivered a definitive and critical chemical fingerprint that resolves longstanding contradictions in the algal phytochemistry literature. Specifically, the frequently reported common phenolic secondary metabolites such as caffeic acid, quercetin, and rutin are entirely absent in the analyzed biomass, as evidenced by HPTLC cochromatography with internal standards, meaning their alleged presence in earlier studies must be reinterpreted as analytical artifacts or environmental contamination. Instead, the lipophilic fraction is dominated by saturated fatty acids alongside nutritionally relevant omega-3 PUFAs, particularly in ethyl acetate, as well as carotenoids and campesterol. Complementing this, the hydroalcoholic fraction serves as a rich source of free amino acids dominated by glutamine and glutamate, which are accompanied by organic acids and low-molecular-weight carbohydrates, while the ulvan polysaccharide exhibits a typical monomeric composition characterized by a high content of rhamnose and sulfated glucuronic acid that confirms its structural suitability for functional applications. Furthermore, a significant and previously uncharacterized vinyl signal tentatively assigned to polyacetylenes represents a novel chemo-diversity target for future isolation and bioactivity testing. These collective findings successfully redirect the industrial focus from the elusive phenolic antioxidants of Ulva toward its true chemical assets, encompassing a unique combination of functional lipids, free amino acids, and a sulfated polysaccharide, all complemented by a potentially new class of bioactive vinyl derivatives. Moreover, the exceptionally high content of sulfated groups, particularly sulfated glucuronic acid within ulvan, is fundamentally essential because it confers a strong affinity for heavy metals, allowing the biomass to be utilized either directly or following component extraction for bioremediation purposes by exploiting these powerful chelating properties. While further studies are required to confirm this metal-binding capacity both in vivo and in vitro, future work will involve the chromatographic purification of the vinyl compounds, in vitro bioactivity screening of all fractions, and a metabolomic comparison of Ulva grown under varying cultivation regimes to assess compositional plasticity.
Acknowledgments
The authors used the Gemini tool (https://gemini.google.com/) during the preparation of this work with the aim of improving clarity and language quality. After using this tool, the authors reviewed and edited the content as needed and take full responsibility for the content of the published article.