
Table 1
Summary of the key material properties used in experiments and numerical models.
| Component | Material specification | Key properties |
|---|---|---|
| Embankment fill | AASHTO granular subbase A‑2‑4 | Max particle size: 37.5 mm; PI < 12; CBR > 15% |
| Compaction standard | Mod AASHTO | Minimum 95% density |
| LDS | Reinforced concrete (Grade 30 MPa) | Compressive strength: 30 MPa; Thickness: 250 mm |
| Reinforcement | Y12 bars @ 200 mm c/c (both directions) | Yield strength: 450 MPa; Cover: 40 mm |
| Geotextile layer | Non-woven polypropylene | Permittivity ≥0.8 s⁻1; Tensile strength ≥15 kN/m |
Source: Author’s contribution.
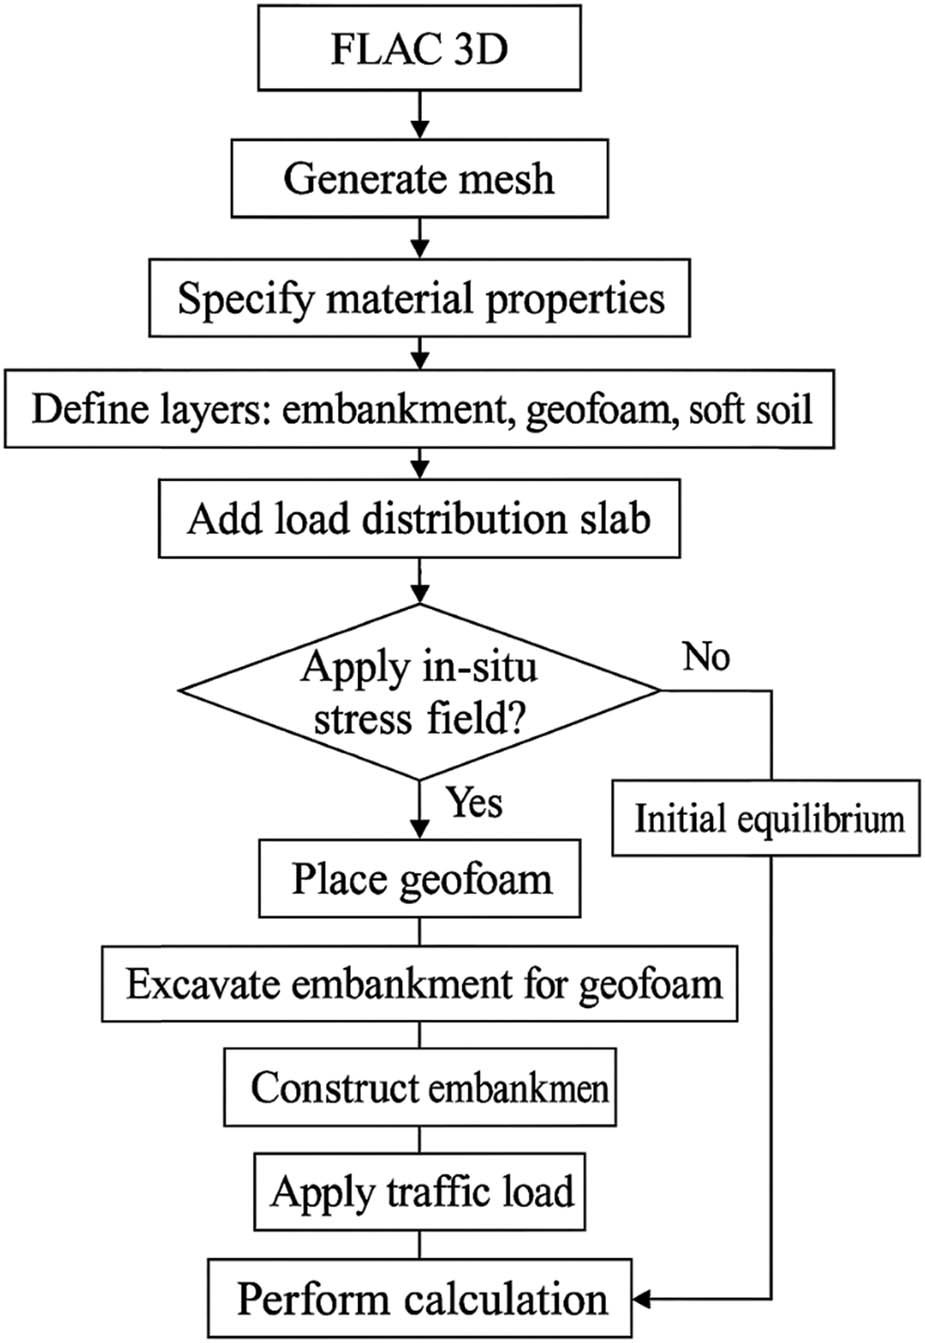
Figure 1
Flowchart modelling procedures.
Source: Author’s contribution.
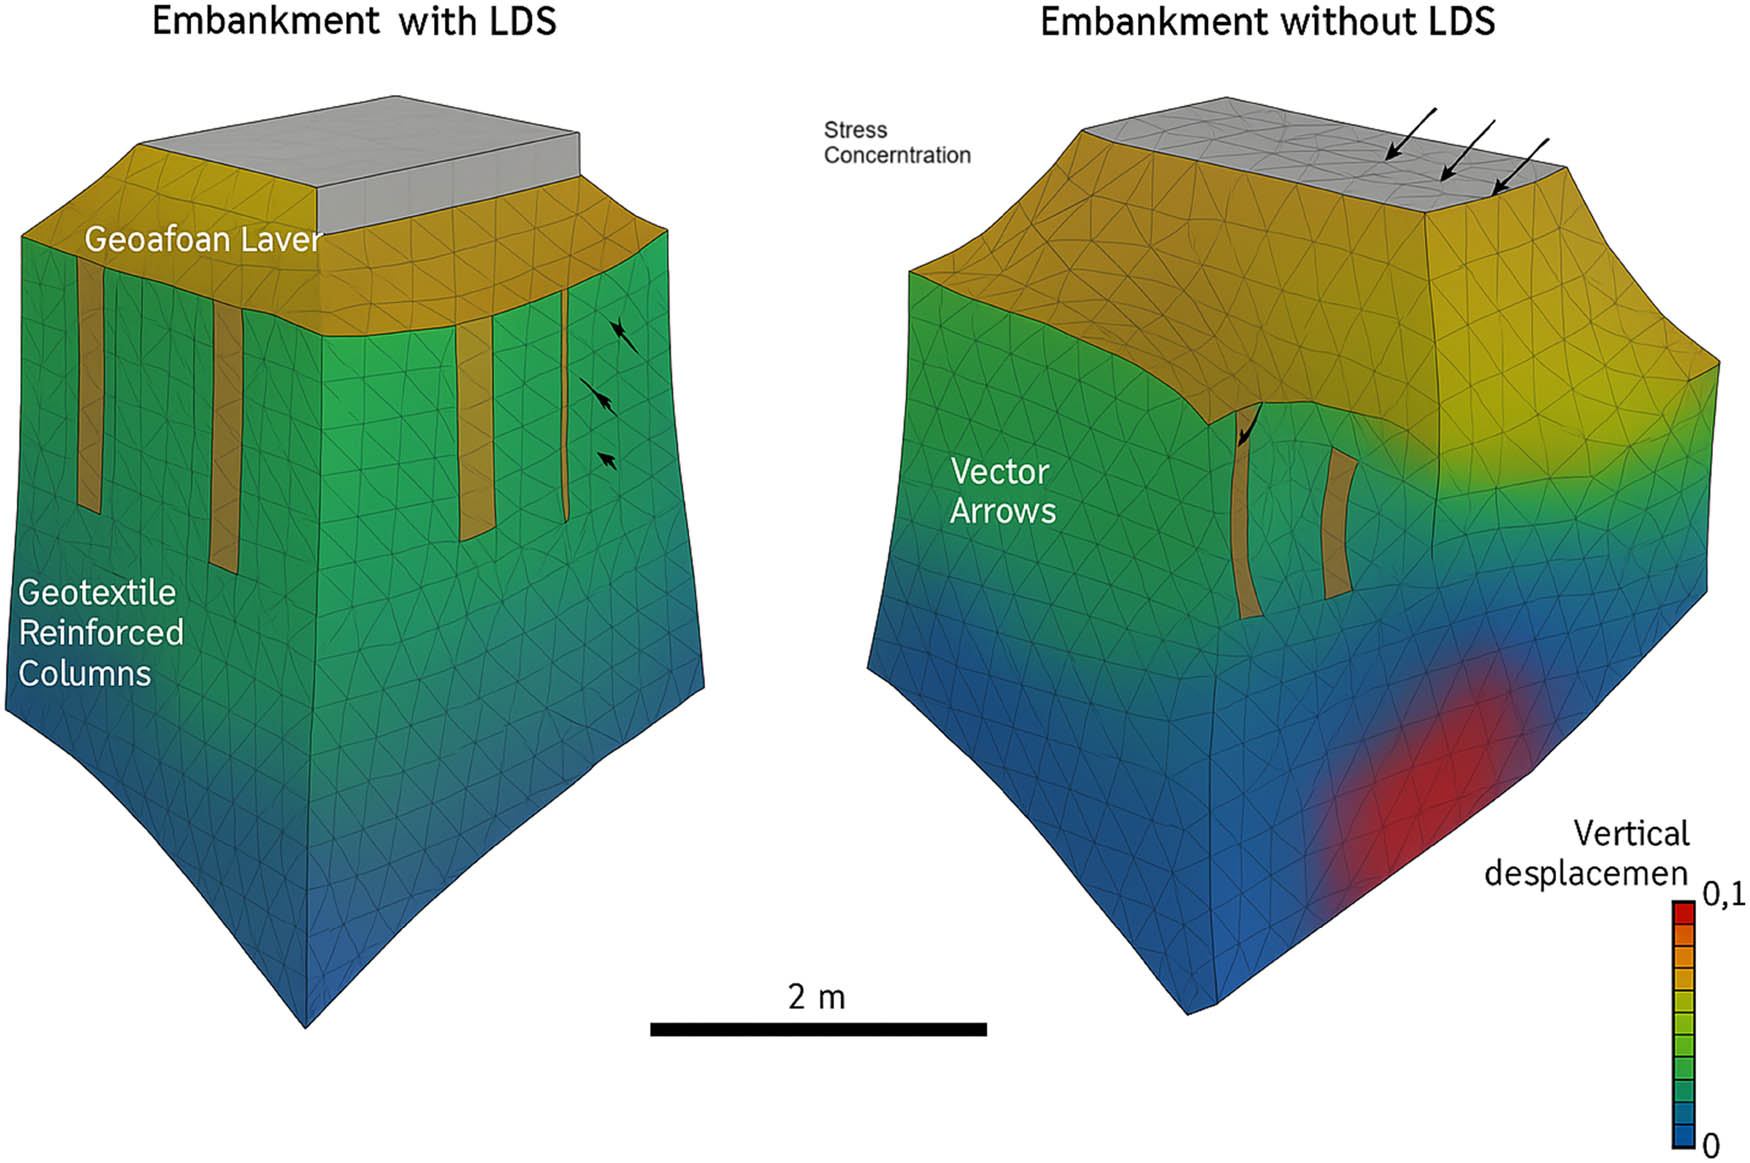
Figure 2
Meshing of modelled road embankments with and without LDS.
Source: Author’s contribution.
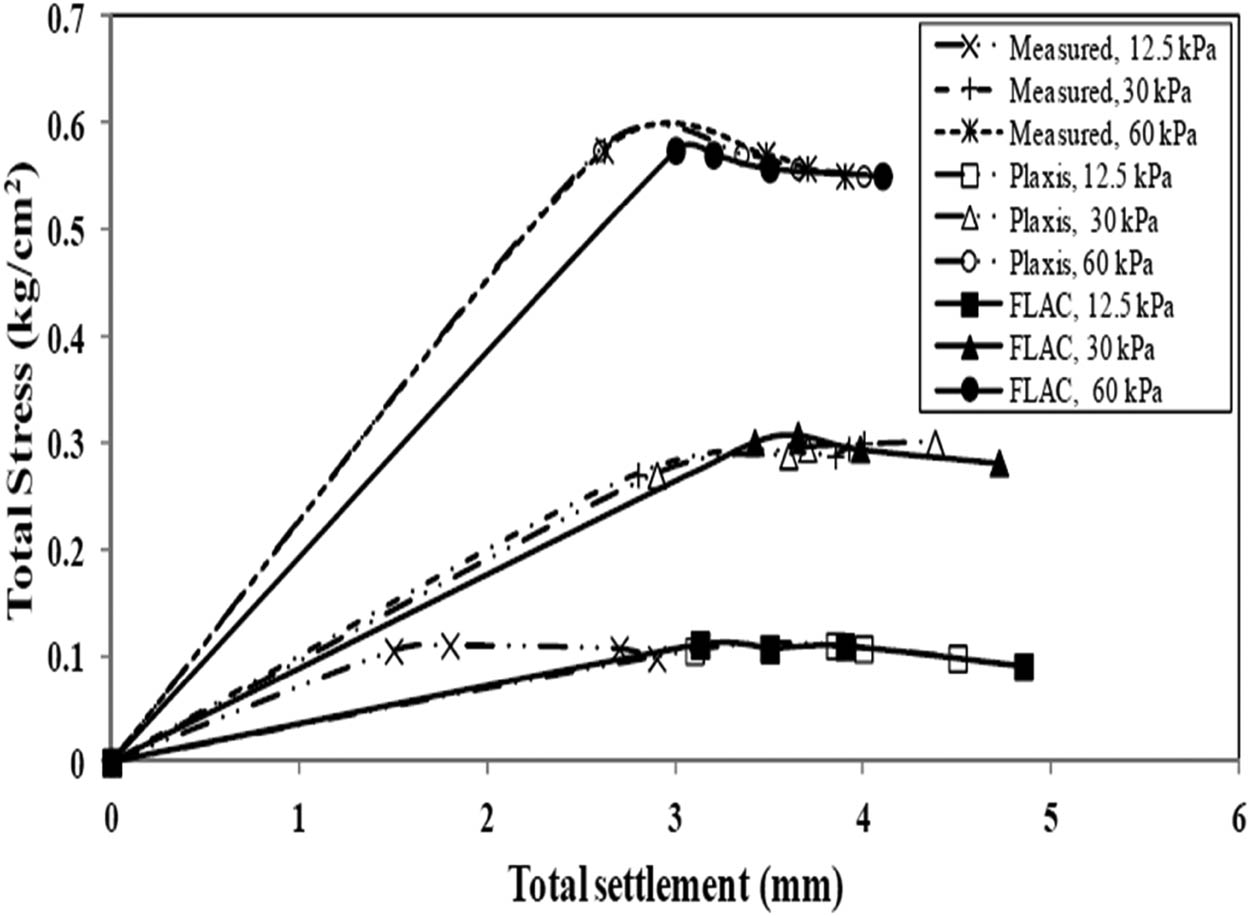
Figure 3
Laboratory and simulated stress–strain response of EPS geofoam.
Source: Han and Gabr, 2002.
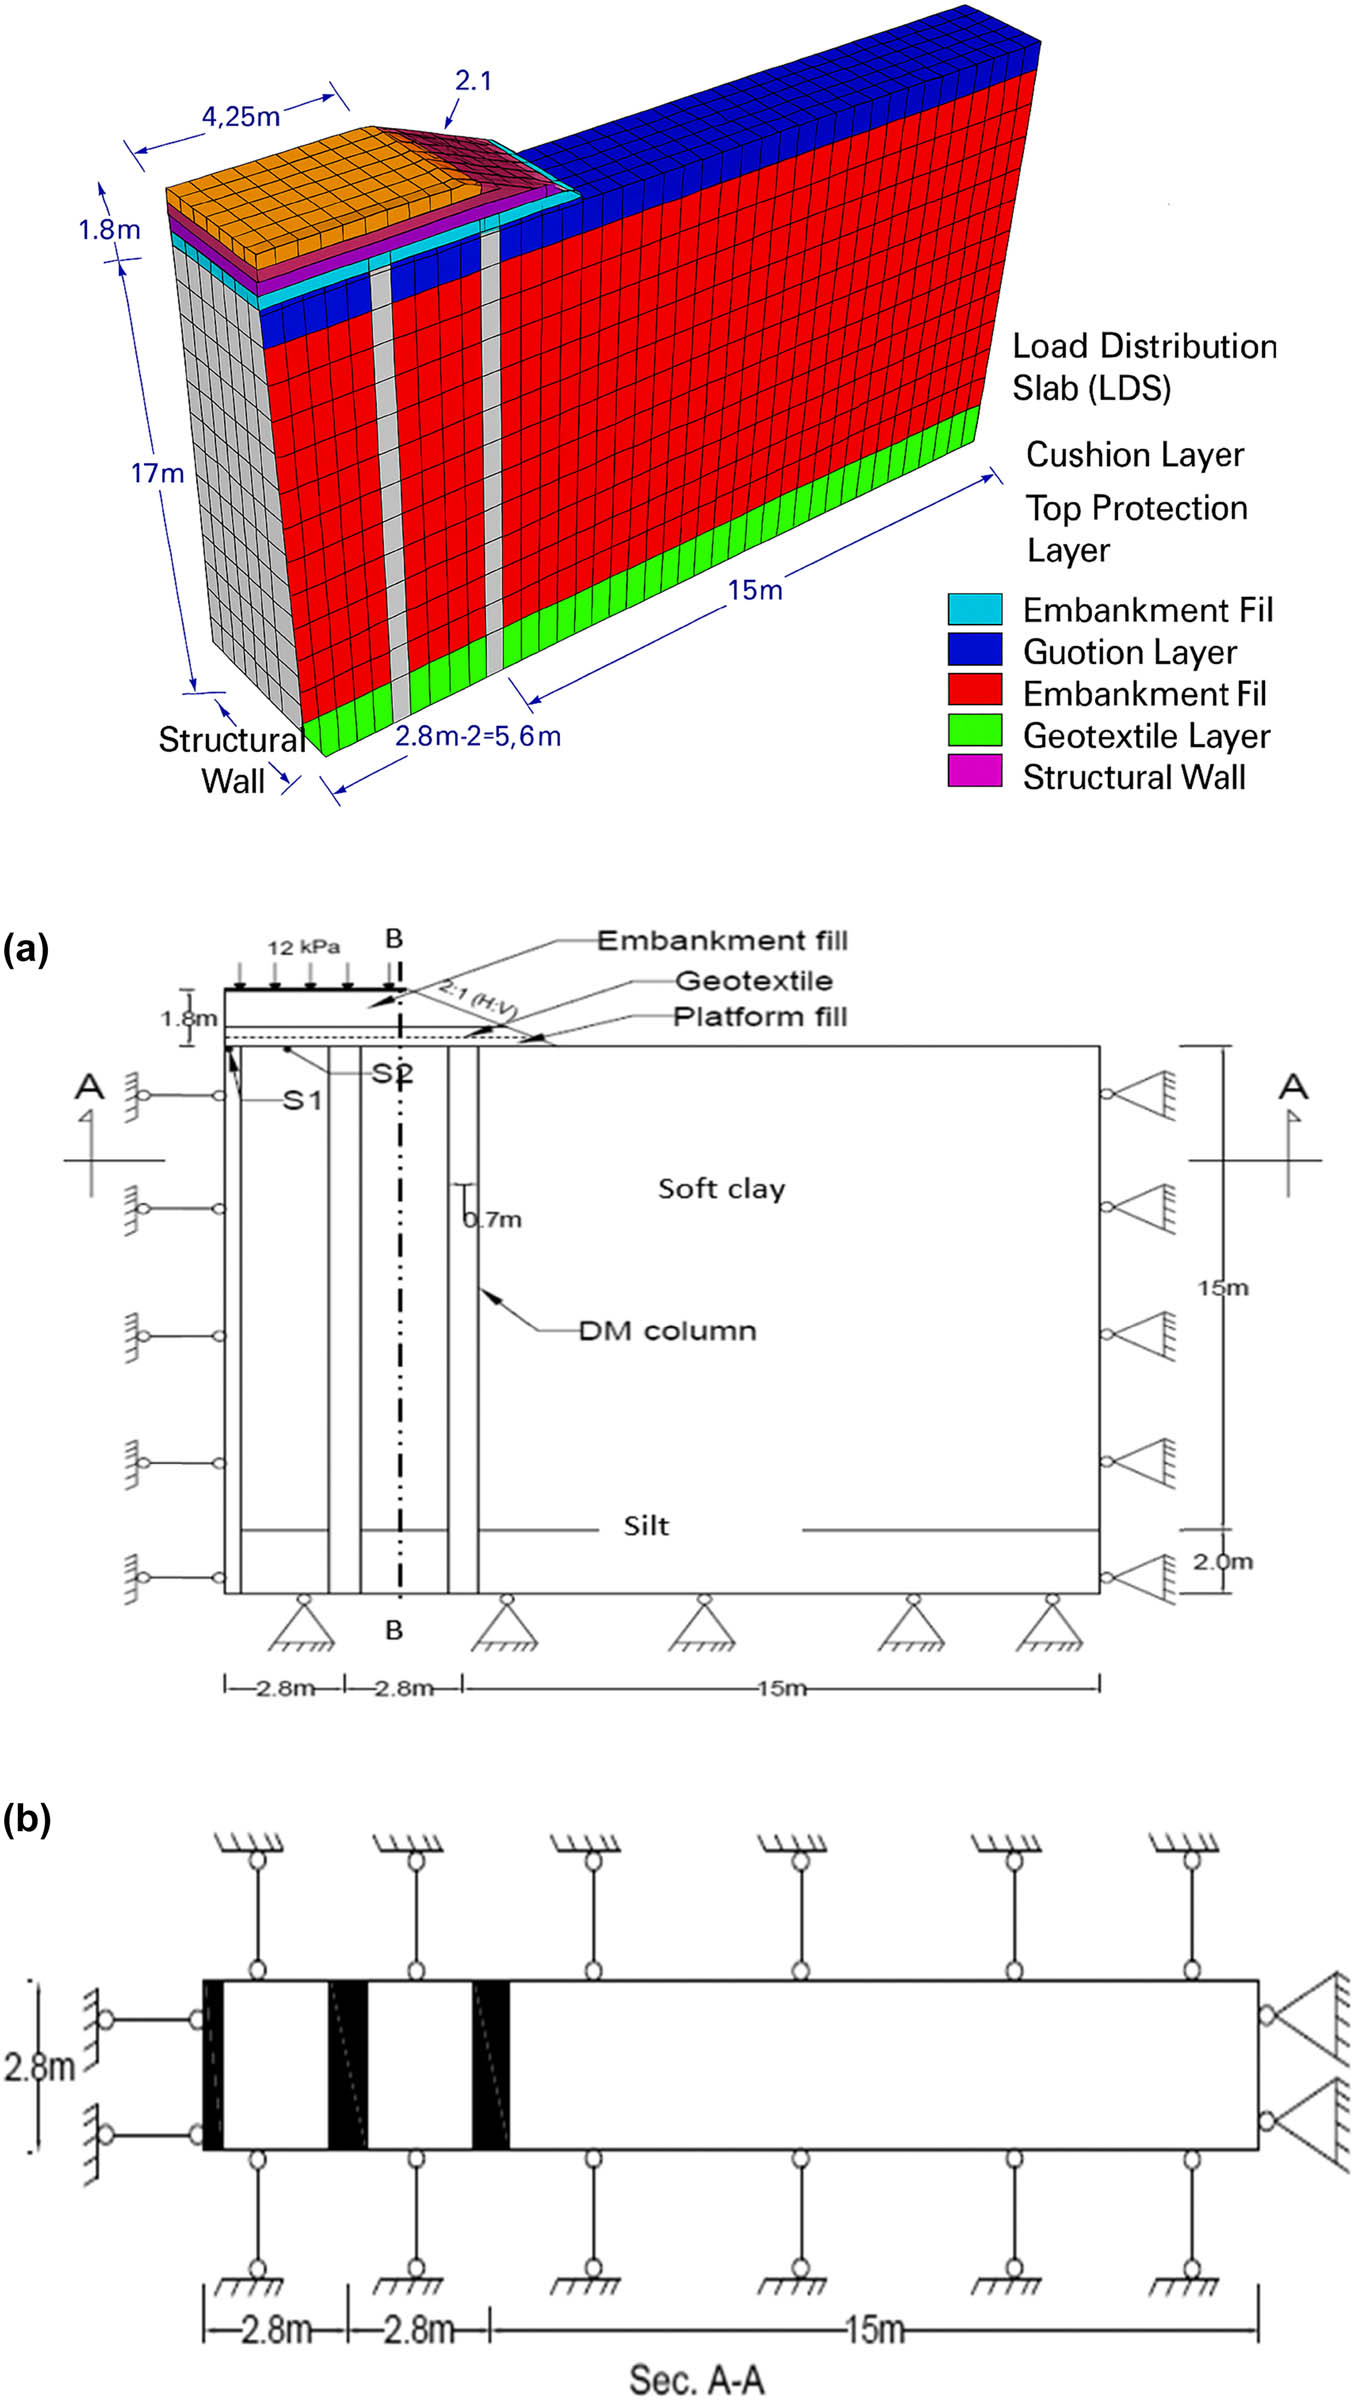
Figure 4
3D model of the embankment and layout of DM columns. (a) Dimension and boundary conditions in the 3D numerical model section. (b) Dimension and boundary conditions in the 3D numerical model section A–A.
Source: Author’s contribution.
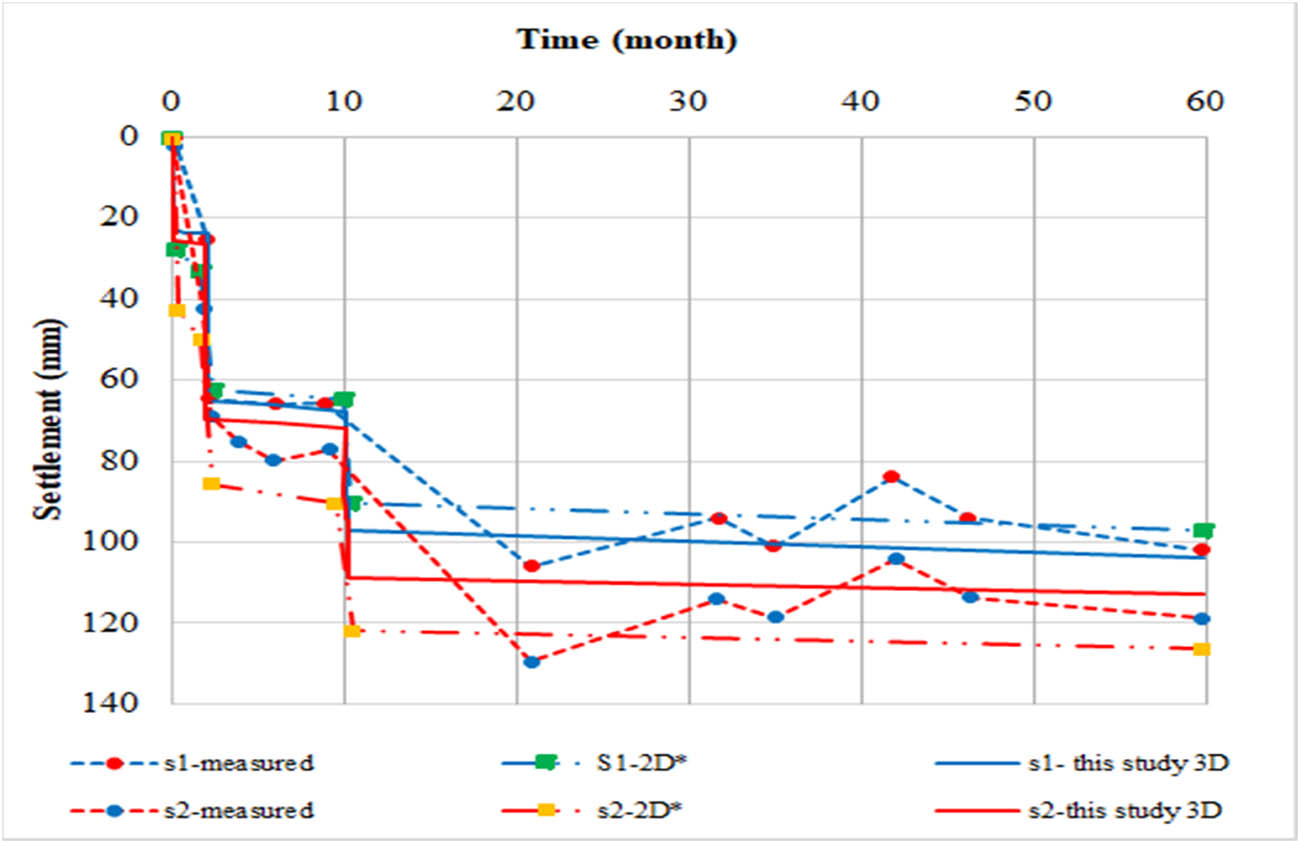
Figure 5
Analysis of measured and calculated values for settlement–time curves [9].
Source: Author’s contribution.
Table 2
Properties of soft clay, silt, fill, DM walls, and geofoam.
| Parameters | Symbol | Soft clay | Platform fill | Embankment fill | DM walls | Geofoam EPS15 | Geotextile |
|---|---|---|---|---|---|---|---|
| Soil model | MC* | MC* | MC* | Elastic | Plastic | Elastic | |
| Bulk modulus (GPa) | K | 1.1 | 19.6 | 39.2 | 25.0 | — | — |
| Shear modulus (GPa) | G | 0.25 | 75.2 | 15 | 11.5 | 0.00257 | — |
| Friction angle (°) | ϕ | 12 | 32 | 38 | 6.3 | — | — |
| Cohesion (kPa) | c′ | 26 | 18 | 14 | — | 4.26 | — |
| Dry density (kN/m3) | γ d | 16.18 | 19.18 | 18.54 | — | 0.155 | — |
| Compression index | C c | 1.14 | 0.01 | 0.028 | — | 0.00032 | — |
| Coefficient of consolidation (m2/year) | C v | 0.22 | 3.25 | 2.58 | — | 3.35 | — |
| Coefficient of volume compressibility, (m2/kN) | m v | 1.5 × 10⁻³ | 0.05 × 10⁻³ | 0.054 × 10⁻³ | — | 0.033 × 10⁻³ | — |
| Tensile stiffness of geotextile (kN/m) | J | — | — | — | — | — | 1,700 |
| Coupling stiffness of geotextile (MPa/m3) | k | — | — | — | — | — | 2.3 |
| Coupling friction angle (°) | c i | — | — | — | — | — | 5 |
| Elastic modulus (MPa) | E s | — | — | — | — | 12 | |
| Viscosity (Pa s) | () | — | — | — | — | — | 1 × 10¹¹ |
Source: Author’s contribution.
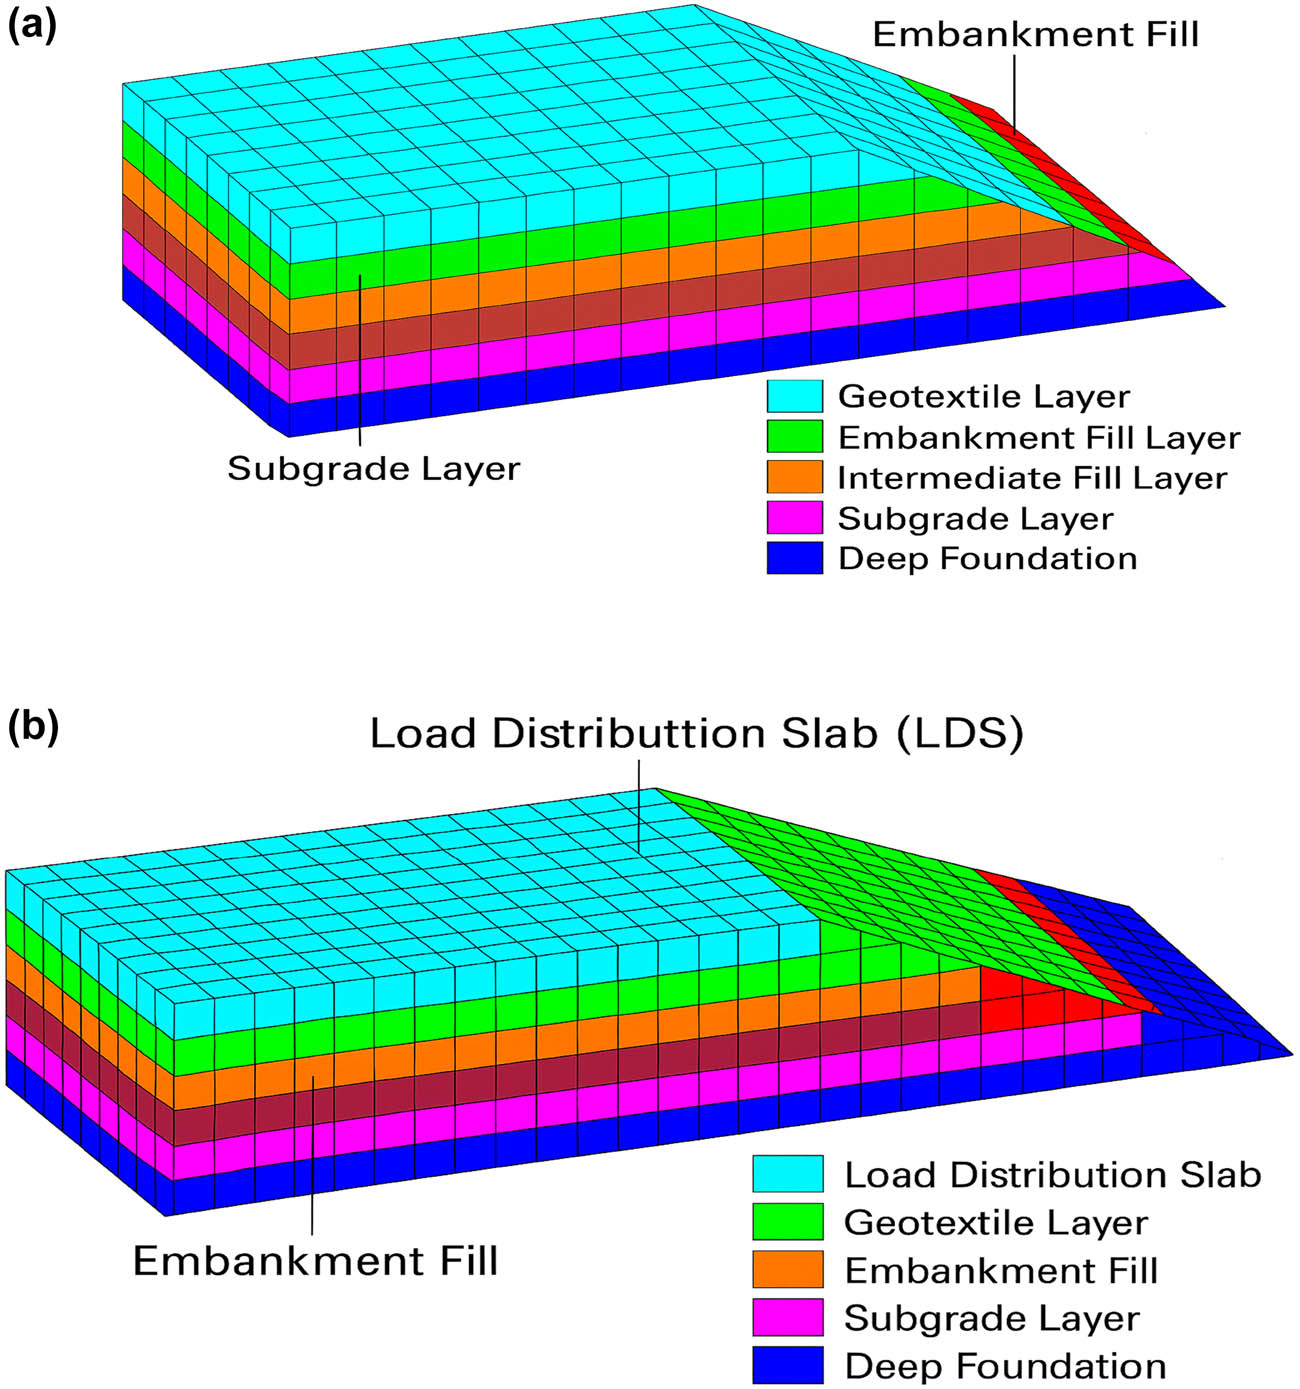
Figure 6
(a) Without LDS, Case A. (b) With LDS, Case B.
Source: Author’s contribution.
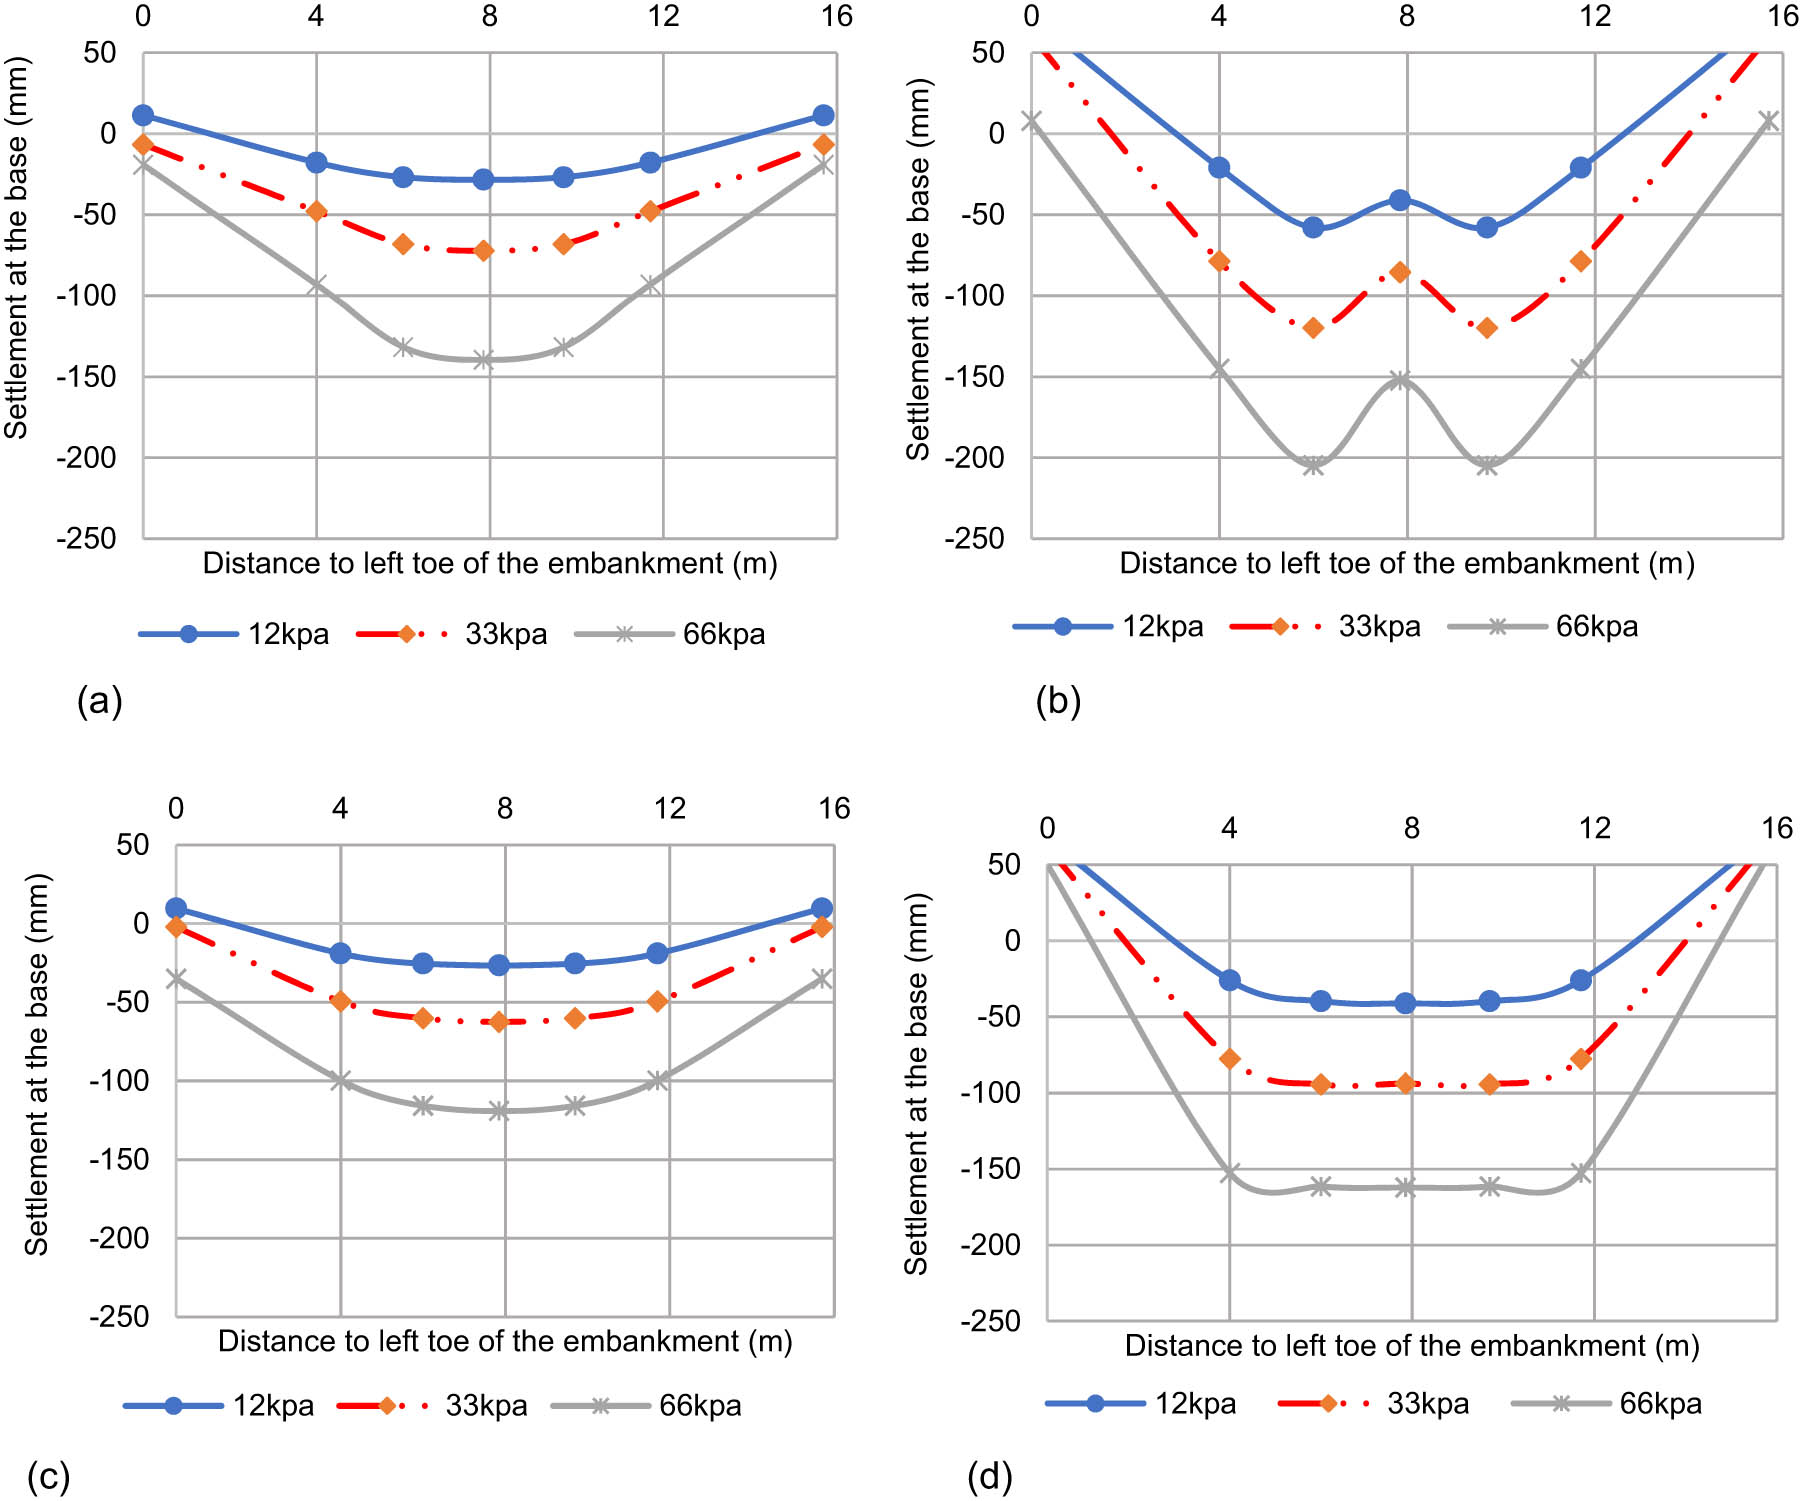
Figure 7
Settlement profile at the base of the embankment with EPS geofoam: (a) Without LDS immediately after the construction, (b) without LDS at the end of consolidation, (c) with LDS immediately after the construction, and (d) with LDS at the end of consolidation.
Source: Author’s contribution.
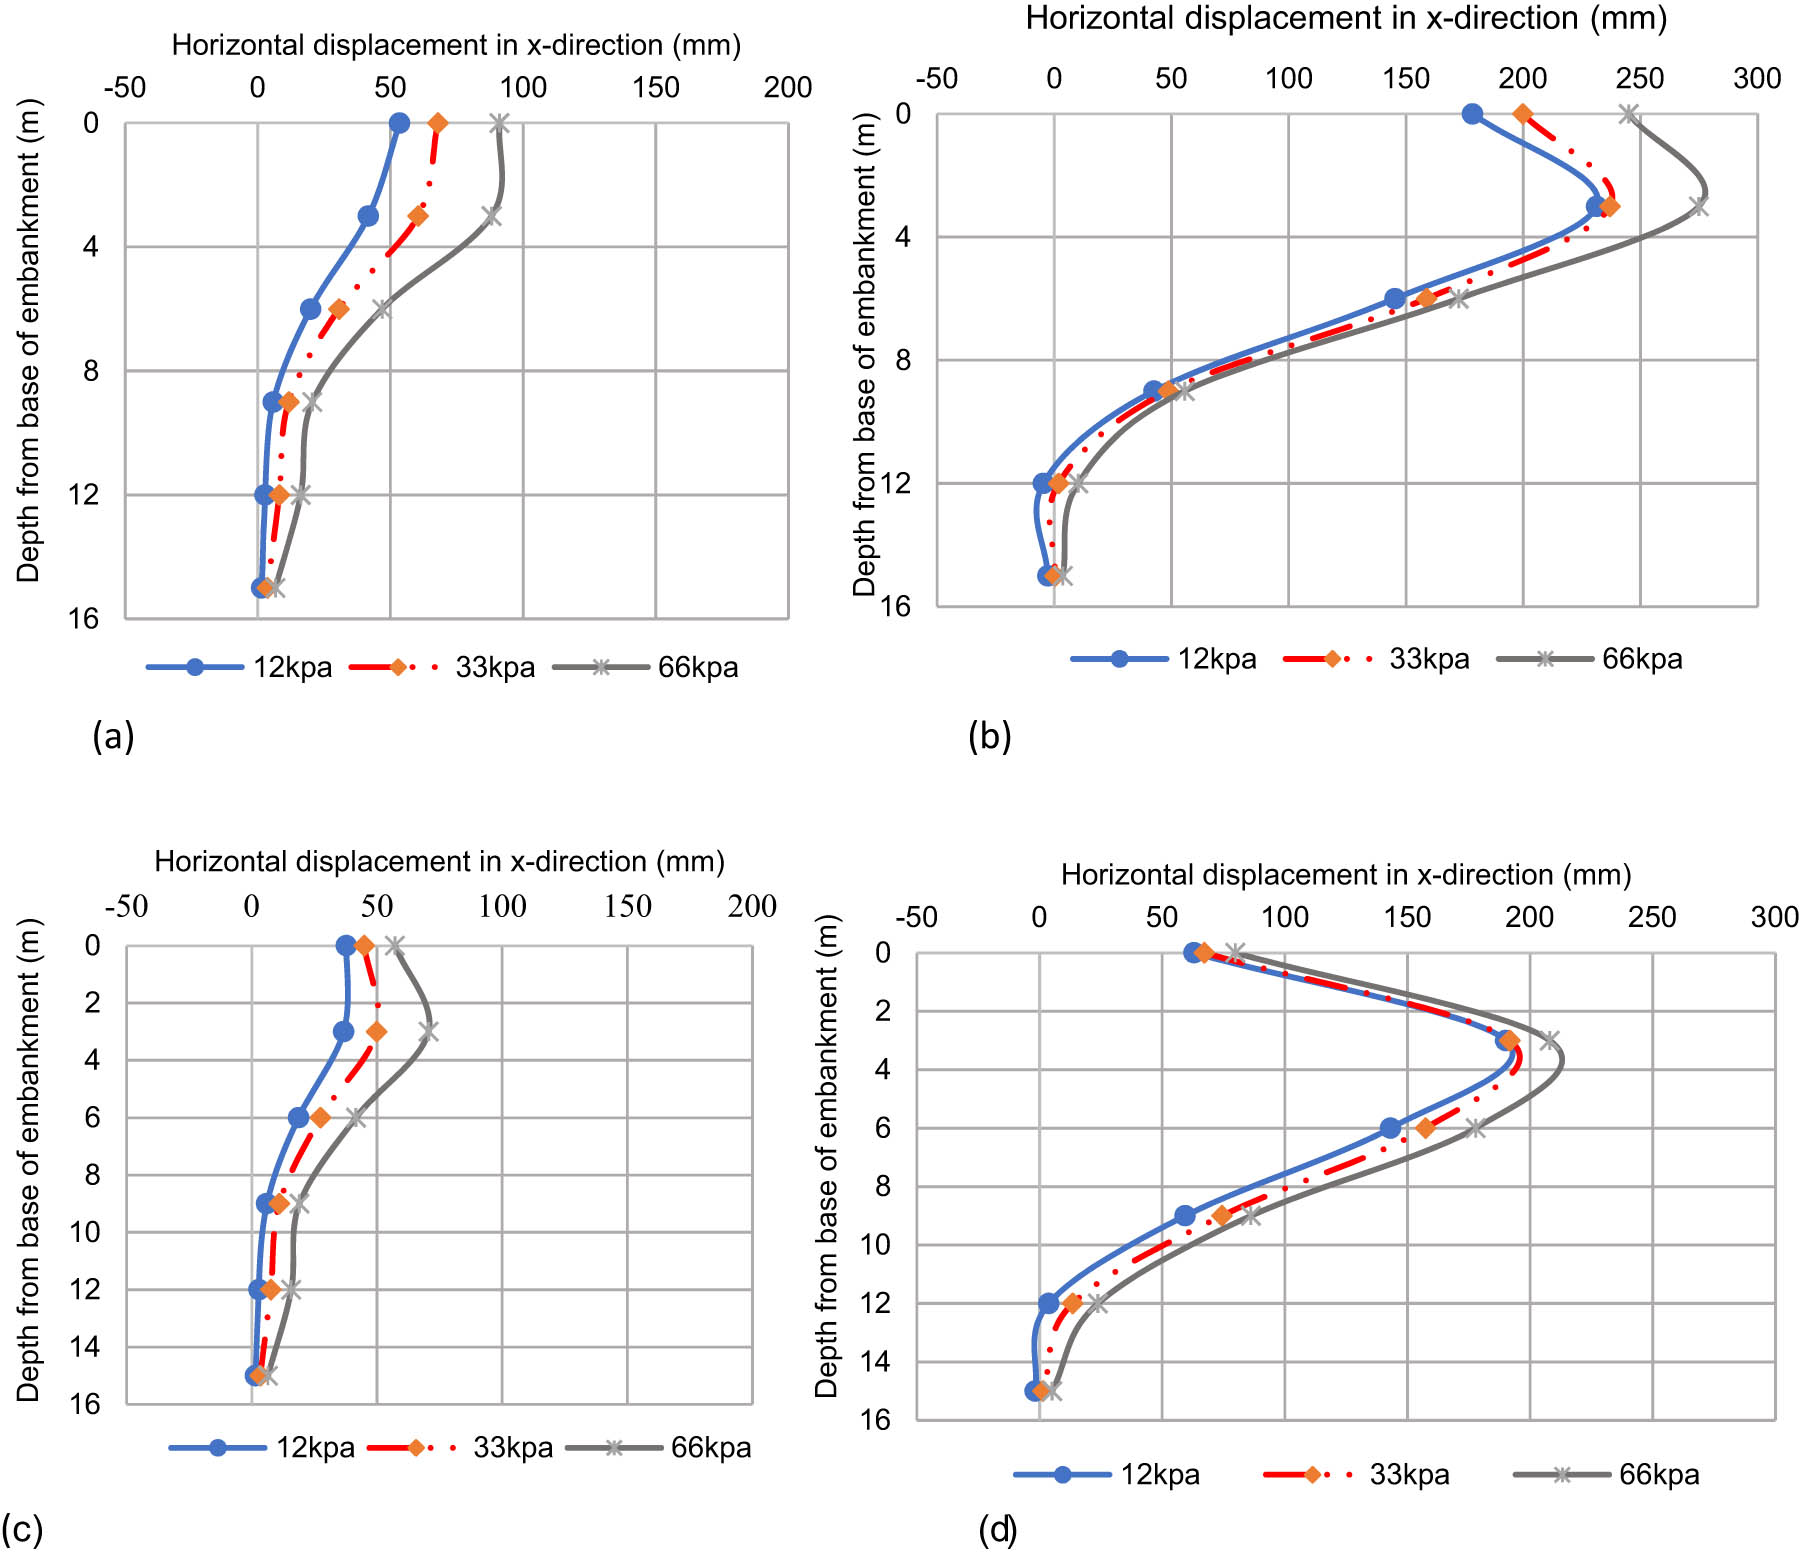
Figure 8
Horizontal displacements below the embankment with EPS geofoam: (a) Without LDS immediately after the construction, (b) without LDS at the end of consolidation, (c) with LDS immediately after the construction, and (d) with LDS at the end of consolidation.
Source: Author’s contribution.
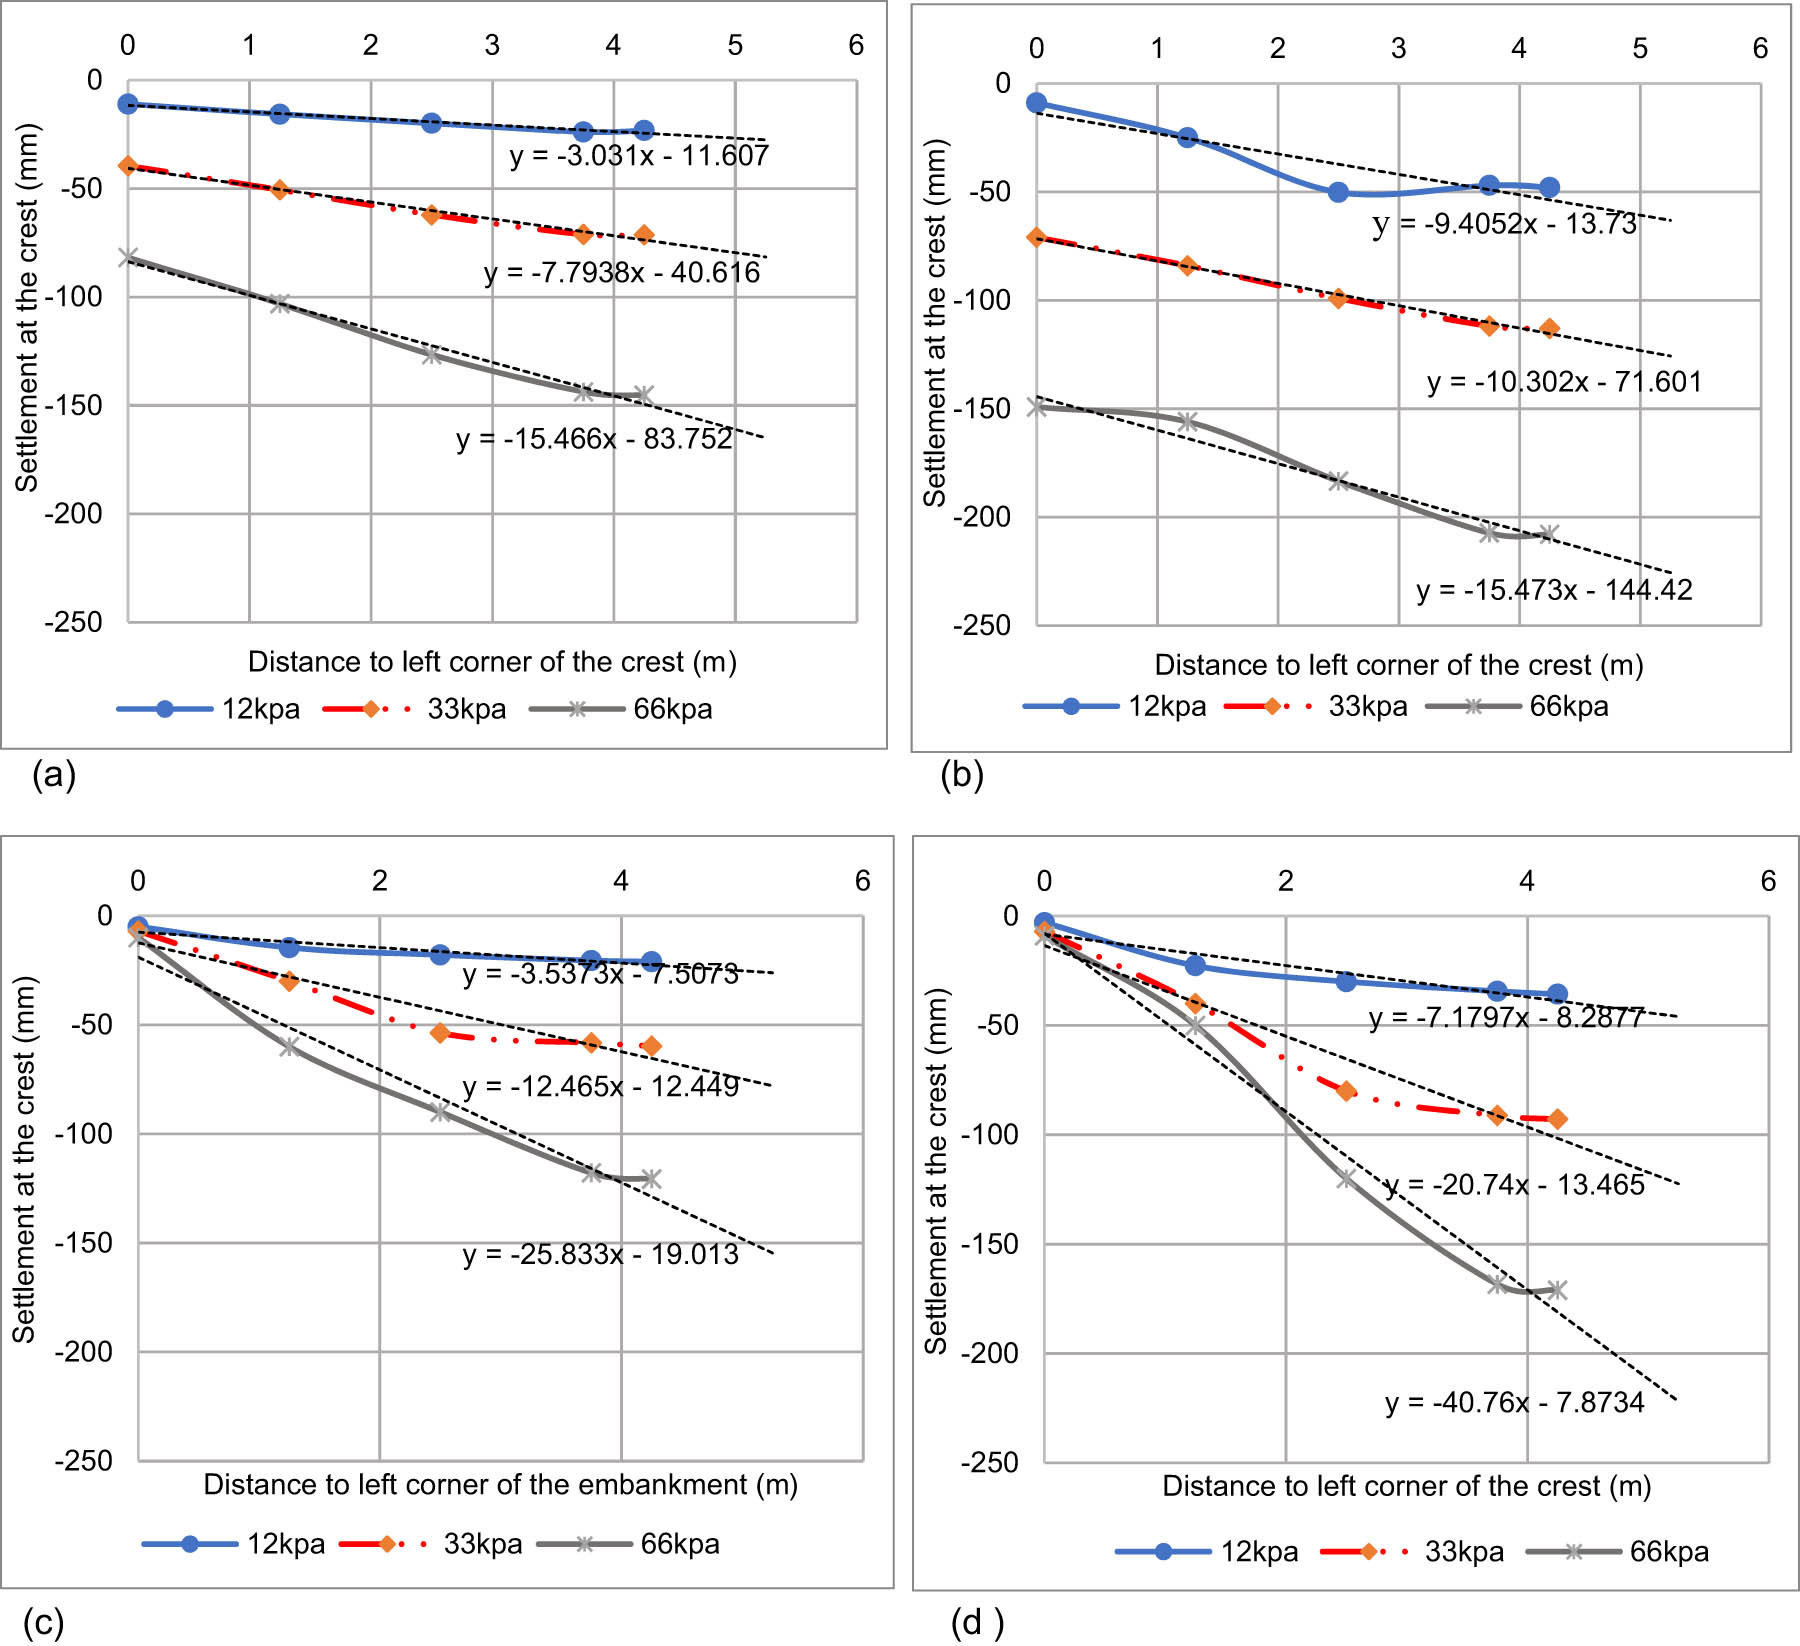
Figure 9
Transverse gradient change of the embankment with EPS geofoam: (a) Without LDS immediately after the construction, (b) without LDS at the end of consolidation, (c) with LDS immediately after the construction, and (d) with LDS at the end of consolidation.
Source: Author’s contribution.
Table 3
Transverse gradient change (%).
| Unit | Case | |||||||||||
|---|---|---|---|---|---|---|---|---|---|---|---|---|
| A (after construction immediately) | A (after the end of consolidation) | B (after construction immediately) | B (after the end of consolidation) | |||||||||
| (kPa) | 12 | 33 | 66 | 12 | 33 | 66 | 12 | 33 | 66 | 12 | 33 | 66 |
| (%) | 0.30 | 0.78 | 1.5 | 0.94 | 1.3 | 1.5 | 0.19 | 0.39 | 0.65 | 0.39 | 0.49 | 0.53 |
Source: Author’s contribution.
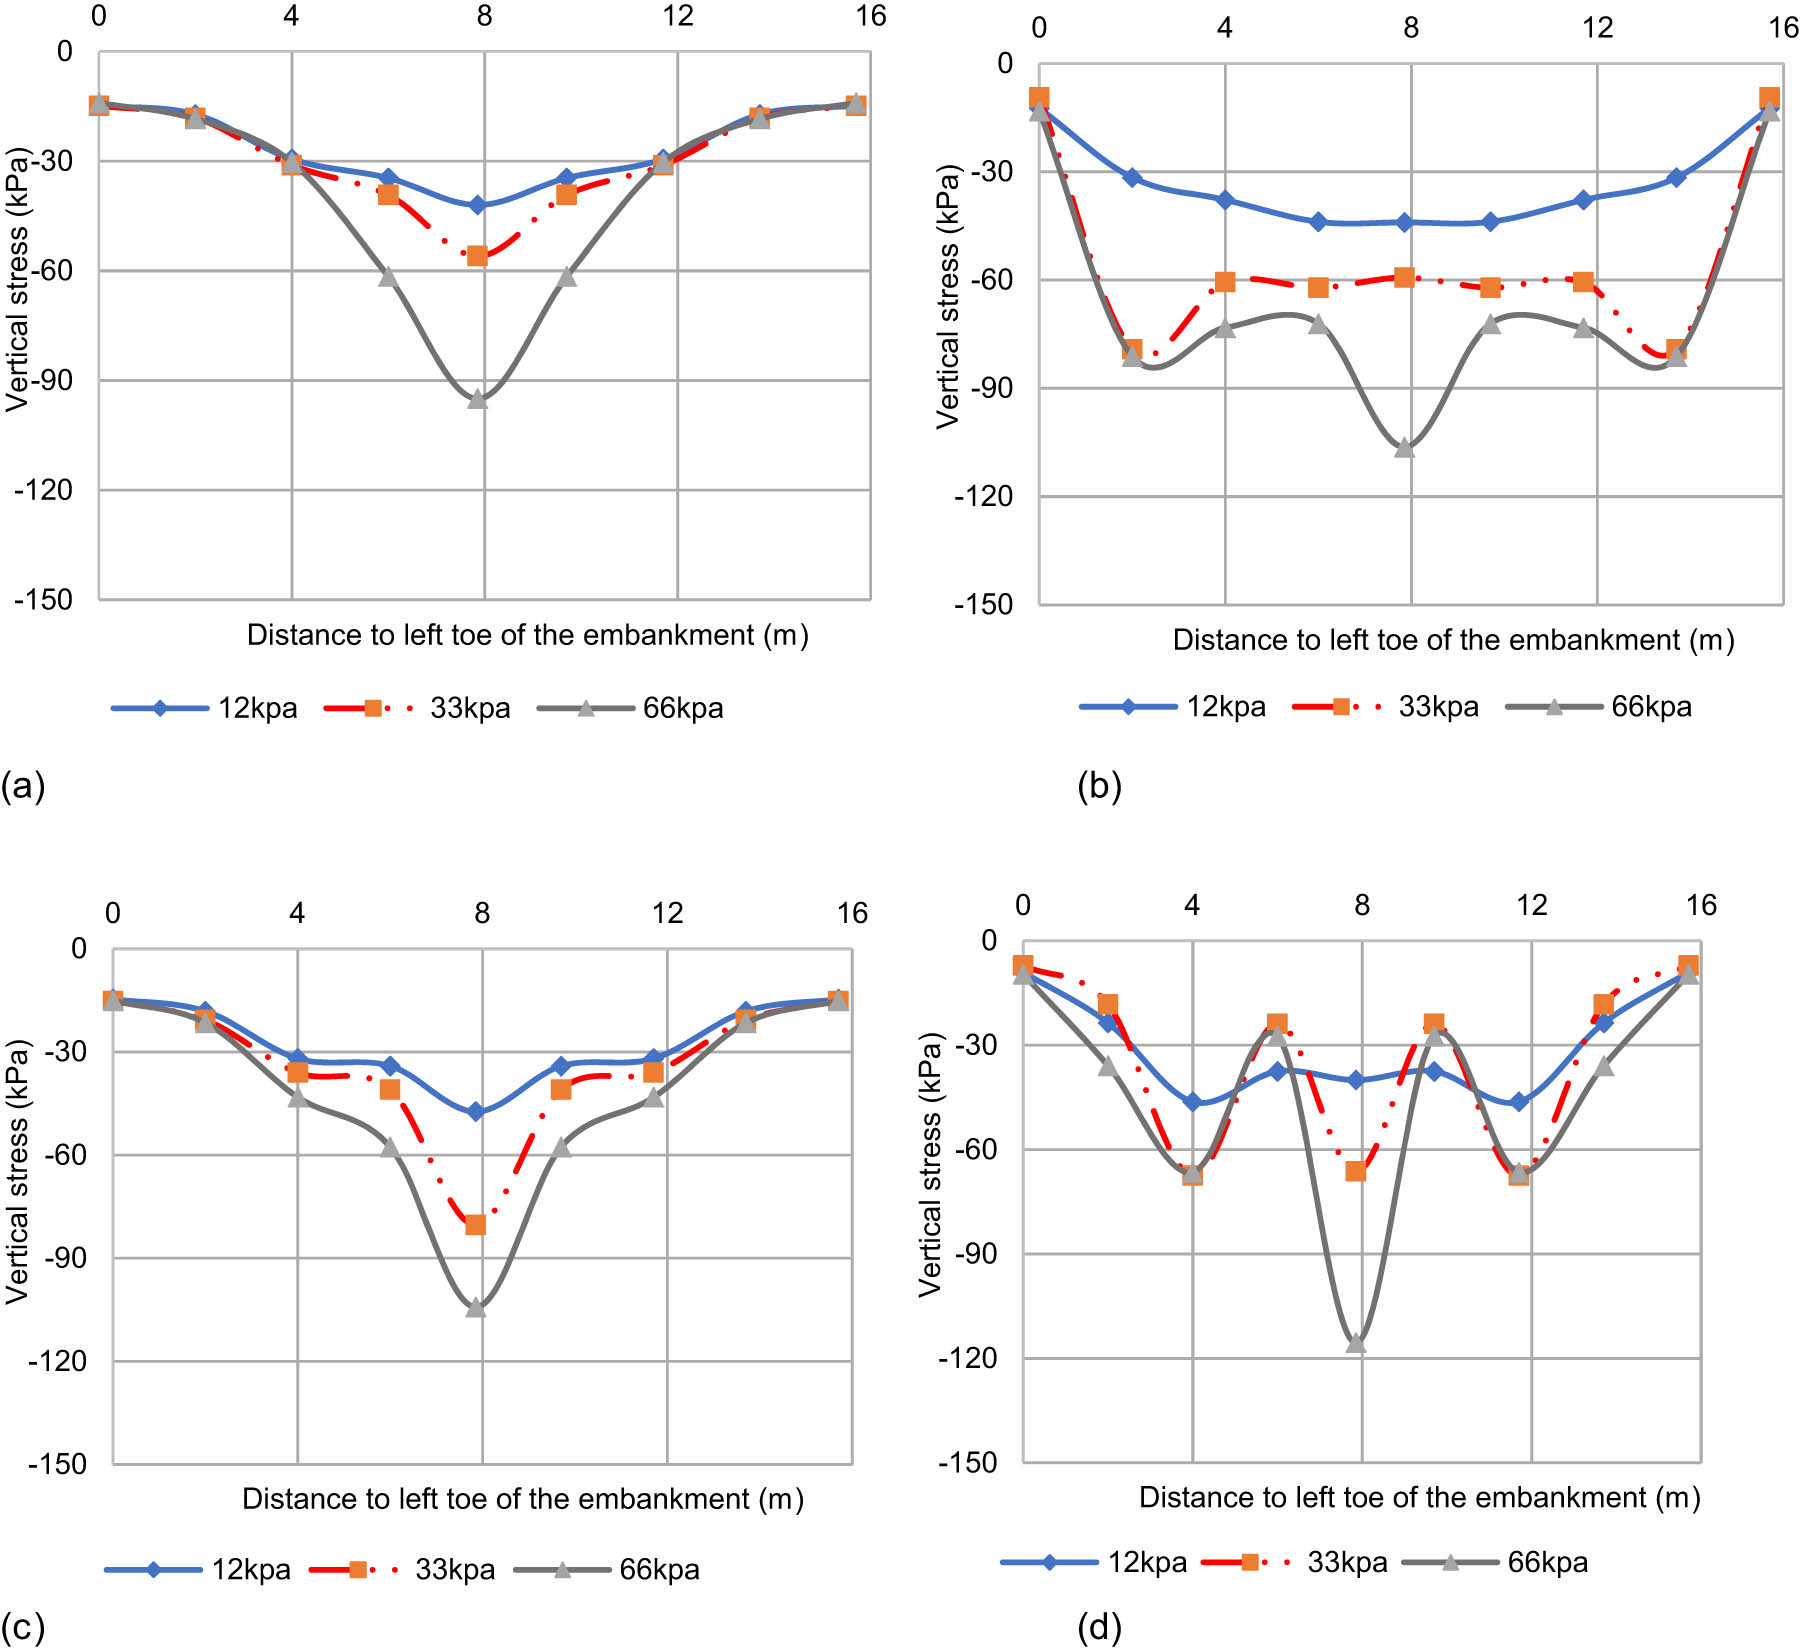
Figure 10
Vertical stress of the embankment with EPS geofoam below the base: (a) Without LDS immediately after the construction, (b) without LDS at the end of consolidation, (c) with LDS immediately after the construction, and (d) with LDS at the end of consolidation.
Source: Author’s contribution.