
1. Introduction
In South Africa’s arid regions, geotechnical engineers frequently confront issues associated with inherently weak embankments [1]. Even under moderate loading, these soils can undergo significant settlement, exhibit low shear resistance, and demonstrate limited bearing capacity, which detrimentally affects pavement performance [2]. Pavements overlaying such embankments are prone to large settlement, a direct consequence of clay soils’ low strength and high compressibility [3]. A common practice to remedy these challenges is installing stone columns in soft clays. This method partially substitutes unsatisfactory native material with a dense, highly permeable granular aggregate. Such reinforcement enhances the soil’s load-bearing capacity, reduces the settlement magnitude, and accelerates the consolidation process.
Moreover, geotextile‐reinforced column-supported (GRCS) embankments have emerged as a dependable method for supporting road and railway structures on soft foundations and widening existing roadways [4,5]. In these systems, the columns convey the surcharge, and embankment loads from the pavement surface to a stiffer underlying stratum. This load transfer mechanism allows for integrating a broad range of deep foundation solutions, where engineers may choose between rigid or flexible column types based on the site’s specific geotechnical conditions. One of the principal advantages of utilising GRCS is its versatility; there is no limitation to a single kind of column, granting flexibility in the selection process to optimise performance. Furthermore, various approaches have been proposed to enhance the effectiveness of granular columns further, ensuring improved load distribution and overall system stability [6].
Under vertical loading conditions, granular piles commonly exhibit failure modes such as bulging, sliding, and general shear [7]. This behaviour is primarily attributed to the surrounding soil’s inadequacy in providing sufficient lateral support under compressive forces, resulting in granular piles not reaching their intended load-bearing capacity in soft embankments. To address these limitations, geosynthetic encasement of granular piles is employed, which increases stiffness and minimises bulging by harnessing the development of hoop stresses in the reinforcement material [8]. To further enhance lateral resistance and improve horizontal confinement, the upper section of each granular column is often reinforced with a steel skirt, while horizontal layers of geogrid are added [9,10]. This reinforcement strategy not only counters sliding and shear failures by bolstering lateral stability but also enhances the load carrying capacity and restrains bulging through increased friction between the geosynthetic elements and the stone aggregates when implemented as regularly spaced horizontal strips. Researchers have also proposed the use of concrete plugs and cement grout to limit the lateral expansion of granular columns, asserting that these measures provide the necessary lateral confining pressure and elevate bearing capacity by effectively forming geosynthetic-encased granular columns (GEGCs) [11,12].
While experimental models have examined vertically encased, end-bearing granular piles reinforced with geotextile or geogrid, these studies primarily focused on the mechanical aspects of GEGCs, often overlooking the detailed reinforcement mechanisms provided by the geosynthetics [13]. In contrast, deep mixed (DM) geosynthetic-supported columns exhibit lower settlement than geofoam-reinforced embankments. When combined with an overlay of geofoam, their performance is closely tied to the geofoam material’s modulus of elasticity and stiffness. Rojimol and Umashankar [14] concluded that open joint expanded polystyrene (EPS) blocks can contribute to excessive settlement, particularly when geofoam is placed directly over weak embankments without a load distribution slab (LDS).
This study hypothesised that the incorporation of high-strength geofoam to laterally confined geotextile-reinforced columns (GRCs) in soft embankments is hypothesised to enhance stability by mitigating excessive settlement and lateral displacement. It is further hypothesised that coupling this configuration with an LDS will produce a more uniform stress distribution, thereby reducing deflection and improving pavement stiffness under cyclic loading across various stress levels. The combined use of geofoam and LDS is expected to outperform conventional GRC-supported systems by ensuring long-term structural performance and deformation control under repeated load applications.
Drawing on an extensive review of current research, this study examines how induced stresses affect settlement, vertical stress distribution, and lateral displacement in GRCS systems, both with and without the incorporation of an LDS. The objective is to understand the behaviour of these systems under different loading conditions, as various induced stresses can significantly influence the performance of soft embankments. The research employs three-dimensional numerical modelling using the modified Cam-Clay (MCC) framework to achieve this. This approach facilitates an evaluation of the shear strength and consolidation behaviour of weak soil embankments, capturing the intricate interactions between the reinforced columns and the surrounding soil. By integrating the MCC model into the analysis, the study quantifies key parameters, such as the apparent shear strength and settlement characteristics, necessary to design and optimise GRCS systems. This modelling effort sheds light on how reinforcement strategies and additional load distribution measures can mitigate excessive settlement and improve overall stability. Ultimately, the findings aim to inform better design practices for constructing durable and stable pavements, particularly over soft soil foundations, ensuring that lateral and vertical load responses are satisfactorily managed in engineering applications.
1.1. Materials description
The embankment was constructed from a locally sourced silty sand placed in lifts and compacted to a target dry density of 95% of the modified Proctor maximum dry density. A uniform base and subbase layer beneath the pavement consisted of crushed stone with a nominal maximum particle size of 20 mm. The LDS is a reinforced concrete slab placed directly above the subbase to spread wheel loads; the slab was modelled and tested as a plain reinforced concrete element with a thickness of 150 mm, a mean compressive strength f’c = 30 MPa at 28 days, and a Young’s modulus Ec = 25 GPa. The LDS reinforcement consisted of two layers of steel mesh (top and bottom) with 10 mm diameter bars at 200 mm spacing, giving an estimated reinforcement ratio of 0.45% by area. Unit weights and stiffnesses used in numerical models were embankment fill γ = 18 kN/m3, subbase γ = 20 kN/m3, and LDS γ = 24 kN/m3. For geotechnical stiffness the embankment was represented by an elastic modulus Efill = 25 MPa (compacted silty sand), and the subbase Esubbase = 150 MPa. These values reflect the results of in situ density tests, laboratory Proctor and compressive-strength tests carried out as part of the project. The LDS design and material properties used in this analyses and reporting are summarised in Table 1. Beneath the slab, a non-woven geotextile separation layer was installed to prevent migration of fines and maintain drainage integrity. These specifications were selected to optimise the load-bearing capacity, minimise differential settlement, and enhance long-term durability under varying traffic and environmental conditions.
Table 1
Summary of the key material properties used in experiments and numerical models.
| Component | Material specification | Key properties |
|---|---|---|
| Embankment fill | AASHTO granular subbase A‑2‑4 | Max particle size: 37.5 mm; PI < 12; CBR > 15% |
| Compaction standard | Mod AASHTO | Minimum 95% density |
| LDS | Reinforced concrete (Grade 30 MPa) | Compressive strength: 30 MPa; Thickness: 250 mm |
| Reinforcement | Y12 bars @ 200 mm c/c (both directions) | Yield strength: 450 MPa; Cover: 40 mm |
| Geotextile layer | Non-woven polypropylene | Permittivity ≥0.8 s⁻1; Tensile strength ≥15 kN/m |
Source: Author’s contribution.
1.2. Modelling procedural flowchart
Figure 1 outlines our modelling approach, which simulates the embankment-filling process through sequential undrained and drained phases. The process starts with a Start, followed by defining the geometry by creating create soil layers, inserting geofoam blocks, and placing LDS in the Itasca’s Continuum Fast Lagrangian Analysis (FLAC) 3D interface. After this phase was completed, it was followed by assign material properties such as soil (e.g. soft clay) parameters, geofoam modulus and Poisson’s ratio, and slab concrete properties. Then, mesh generation commenced with tetrahedral/hexahedral elements followed by refining mesh around slab and geofoam. The mesh generation phase was followed by boundary conditions as fix bottom nodes, roller side boundaries, and the application of initial stresses were achieved. The initial stress computation also covered the gravity loading and load application with incremental traffic and surcharge loads on the distribution slab. The time stepping and convergence, which are some of the essential steps that are needed to be completed in the procedures, were achieved by setting up the change in time, tolerance, and loop until final time. The next step, monitoring the key outputs, was achieved by evaluating the settlement under slab, stress distribution, and strain in the geofoam [15]. Also, the reinforcement trigger a signifcant settlements which greater than the limit modified by the geofoam stiffnesso were evaluated thus the steps. Therefore, the procedures continued by post-processing contour plots (displacement, stress) and extract settlement/time curves which end the procedural process.
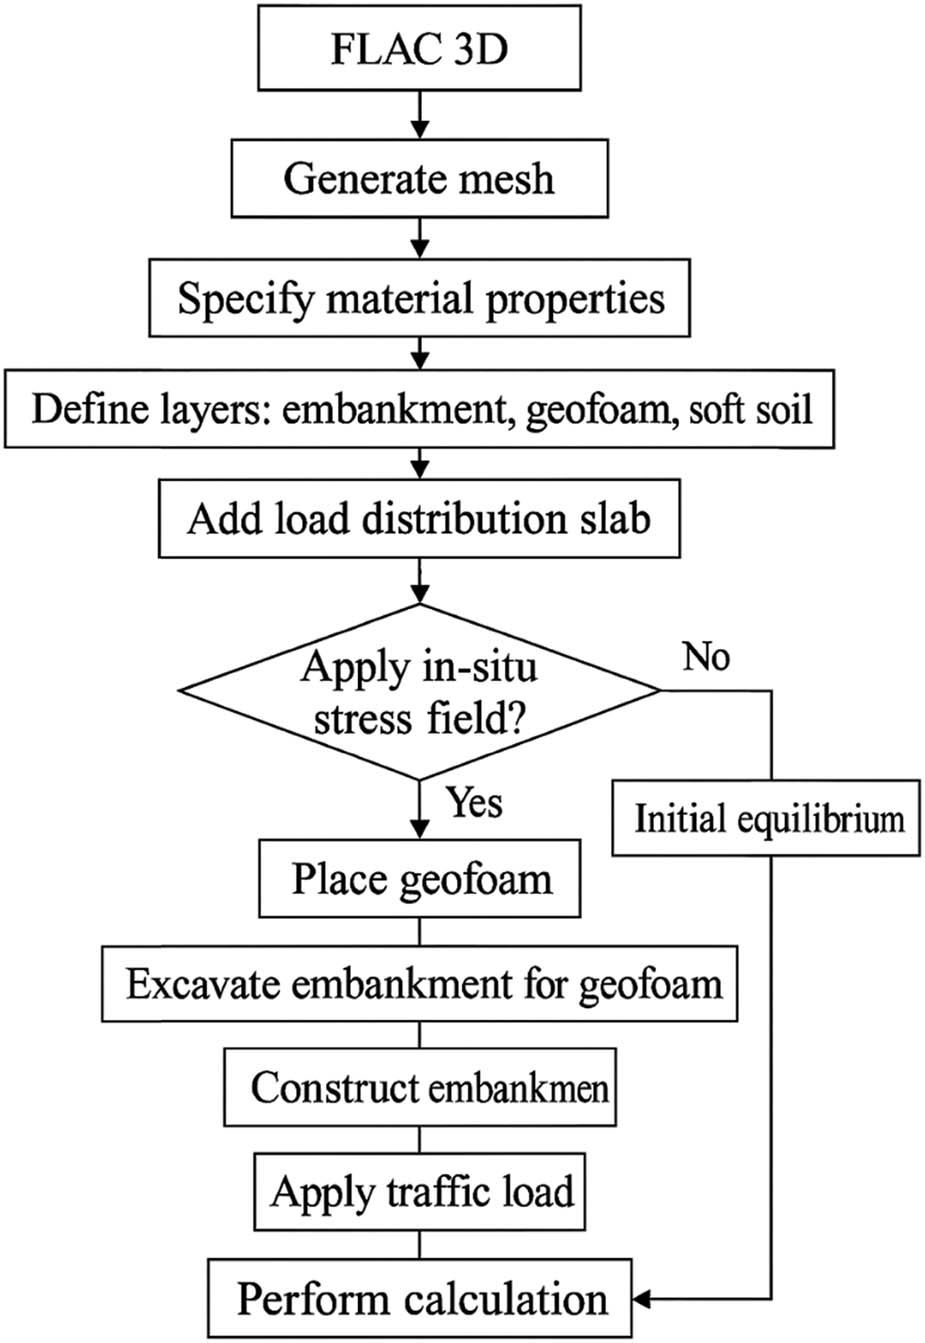
Figure 1
Flowchart modelling procedures.
Source: Author’s contribution.
2. Methodology
2.1. Developed model using the finite element method
The two embankment configurations, one with an LDS and the other without, are depicted in Figure 2. Their behaviour under varying load scenarios was evaluated using the FLAC 3D finite element package. Embankments lacking reinforcement commonly exhibit pronounced downward and outward deformation because soft subsoils offer low shear resistance and high compressibility. In these cases, loads concentrate directly beneath the applied area, triggering localised distortion and risking long-term stability.
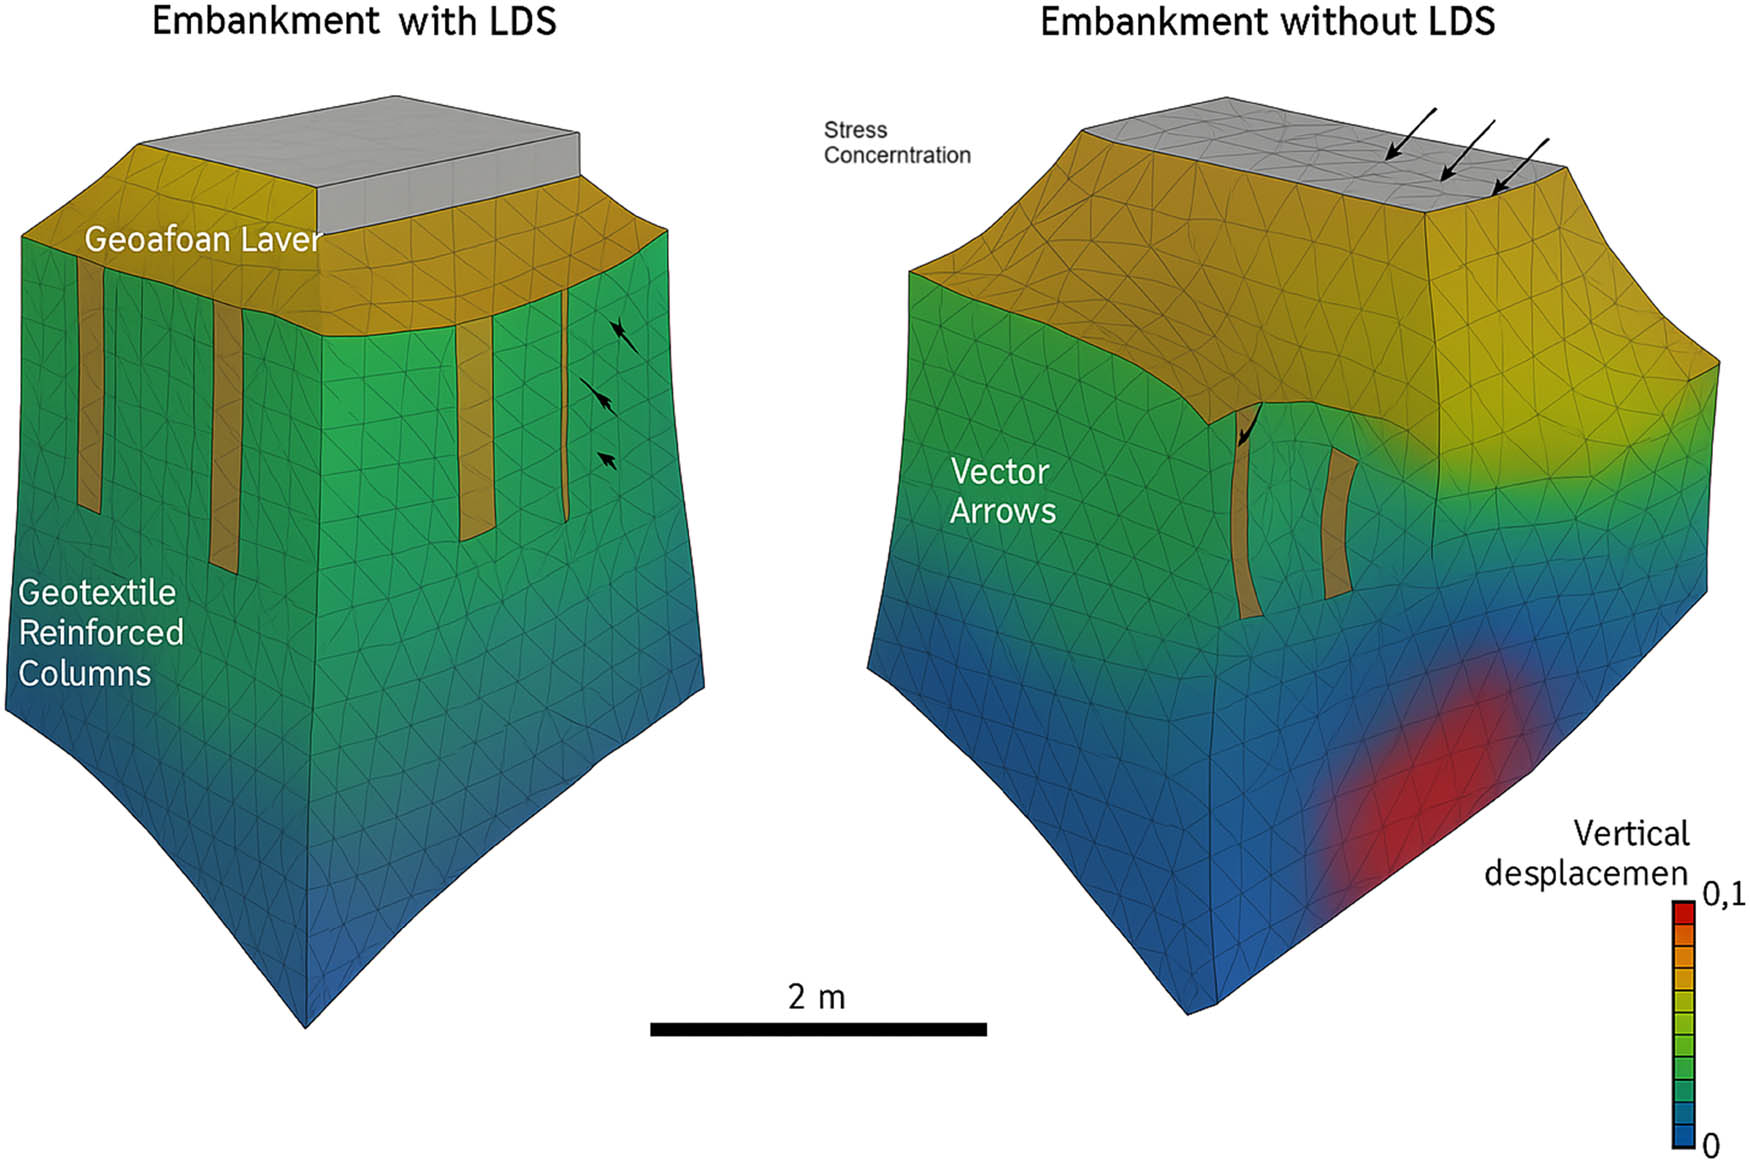
Figure 2
Meshing of modelled road embankments with and without LDS.
Source: Author’s contribution.
Introducing a rigid LDS and geofoam around geotextile-wrapped columns significantly improves the system’s structural response. The slab is a stiff bridging layer that spreads vertical loads more evenly across the column network, lowering contact pressures on the underlying soil. Geofoam, placed laterally around the reinforced columns, provides light confinement that curbs radial movements and bolsters column integrity [16]. These two elements form a composite foundation that limits immediate and delayed settlements, reduces differential displacements and shear-strain hotspots, and increases overall stiffness. The result is a more uniform stress field at the base and enhanced cyclic and dynamic loading resistance, making this combined approach especially effective for weak, highly compressible substrates.
2.2. Theoretical analysis of a soft‐soil embankment supported with geofoam and LDS
A theoretical framework was developed to illustrate how pavement-supported soft-soil embankments behave under loading increments as supported by Yu et al. [17]. Establishing the framework for a soft-soil embankment on soft soil poses two main challenges: excessive consolidation settlement and stability. Replacing part of the embankment fill with lightweight geofoam blocks reduces the stress transferred to the underlying soil. However, a rigid LDS atop the geofoam protects it from local overstressing and spreads traffic or embankment loads more uniformly. It is worth mentioning that this set’s mechanism works in such a way that the LDS acts as a rigid plate over geofoam, minimising local stress concentrations. Transfer heavy wheel or fill loads into a broader footprint before reaching the geofoam. Finally, this protects the geofoam from mechanical damage and chemical attack. The geofoam has a low unit weight (≈1–2% of soil) and reduces the vertical stress increment on the soft subsoil. Though the Geofoam is compressible, it is highly elastic up to about 1% strain, accommodating minor deformations without transferring large loads to the soil. For the long-term response of the geofoam, it exhibits creep within the acceptable limits (≤1–2% over service life for typical stresses). It is evident that LDS and geofoam act together to develop “slab arching,” thus diverting some load laterally toward stiffer shoulder zones or edge restraints. Therefore, the combination reduces the vertical stress transmitted to soil at a reasonable depth, diminishing consolidation magnitude and accelerating dissipation of pore pressures from the soft soil embankment.
Therefore, the theoretical analysis of a soft‐soil embankment supported with geofoam and a load distribution slab areilustrated using a composite Winkler–plate approach. Hence, the geometry and materials parameters are defined as follows: For slab: thickness hₛ, modulus Eₛ, and Poisson νₛ; for geofoam: thickness , modulus , and Poisson ; for soft soil: constrained modulus and Poisson . Therefore, equations 1–3 express the effective spring stiffness.
Plate-bending equilibrium refers to the balance of internal moments and shear forces within a plate subjected to transverse loads. It is governed by classical plate theory, particularly the Kirchhoff–Love theory for thin plates and the Mindlin–Reissner theory for thick plates as expressed in equations (4)–(6).
where is the distributed surcharge load, and is the uniform surcharge load as expressed in equation (6).Considering soil arching and stress across the bottom side of the LDS, the Boussinesq equation is considered and expressed in terms of the influence factor in equations (8) and (9).
An additional layer was incorporated into the analysis to refine the theoretical framework of DM columns [18]. On the soft embankment platform, the LDS is anticipated to uniformly spread the stresses generated by traffic loads, devoid of any soil arching effect. The LDS is a consistent surcharge (q) applied to the deep mix column. The vertical stress exerted on the soft soil ground at a midpoint between the pile caps is expressed in equation (8).
The pile caps provide structural support to the LDS, which is designed to carry the traffic load without cracks, attributed to its tensile strength and resistance to deflection. The stresses arising from the soft embankment and the traffic load are predominantly flexural. Consequently, the formulation presented in equation (11) outlines an accurate assessment of the LDS flexural properties.
where represents the curvature deformation parameter with and corresponding to the conditions of fully cracked and uncracked states, respectively. Meanwhile, serves as a distribution coefficient, its value determined through equation (12). where when is zero, it corresponds to an uncracked section. represents a coefficient that depends on the loading duration concerning the average strain. For short-term loading and repeated load cycles, can be assigned values of 1.0 and 0.5, respectively. Additionally, and denote the moment induced by the applied load and the cracking moment.2.3. Numerical model calibration
The validation of the numerical model applied in the parametric study was supported by an in situ case study involving DM GRC enclosures, consistent with findings reported by Anjana and Rajagopal [19]. Additionally, the current research aligns with a numerical analysis using a 3-dimensional (3D) soft soil constitutive model, as Han et al. described [20]. Furthermore, the combined effects of shear strength and soil consolidation were evaluated using the Cam-Clay constitutive model proposed by Forsman et al. [21]. Moreover, Figure 3 illustrates the stress–strain behaviour of EPS Geofoam based on prior findings by Abdelrahman and El Kamash [22]. Laboratory testing and simulations using Plaxis and FLAC 3D demonstrated the nonlinear stiffness characteristics of EPS Geofoam, with both experimental and simulation results confirming its ductile performance under varying stress conditions.
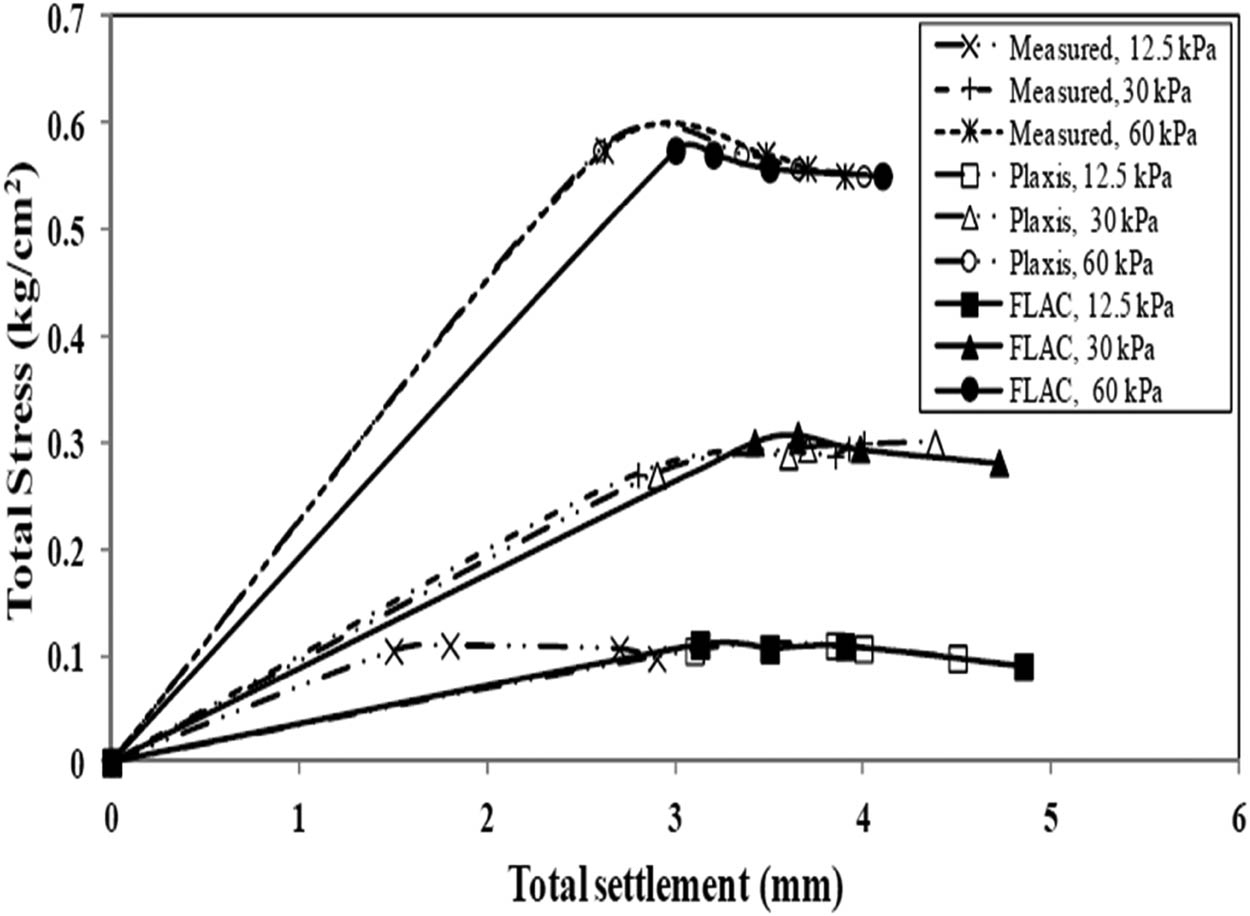
Figure 3
Laboratory and simulated stress–strain response of EPS geofoam.
Source: Han and Gabr, 2002.
The verification of the numerical model utilising the soil constitutive framework is summarised below. For this study, validation was carried out using a pavement embankment constructed with DM columns along the Sipoo River in Hertsby, Finland. Settlement and displacement responses of the GRC-supported soft embankment were assessed using Forsman’s [21] methodology. Figure 4 provides an overview of the cross-sectional design, including the conceptual embankment, soft soil, and GRC. The area replacement ratio (ARR) for this setup was determined as 30%, a value selected by Yapage et al. [23], who noted that typical ARR values for GRCs fall between 5 and 30%. The soft base of the embankment consisted of a crust layer with a thickness of 1–1.5 m, underlain by 10–14 m of soft clay, 0–6 m of silt, and 1–5 m of geological till. Within the soft clay, the shear strength of the silt layer ranged from 10 to 15 kPa. Drained triaxial testing established effective cohesion and friction angles as 8 kPa and 13°, respectively. Elastic moduli derived from triaxial testing under drained and undrained conditions ranged from 300 to 600 kPa and 3,000 to 8,000 kPa, respectively. The corresponding Poisson ratio under drained conditions was observed to vary between 0.1 and 0.2. The proposed embankment design incorporated an asphalt layer of 0.05 m thickness, a crushed stone coarse base measuring 0.2 m, a gravel subbase with a thickness of 1.050 m, and a 0.5 m sand structural platform over the existing ground. The soft base was reinforced with DM columns to improve bearing capacity and minimise soil compressibility. These DM columns, each 0.7 m in diameter, utilised a cement and by-product-based binder with a 130 kg/m³ density, as depicted in Figure 4a and b.
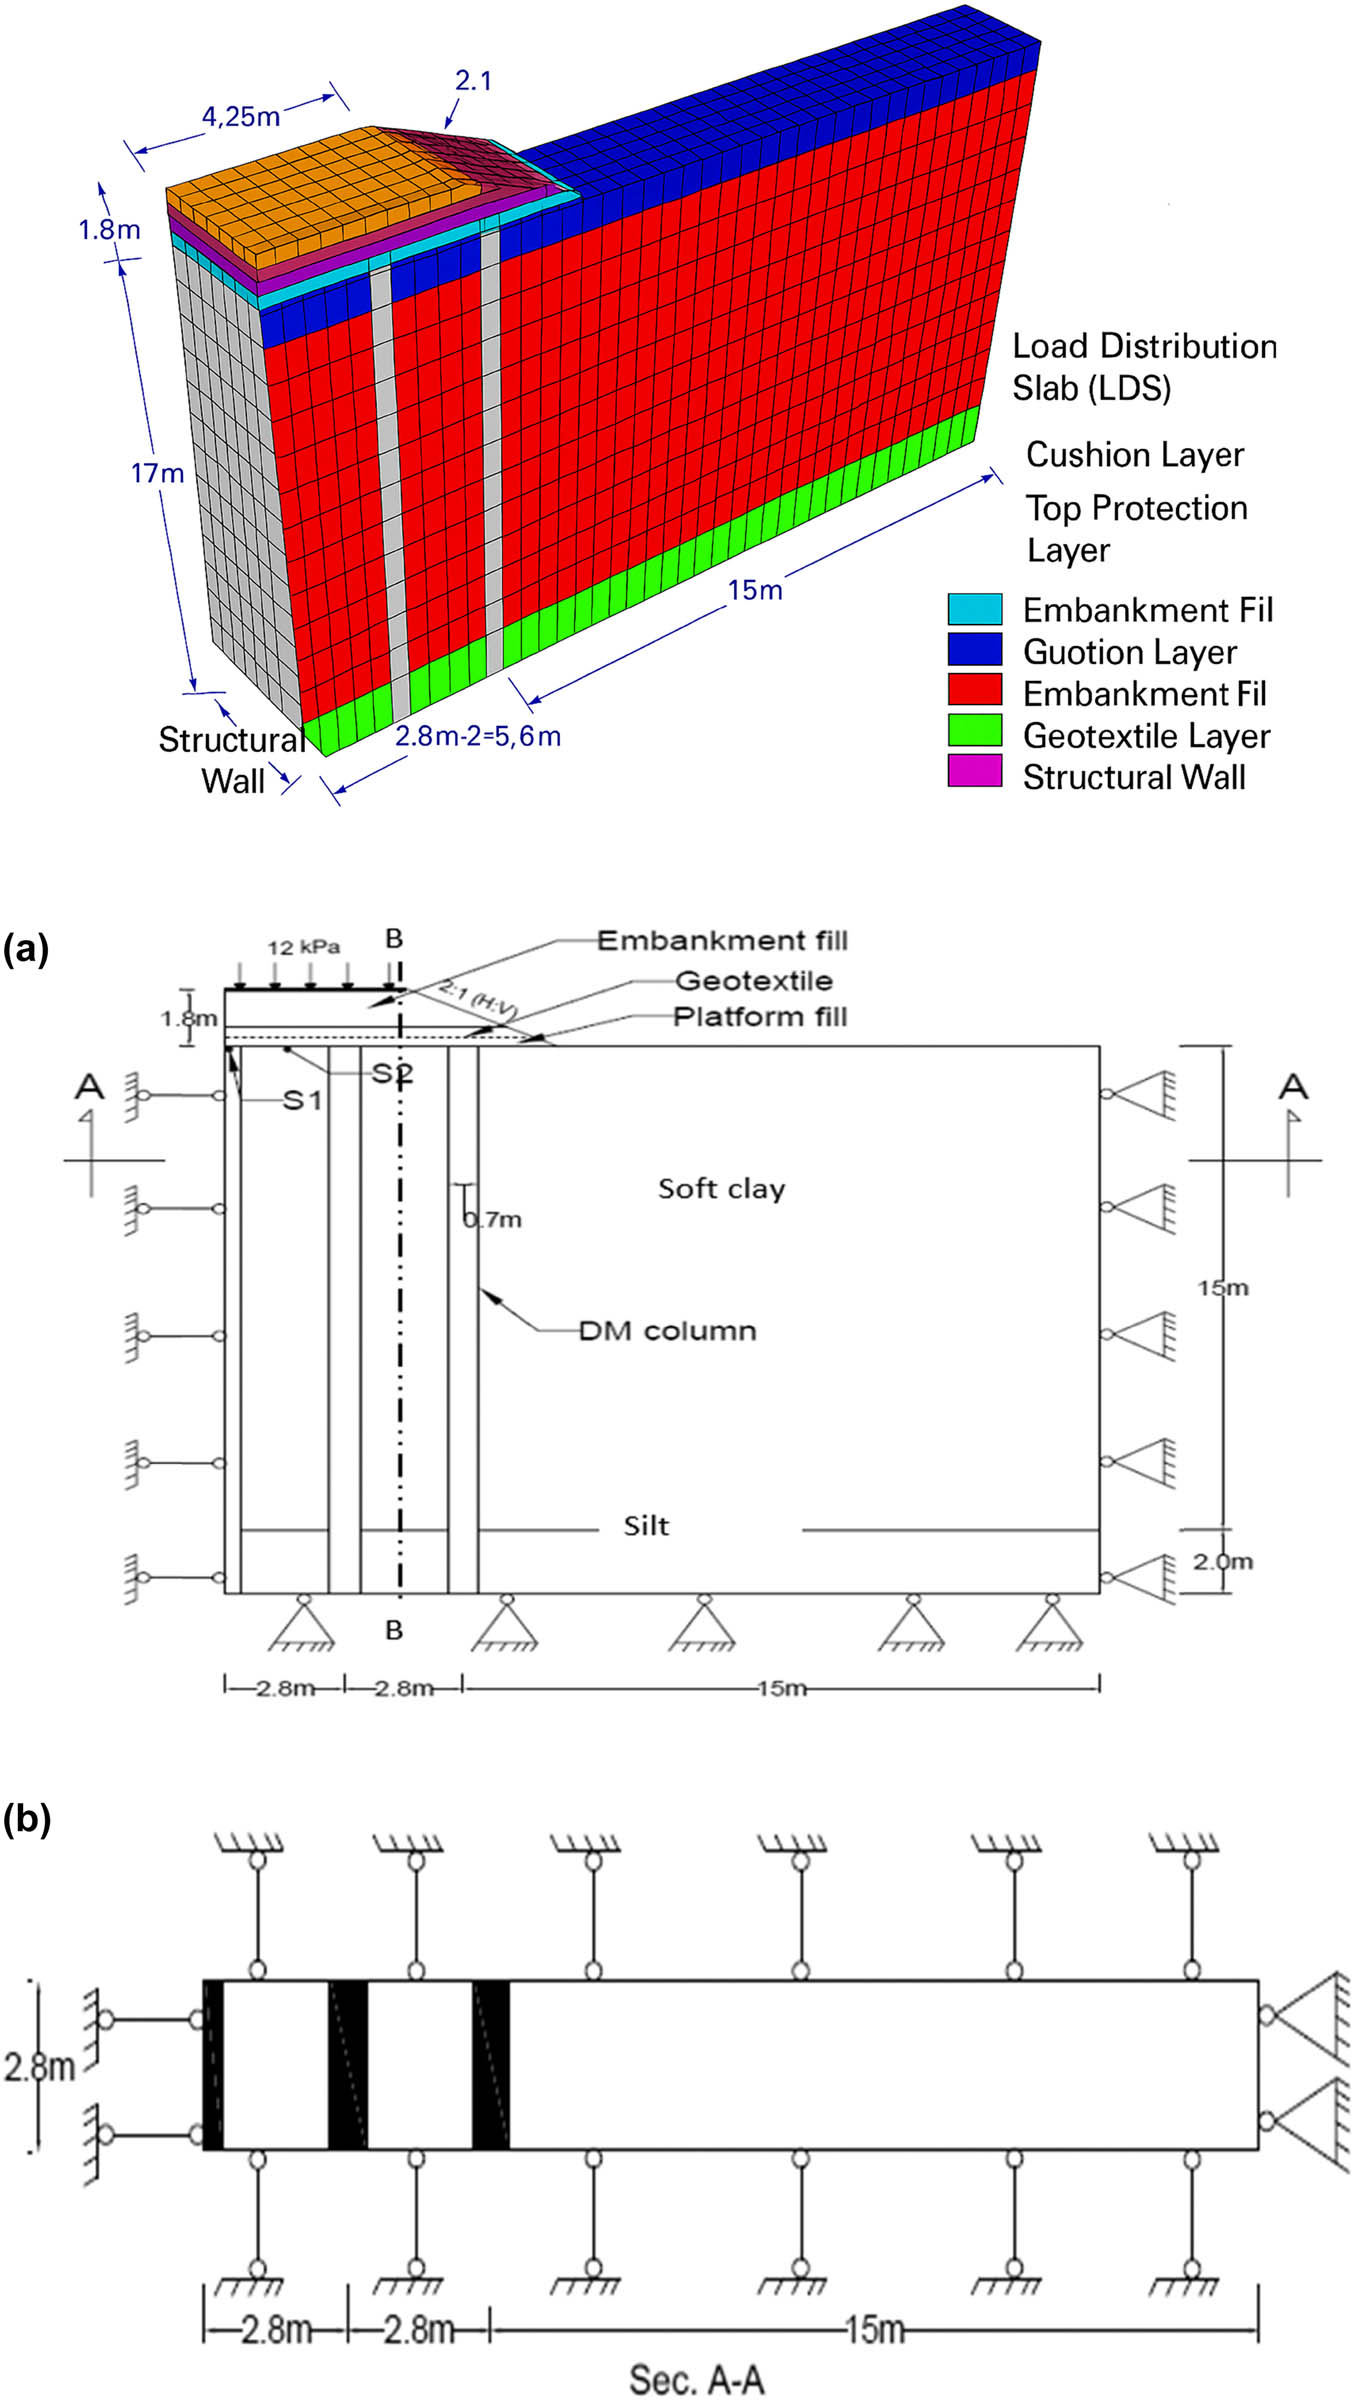
Figure 4
3D model of the embankment and layout of DM columns. (a) Dimension and boundary conditions in the 3D numerical model section. (b) Dimension and boundary conditions in the 3D numerical model section A–A.
Source: Author’s contribution.
The uppermost layer of the paved embankment segment consists of the foundation and subbase course. Notably, due to symmetry along the z-axis, only half of the domain was modelled in the complete 3D analysis. The equivalent area and embankment heights are 17 m and 1.8 m, respectively, with a slope gradient of 1V:2H, as depicted in Figure 5a. A rigid layer was applied over the soil and GRCs, with a GRC width of 0.7 m and a centre-to-centre spacing of 2.8 m. The columns exhibit a characteristic shear strength of 150 kPa, with a single sheet of woven geofoam placed above the columns and covered with a 0.3 m layer of fill sand. The geofoam exhibits an ultimate strength of 200 MN/m in both longitudinal and transverse directions. The geotextile layer demonstrates secant stiffness values of 1,790 and 2,120 kN/m over a strain range of 2–6%. No joint connections are present adjacent to the geofoam base sheets. The constructed embankment was equipped with horizontal hydrostatic profile gauges, settlement plates, and strain gauges installed on the geotextile sheet. Over 5 years, the maximum observed settlement was approximately 120 mm, with settlements stabilising after 2 years. Estimated strains in the geotextile ranged from 0 to 0.2% in the longitudinal direction and from 0 to 1% in the transverse direction. The corresponding strain tensions were 3.6 and 18 kN/m at 0.2 and 1% strain levels, respectively.
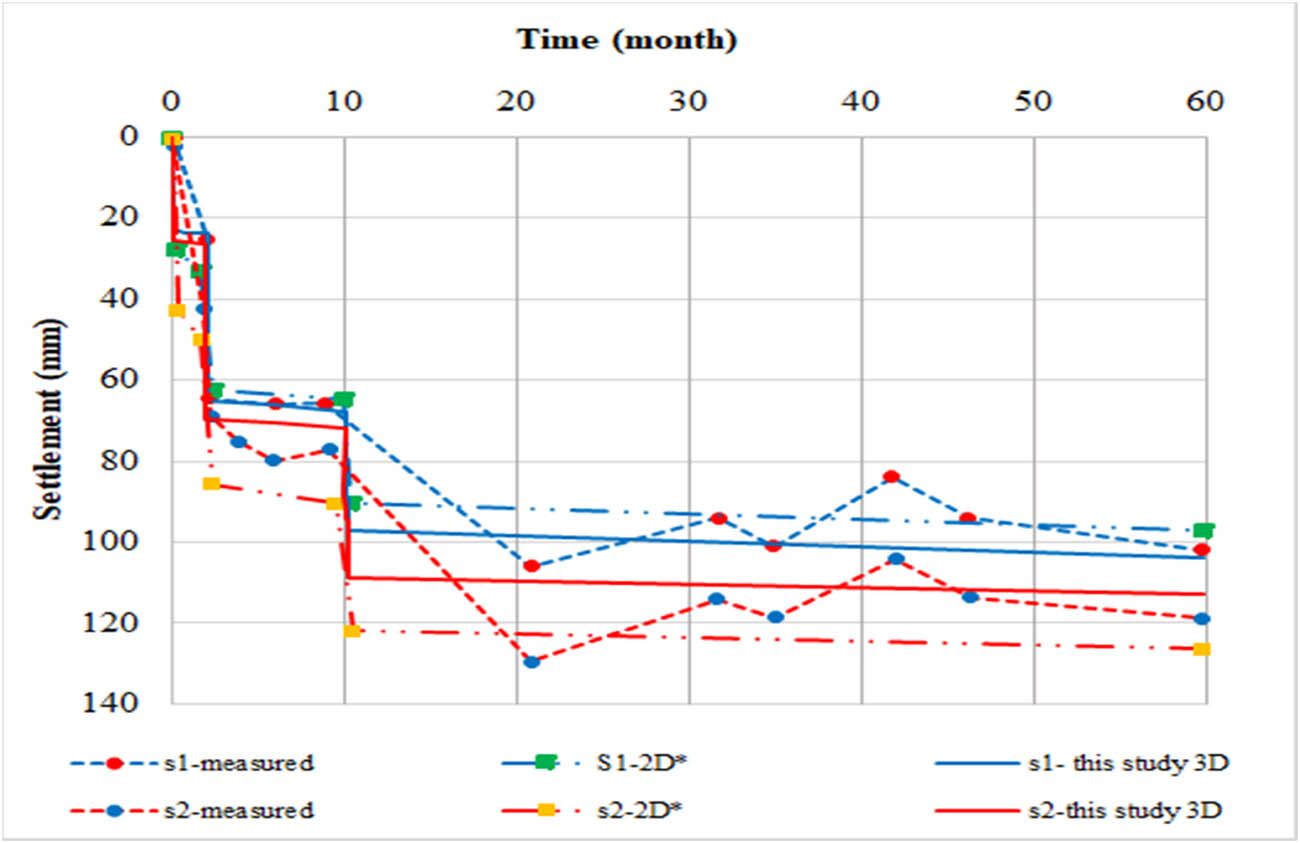
Figure 5
Analysis of measured and calculated values for settlement–time curves [9].
Source: Author’s contribution.
This section presents the 3D numerical model, including its dimensions and boundary conditions, developed using the built-in version 3 of FLAC program [24]. The verification exercise is depicted in Figure 4a and b, illustrating the cross-section along A–A through the DM walls, excluding the middle columns. Due to symmetry about the z-axis, only half of the section was utilised in the analysis. The DM columns were modelled in a wall configuration as part of a 3D soil-cement system, with the wall extending half-width at the centreline. The DM columns were treated as linearly elastic materials in the simulation, while the embankment fills, soft clay, and silt were modelled using an elastic-perfectly plastic material approach. The soil layers and DM columns were extended down to firm soil strata.
The MCC model was utilised to assess the consolidation and shear strength characteristics of the soft clay and fill materials used for the platforms and embankment, as detailed in Table 2. The results indicate that the consolidation parameters of soft clay exhibit a limited load bearing capacity, with a recorded compression index value of 1.14. In contrast, the fill materials demonstrated compression index values of 0.01 for the embankment fill and 0.028 for the platform fill, signifying a comparatively superior load bearing capability over the soft clay. The Mohr-Coulomb failure envelope was employed as the failure criterion to analyse the shear strength parameters of both the soft clay and silt. A geogrid element was incorporated to model the geotextile layer positioned 0.3 m above the top of the DM columns. Table 2 also provides the properties of the clay, DM columns, and geotextile layer. The elastic modulus of the DM columns was derived using a standard approximation, E = 100 qu, as per Bruce [25], where qu represents the unconfined compressive strength of the columns (300 kPa) and the Poisson’s ratio is 0.2.
Table 2
Properties of soft clay, silt, fill, DM walls, and geofoam.
| Parameters | Symbol | Soft clay | Platform fill | Embankment fill | DM walls | Geofoam EPS15 | Geotextile |
|---|---|---|---|---|---|---|---|
| Soil model | MC* | MC* | MC* | Elastic | Plastic | Elastic | |
| Bulk modulus (GPa) | K | 1.1 | 19.6 | 39.2 | 25.0 | — | — |
| Shear modulus (GPa) | G | 0.25 | 75.2 | 15 | 11.5 | 0.00257 | — |
| Friction angle (°) | ϕ | 12 | 32 | 38 | 6.3 | — | — |
| Cohesion (kPa) | c′ | 26 | 18 | 14 | — | 4.26 | — |
| Dry density (kN/m3) | γ d | 16.18 | 19.18 | 18.54 | — | 0.155 | — |
| Compression index | C c | 1.14 | 0.01 | 0.028 | — | 0.00032 | — |
| Coefficient of consolidation (m2/year) | C v | 0.22 | 3.25 | 2.58 | — | 3.35 | — |
| Coefficient of volume compressibility, (m2/kN) | m v | 1.5 × 10⁻³ | 0.05 × 10⁻³ | 0.054 × 10⁻³ | — | 0.033 × 10⁻³ | — |
| Tensile stiffness of geotextile (kN/m) | J | — | — | — | — | — | 1,700 |
| Coupling stiffness of geotextile (MPa/m3) | k | — | — | — | — | — | 2.3 |
| Coupling friction angle (°) | c i | — | — | — | — | — | 5 |
| Elastic modulus (MPa) | E s | — | — | — | — | 12 | |
| Viscosity (Pa s) | () | — | — | — | — | — | 1 × 10¹¹ |
Source: Author’s contribution.
The DM wall was determined to have an average thickness of 0.7 m. The adequate thickness was computed based on the actual area of a series of DM columns, equating to the wall area analysed in this study. It is important to note that the crust layer beneath the ground surface was excluded from the numerical analysis, as it was removed following the installation of the DM columns. Multiple pavement frame layers were applied to reduce stress transmission to the soft soil, in line with the approach described by Hong et al. [26]. Traffic loading was modelled using surcharges of 12, 33, and 66 kPa. Under undrained and drained soil states, these traffic load conditions were evaluated at different embankment filling stages. Initially, the problem was analysed under undrained conditions, transitioning to a drained state during the filling phase. Iterative numerical simulation techniques were employed for mechanical and hydraulic effects, utilising alternative loops under drained conditions. Convergence within tolerance levels was achieved after multiple cycles, with adjustments to pore water pressure and volumetric strain. Boundary conditions were applied at the bottom in horizontal and vertical directions, while the two side boundaries were constrained horizontally and left free vertically.
Multiple studies have provided detailed comparisons between numerical findings and field data, focusing on parameters such as vertical displacements, reinforcement tension, and vertical stresses. This analysis is limited to key tests. Figure 5 compares settlement–time curves, highlighting immediate and long-term settlement locations, identified as S1 and S2, respectively. Analytical results from this study indicate a maximum tension of 16.2 kN/m, while field measurements recorded tensions ranging from 3.6 to 18 kN/m. This range is deemed acceptable, as it falls within the expected measurement limits. Additionally, the numerical outcomes from this research align closely with field observations, consistent with findings reported by El Kamash and Han [9].
2.4. Numerical analysis of LDS with geofoam
The cross-section depicted in Figure 6a and b was initially designed to withstand live loads of 33 and 66 kPa; however, the embankment experienced failure under the higher load conditions. EPS geofoam was introduced as a lightweight construction material to mitigate this issue, replacing the embankment fill. The revised cross-section incorporated three graduated layers of geofoam, as shown in Figure 7a. The first geofoam layer measured 6.2 m in width and 0.3 m in thickness, while the subsequent layers were 5.5 and 4.5 m wide, each retaining the same thickness. An LDS was added to the configuration to further enhance the embankment’s load-bearing capacity, as illustrated in Figure 7b. The LDS, measuring 4.5 m in width and 0.3 m in thickness, was placed above the topmost geofoam layer (geofoam 3). The configuration without the LDS was termed Case A, while the inclusion of the LDS was denoted as Case B. Both scenarios (Cases A and B) were evaluated under live loads of 12, 33, and 66 kPa, with results encompassing parameters such as vertical displacement, horizontal displacement, and transverse gradient. The LDS in the uploaded image is represented by the light blue colour at the top layer of the model. This section appears as a uniformly coloured rectangular grid covering the crest of the embankment, which aligns with the typical placement of an LDS above the fill layers.
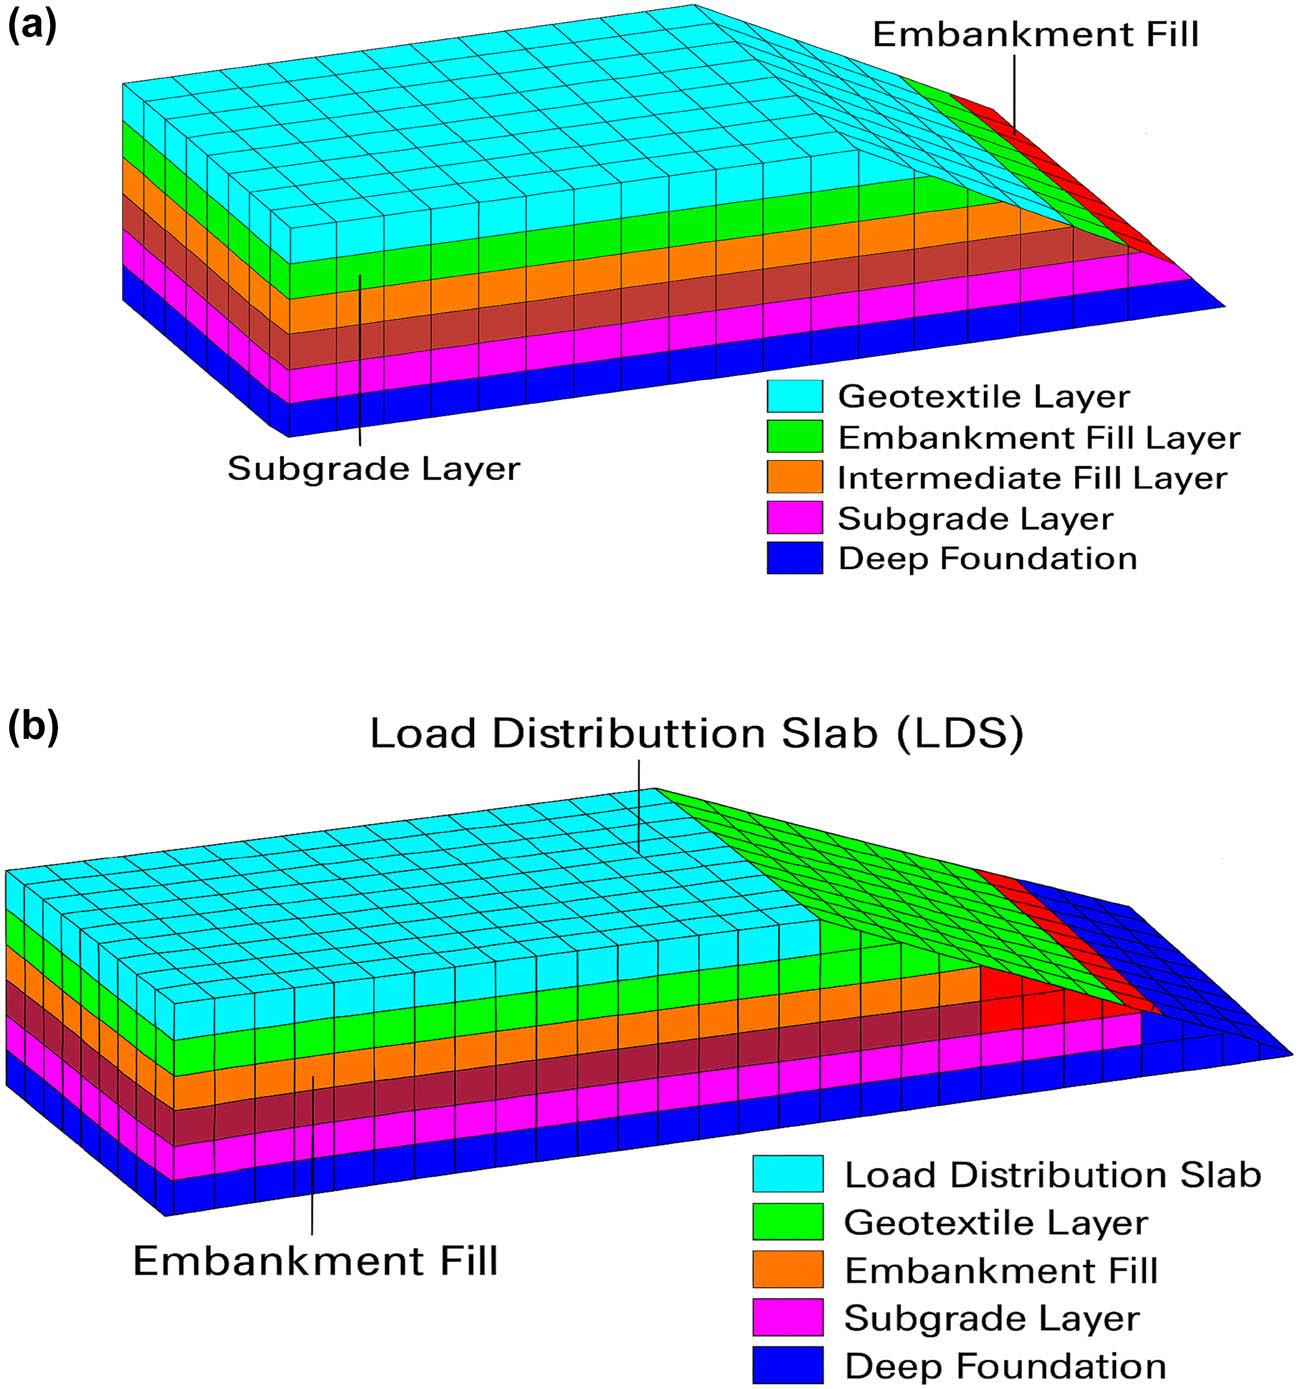
Figure 6
(a) Without LDS, Case A. (b) With LDS, Case B.
Source: Author’s contribution.
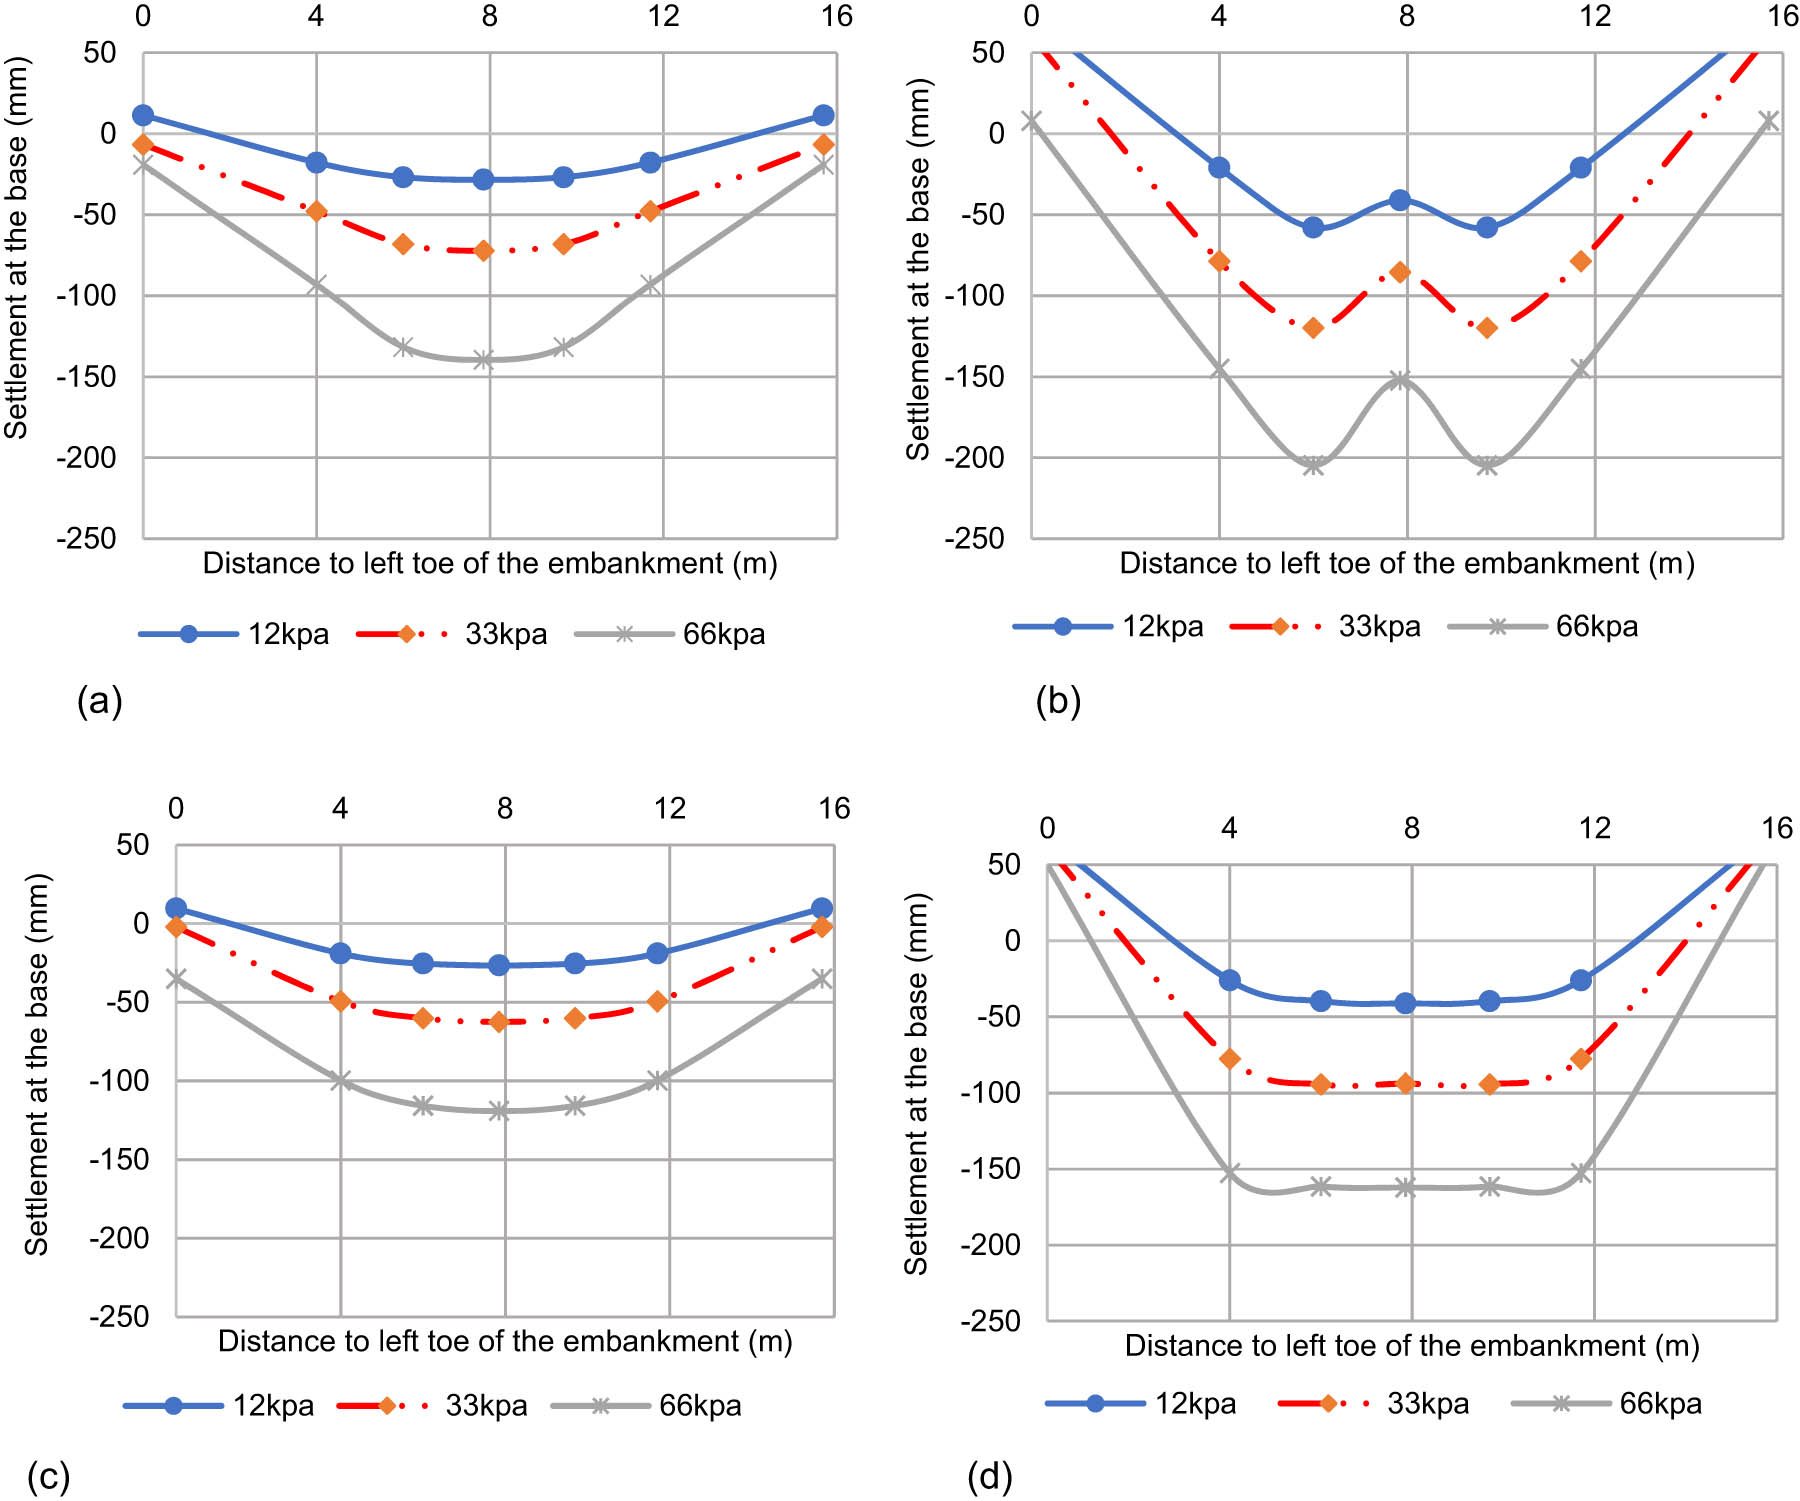
Figure 7
Settlement profile at the base of the embankment with EPS geofoam: (a) Without LDS immediately after the construction, (b) without LDS at the end of consolidation, (c) with LDS immediately after the construction, and (d) with LDS at the end of consolidation.
Source: Author’s contribution.
3. Result discussion
3.1. Settlement profile
The settlement profiles at the bases of supported embankments incorporating EPS geofoam are illustrated in Figure 7a–c. A series of finite element simulations quantified vertical deformations in column-supported embankments incorporating EPS geofoam layers. Three live loading conditions, 12, 33, and 66 kPa, were applied to two configurations: one without an LDS and one with a rigid LDS above the geofoam. When an LDS was omitted, immediate elastic settlements reached 27, 62, and 90 mm for the respective loads, climbing during primary consolidation to 33, 78, and 140 mm as excess pore pressures dissipated, and the low-stiffness geofoam deformed under concentrated column stresses. By contrast, the rigid LDS redistributed vertical stresses more evenly across the EPS layer, curbing instantaneous deformations to 5, 9, and 11 mm and limiting post-consolidation settlements to 5.2, 9.4, and 11.3 mm under the same loading scenarios. Settlement increases between the elastic and consolidation stages ranged from 2.7 to 4.4%, comfortably within the 5% tolerance stipulated by design guidelines. This analysis validates the function of an LDS in enhancing embankment performance by controlling immediate and time-dependent deformation behaviours. The findings underscore the importance of integrating structural overlays to optimise long-term serviceability of granular fill systems.
A comparative evaluation of embankment settlements with and without an LDS demonstrates the slab’s dramatic effect on immediate and long‐term deformations. When an LDS was introduced above the EPS geofoam, initial settlements under the three live‐load cases dropped by approximately 81.5, 84.1, and 36% relative to configurations lacking the slab. After primary consolidation, the slab’s benefit became even more apparent, further curbing post‐consolidation deformations and confirming its critical role in controlling time‐dependent settlement. These contrasting behaviours stem primarily from differences in shear transfer at the soil–geofoam interface under varying loads (refer to equations (1)–(9)). Furthermore, overall geofoam compression is modulated by fill height, subgrade stiffness, the geofoam’s thickness and elastic modulus, and the degree of arching mobilised within the granular fill system.
The settlement patterns observed here mirror those reported by Ali-Mohammadi et al. [27], underscoring EPS geofoam’s comparatively low stiffness and limited capacity to resist vertical deformations vs geotextile reinforcements. Under traffic loading, the pronounced compressibility of the geofoam layer yields excessive mid-span deflection due to its inability to develop a broad, dish-shaped bearing surface. A rigid LDS above the geofoam effectively spreads the applied stresses, markedly reducing immediate and time-dependent settlements. Alternatively, replacing EPS geofoam with suitably selected geotextile systems can enhance stiffness and improve post-consolidation performance under high live loads [28].
3.2. Horizontal displacement
Figure 8 displays the numerical horizontal displacement results for four cases evaluated at the end of construction and immediately following consolidation for Case A (without LDS) and Case B (with LDS). These analyses were conducted at the road’s end (section B–B as illustrated in Figure 4a) under 12, 33, and 66 kPa live loads. For the embankment without the LDS, the immediate horizontal displacements reached 75, 98, and 115 mm, which were subsequently reduced to 37, 50, and 71 mm after consolidation. In contrast, the embankment incorporating the LDS recorded significantly lower immediate horizontal displacements, underscoring its beneficial effect in reducing lateral deformations.
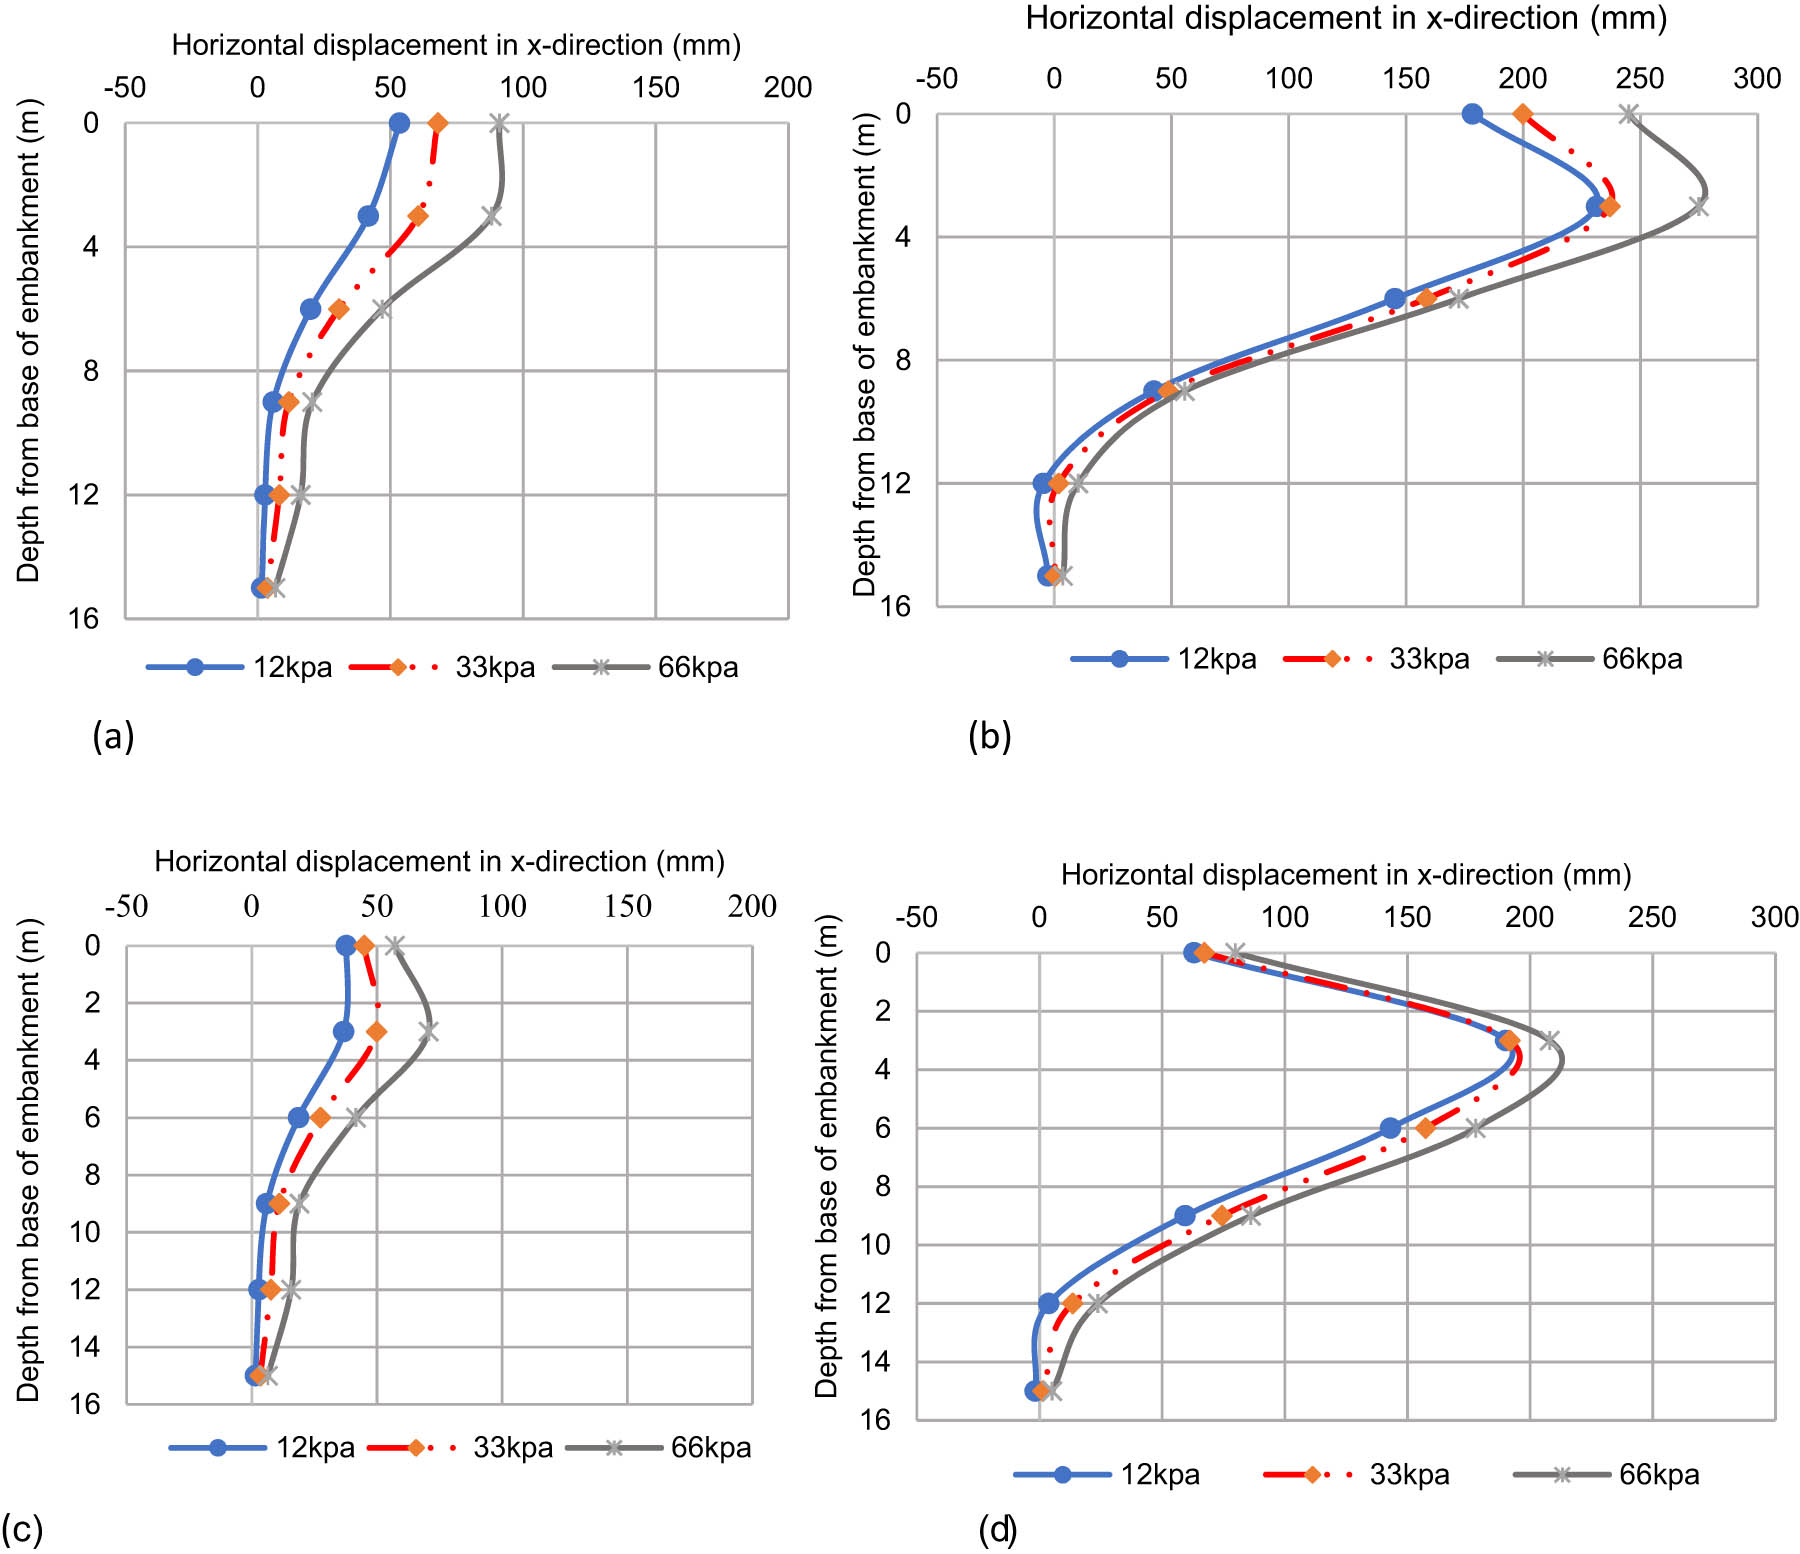
Figure 8
Horizontal displacements below the embankment with EPS geofoam: (a) Without LDS immediately after the construction, (b) without LDS at the end of consolidation, (c) with LDS immediately after the construction, and (d) with LDS at the end of consolidation.
Source: Author’s contribution.
Immediately after construction, horizontal displacements measured 2, 5, and 9 mm under live loads of 12, 33, and 66 kPa, respectively. Following consolidation, these values reduced markedly to approximately 0.5, 0.8, and 1.3 mm. This stark contrast demonstrates that incorporating the LDS substantially limits horizontal movement across all load levels. The reduction in displacement after consolidation was even more pronounced than that observed immediately after construction, with average decreases of 95, 90, and 87.3% being recorded when comparing embankments with the LDS to those without it. These percentages indicate that horizontal displacements would be considerably higher without an LDS.
Moreover, the maximum lateral movement was observed in the uppermost fifth of the soft clay layer. In this region, the LDS functions effectively as a diaphragm or tie, curbing lateral deformations regardless of the loading duration or magnitude. The findings of this analysis align with those reported by Ali-Mohammadi et al. [29] and Pedroso et al. [30], which demonstrated that geotextile materials used as a base course in granular column embankments reduce horizontal displacements more effectively than EPS geofoam, primarily due to their superior flexural strength.
Additionally, introducing an LDS redistributes the vertical stresses to form a more rigid base, thereby diminishing both lateral stress and displacement due to the LDS’s inherent stiffness and high resistance to deflection (as detailed in equations (10)–(12)). The elevated creep resistance and stiffness of the LDS further contribute to a more uniform distribution of stresses and settlements both immediately after construction and upon consolidation when compared to embankments without the LDS.
3.3. Transverse gradient change
The transverse gradient variation is defined as the percentage distortion of the pavement resulting from differential settlement caused by embankment stresses [31]. Such variations can also induce changes in the pavement’s transverse alignment. In this study, the pavement overlay was assumed to be horizontal initially (as ensured under small-strain conditions) so that any deviation in slope from its original state is directly captured by the crest profile immediately after construction and following consolidation.
Figure 9 illustrates the crest settlement profiles for four cases, with measurements taken immediately after construction and after consolidation for Case A (without LDS) and Case B (with LDS). The transverse gradient was determined by plotting the crest settlements against the distances from the point of maximum settlement to the embankment shoulders, summarising the overall effects in Table 3. For Case A, the overall settlement was recorded at 145 mm immediately after construction (Figure 9a) and increased to 208 mm after consolidation (Figure 9b). In contrast, for Case B with the LDS, Figure 9c and d shows that the maximum settlement decreased to 121 mm immediately after construction and 171 mm after consolidation.
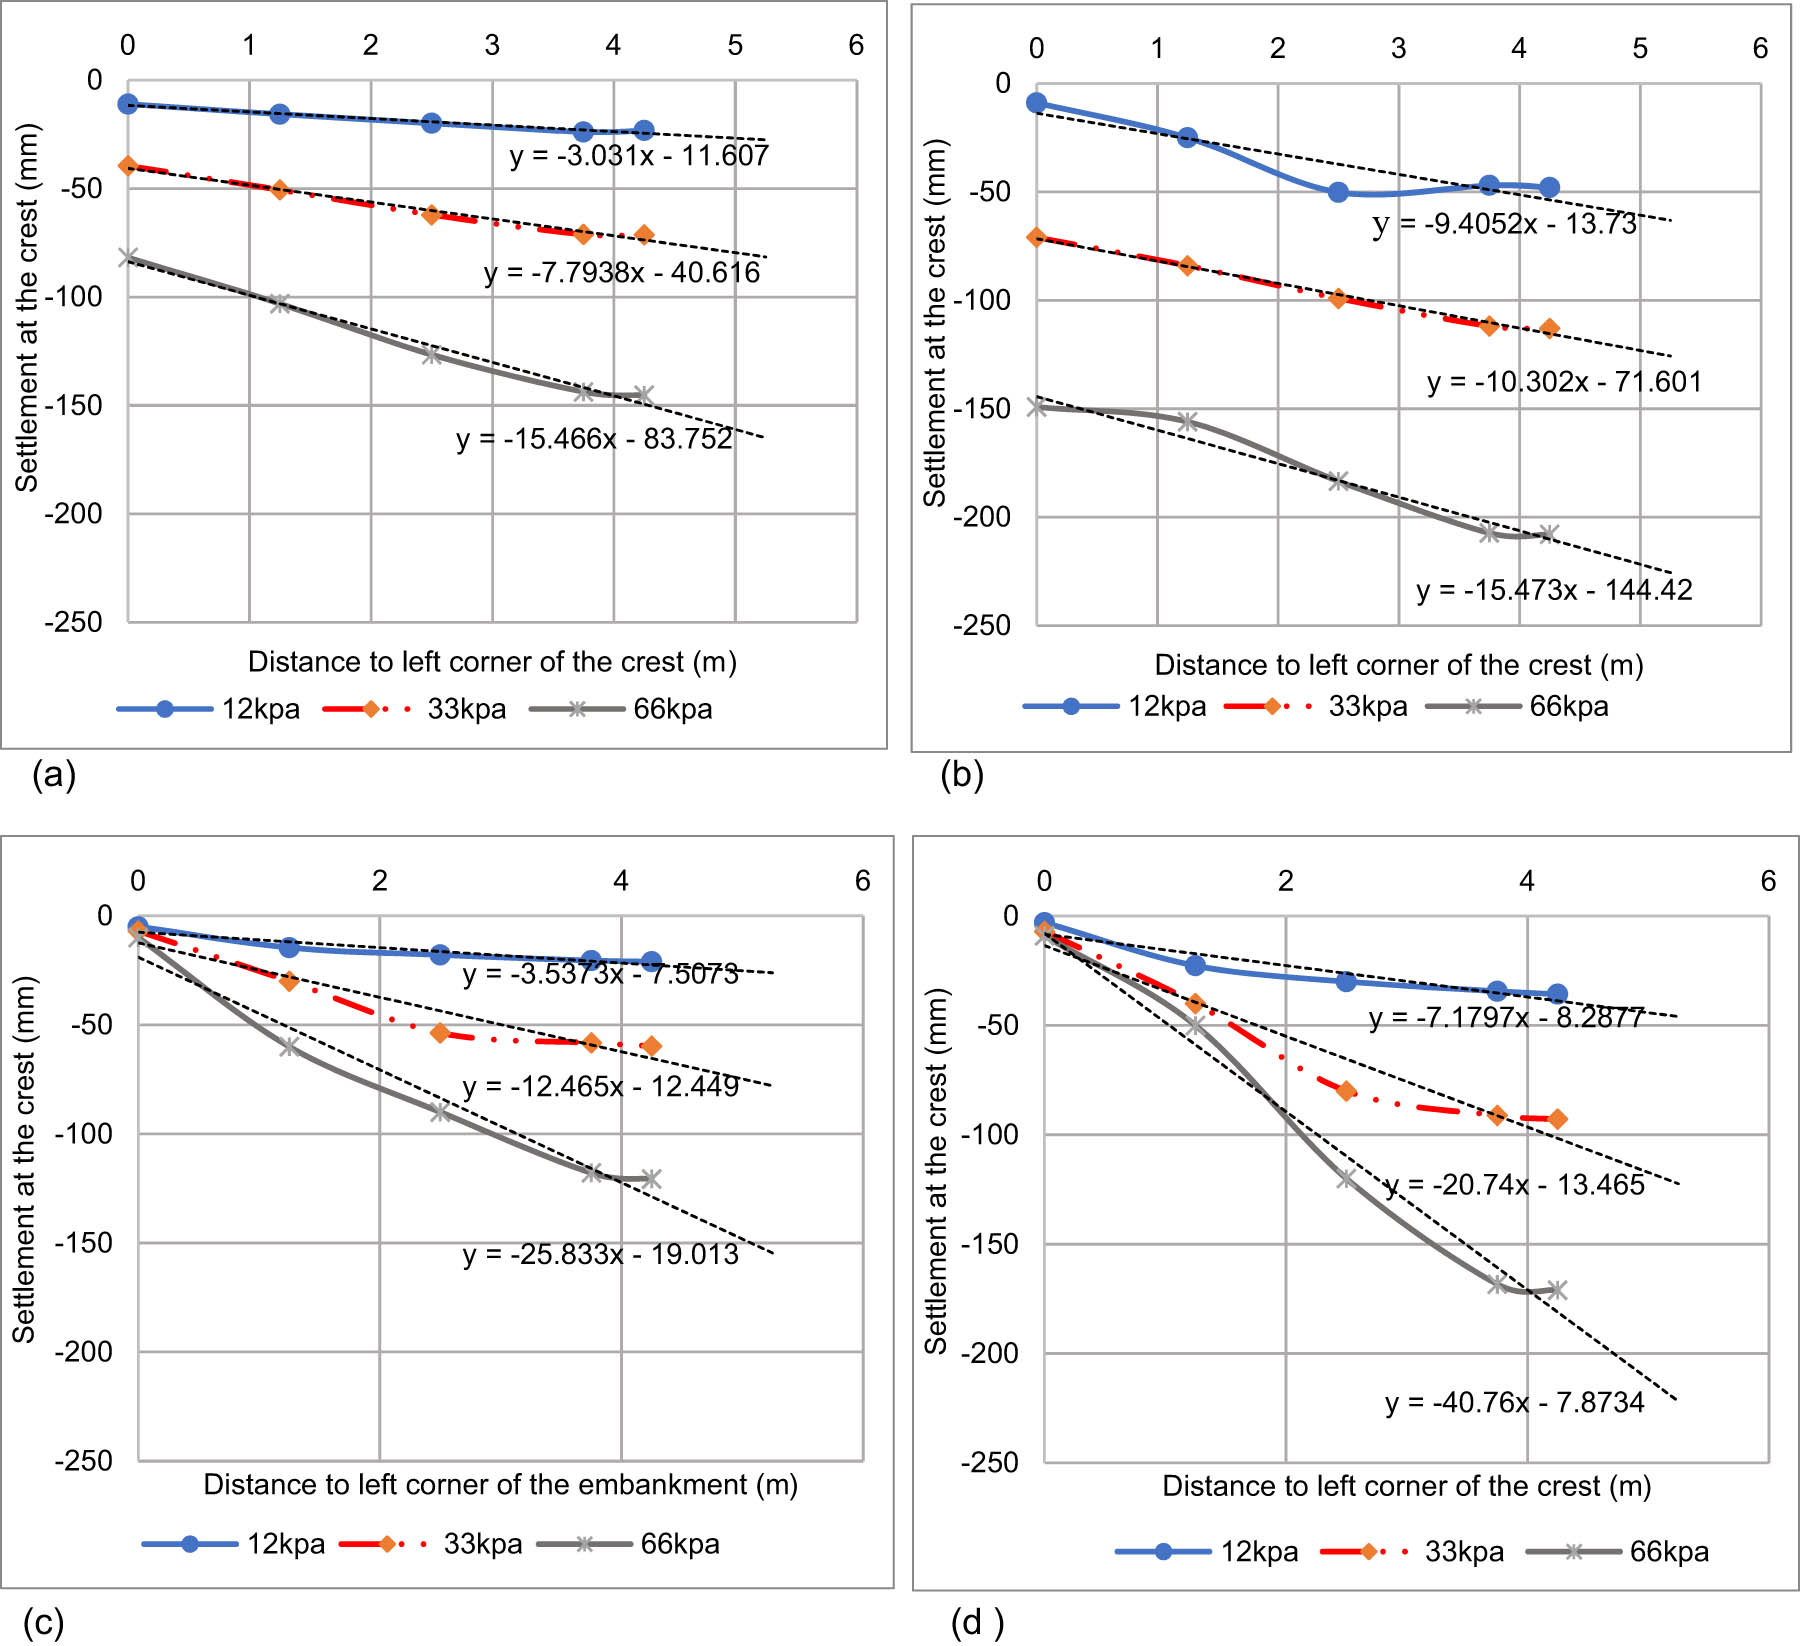
Figure 9
Transverse gradient change of the embankment with EPS geofoam: (a) Without LDS immediately after the construction, (b) without LDS at the end of consolidation, (c) with LDS immediately after the construction, and (d) with LDS at the end of consolidation.
Source: Author’s contribution.
Table 3
Transverse gradient change (%).
| Unit | Case | |||||||||||
|---|---|---|---|---|---|---|---|---|---|---|---|---|
| A (after construction immediately) | A (after the end of consolidation) | B (after construction immediately) | B (after the end of consolidation) | |||||||||
| (kPa) | 12 | 33 | 66 | 12 | 33 | 66 | 12 | 33 | 66 | 12 | 33 | 66 |
| (%) | 0.30 | 0.78 | 1.5 | 0.94 | 1.3 | 1.5 | 0.19 | 0.39 | 0.65 | 0.39 | 0.49 | 0.53 |
Source: Author’s contribution.
This approximate 18% reduction in settlement is attributed to the rigid nature of the LDS, which acts as a diaphragm to resist lateral deformations and effectively minimise changes in the transverse gradient.
Table 3 indicates that the transverse gradient variation for Case B is consistently lower than that observed in Case A. Notably, no crest settlement was detected during the construction stage prior to pavement installation. When comparing the results immediately after construction and following consolidation, it is evident that incorporating the LDS effectively minimises the transverse gradient change across all live load conditions, regardless of the timing.
3.4. Vertical stress
Figure 10 illustrates how vertical stresses vary with depth near the left toe of the embankment. Notably, for a 66 kPa load, the overall vertical stress increased by 80% after consolidation in Cases A and B. As explained by Sarker and Wang [32], this indicates that the DM columns effectively channel the applied stresses into the lower strata rather than solely elevating the pore pressures, thereby increasing the vertical stress within the columns, a process known as mechanical consolidation. Furthermore, the LDS contributed to controlling settlement by redistributing stresses, resulting in an additional 9% load transfer to the DM columns immediately after construction and following consolidation, as shown in Figure 10c and d.
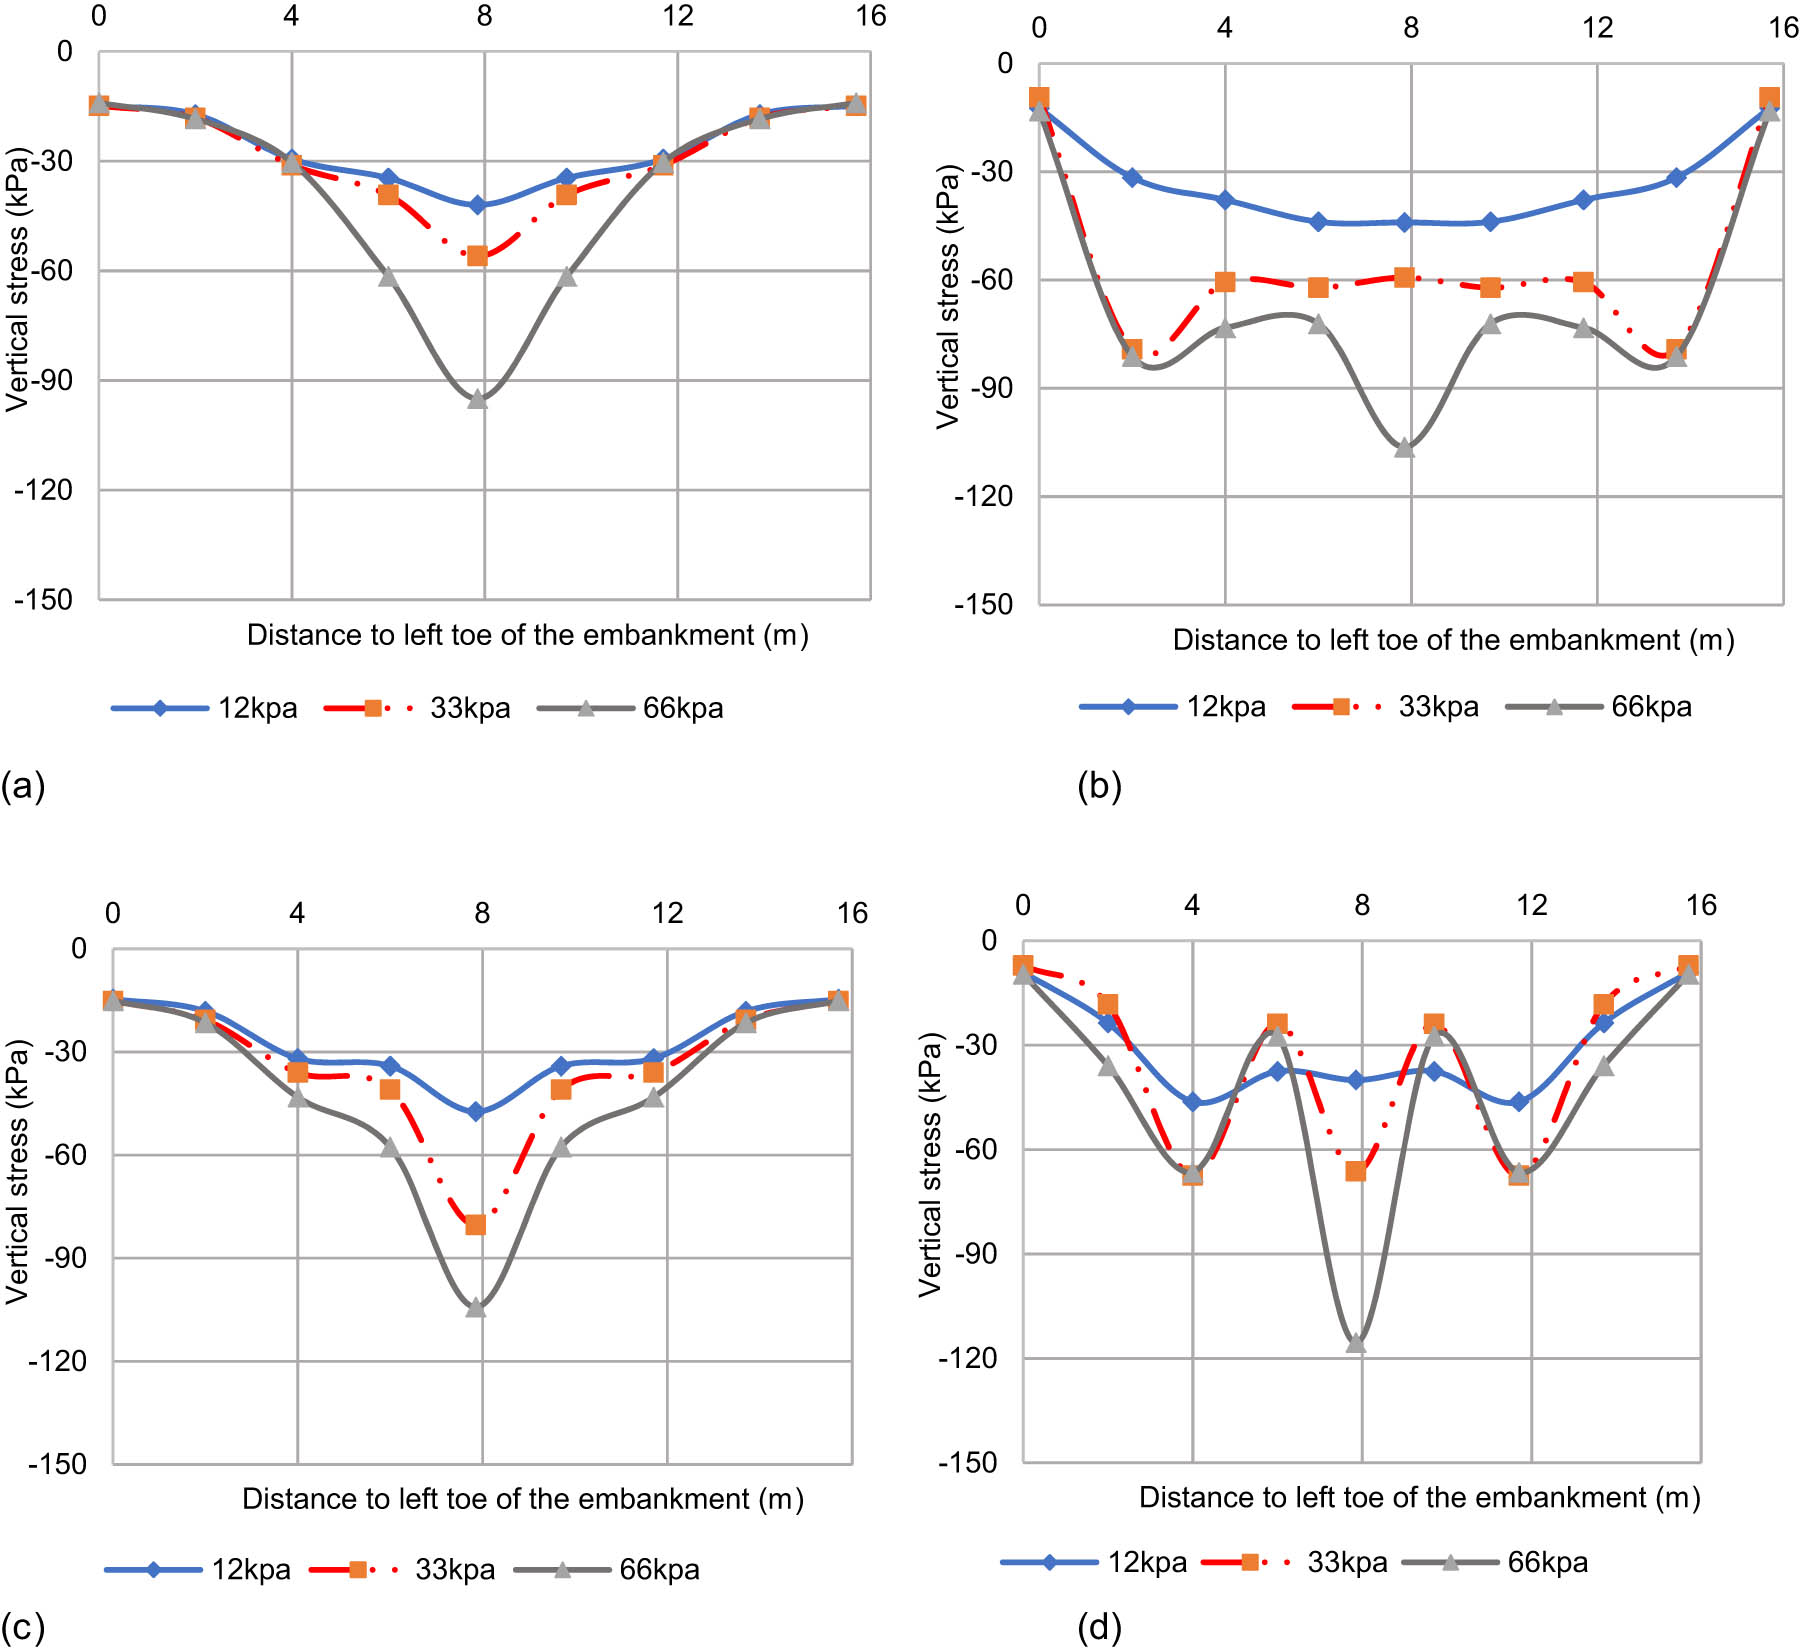
Figure 10
Vertical stress of the embankment with EPS geofoam below the base: (a) Without LDS immediately after the construction, (b) without LDS at the end of consolidation, (c) with LDS immediately after the construction, and (d) with LDS at the end of consolidation.
Source: Author’s contribution.
Conversely, in the absence of an LDS, the vertical stresses measured immediately after construction were considerably higher, and these stresses continued to escalate post-consolidation, reaching their maximum at the locations of the DM columns. In contrast, the initial vertical stresses were substantially lower when the LDS was included. Additionally, at the end of consolidation, the region within 90 mm of the embankment toe exhibited a marked reduction in vertical stress, as depicted in Figure 10c and d.
4. Conclusion
This study presents a 3D numerical investigation that initially validates a finite difference model against field data before examining how EPS geofoam and an LDS influence the performance of column-supported embankments on soft clay. The analysis includes evaluating geofoam tension and exploring the interactions between arching-induced geofoam strain and the reactive forces from the soft ground using a theoretical force equilibrium approach.
This research primarily aims to quantify the effectiveness of a pavement structure enhanced by a geofoam-based LDS. A 3D model built with the FLAC was utilised to achieve this. FLAC employs an explicit finite difference formulation that can simulate complex phenomena such as multistage processes, large displacements and strains, nonlinear material behaviour, and even unstable systems, including cases of widespread yielding, failure, or total collapse, as described by Google. Based on the analytical results obtained, the following key conclusions were drawn:
The findings indicate that settlement exceeded lateral displacement, particularly in the absence of an LDS. Incorporating an LDS into the subbase notably enhanced pavement stiffness, reducing excessive settlement and improving the soft embankment’s load bearing capacity, stability, and overall flexibility. These results underscore the crucial role of the LDS in geofoam-reinforced soft embankments for pavement construction.
The field performance of embankments supported by DM columns was accurately captured using a MCC model for soft soils. This approach incorporated the coupled mechanical and hydraulic effects through 3D numerical analysis. The tests revealed that soft clay, with a compression index of 1.14, exhibited a low load bearing capacity. In contrast, the fill materials used for the embankment and platform had compression index values of 0.01 and 0.028, respectively, indicating that these materials are considerably more effective at bearing loads than soft clay.
The investigation demonstrated that EPS geofoam and an LDS facilitated a more uniform distribution of loads across the DM GRCs, supporting the embankment on soft soil. Immediately after construction, maximum settlements under live loads of 12, 33, and 66 kPa were recorded as 27, 62, and 119 mm, respectively. These values increased post-consolidation to 41, 94, and 162 mm, respectively, reflecting the system’s overall performance under varying load intensities.
The presence of an LDS markedly reduced settlement, with reductions of 32% immediately following construction and 24% after complete consolidation. Additionally, the LDS effectively limited lateral displacement to below 70 mm in the immediate post-construction phase, whereas configurations without an LDS experienced lateral displacements reaching up to 208 mm post-consolidation. The transverse gradient was also better regulated when an LDS was used, with the percentage change maintained at less than 0.19% immediately after construction and 0.39% after consolidation under a 12 kPa load; for a 66 kPa load, these values were no more than 0.65% immediately and 0.53% post-consolidation.
The analysis identified a 11% increase in stress within the DM columns after consolidation, primarily due to mechanical consolidation, where the applied embankment stresses are directly transferred to the lower soil layers. The LDS further contributed to this effect by redistributing stresses to the DM columns, resulting in an additional 9% increase in their stress levels, which ultimately enhanced the stability of the embankment system.
Funding information
Authors state no funding involved.
Author contributions
Frank Ikechukwu Aneke: Conceptualization of the study; development of the research hypothesis; overall research design; supervision of numerical modelling; interpretation of results; manuscript drafting (original draft); critical revision of the manuscript; final approval of the submitted version. Walid El Kamash: Methodology development; theoretical framework formulation; numerical model calibration and validation; contribution to finite difference modelling using FLAC 3D; technical review of results; manuscript editing and critical review. Mohamed M. H. Mostafa: Data analysis and visualization; assistance with numerical simulations; interpretation of parametric study results; preparation of figures and tables; contribution to writing specific sections (results and discussion); manuscript proofreading. All authors have read and agreed to the published version of the manuscript and take responsibility for the integrity of the work as a whole.
Conflict of interest statement
The authors declare that they have no known competing financial interests or personal relationships that could have appeared to influence the work reported in this paper.