
Many different failure criteria, being part of soil constitutive models, can be found in the literature. The basic one to which all others are usually compared is the Mohr–Coulomb condition, due to its simplicity. It proved its usefulness in classic triaxial compression, where a cylindrical soil sample is subjected to an axisymmetric state of stress (σ1, σ2 = σ3, Fig. 1a). However, the problem of soil strength is more complex when true triaxial stress conditions are considered, and the principal stresses σ1, σ2, σ3 have different values (Fig. 1b).

Two-dimensional and three-dimensional soil stress states: a) cylindrical sample in axisymmetric stress conditions, σ2 = σ3 and b) rectangular sample in true triaxial conditions, σ1 ≠ σ2 ≠ σ3.
This paper considers the most frequently used isotropic soil failure criteria (yield surfaces): Mohr–Coulomb, Drucker–Prager, Matsuoka–Nakai and Lade–Duncan. The detailed descriptions of the selected criteria are in Drucker and Prager (1952), Lade and Duncan (1975), Matsuoka and Nakai (1974) and Matsuoka and Nakai (1985).
The research on soil failure continues, and except listed above, there are also other criteria proposed in the literature. Georgiadis et al. (2004), Houlsby (1986) or Liu et al. (2012) suggest a yield surface which is a combination of the criteria mentioned above. Lagioia and Panteghini (2014) present a reformulation of the original Matsuoka–Nakai criterion to overcome the limitations which make its use in a stress point algorithm problematic. A novel soil strength criterion, where the cube root of principal stresses is constant, is proposed by Shao et al. (2017), and it shows that the Lade–Duncan criterion is not just an empirical one, as previously thought, but has a physical background.
Mohr–Coulomb failure condition is built on simplifying assumption that soil behaviour is governed by the difference between maximum and minimum principal stress (σ1 - σ3) and does not depend on the intermediate principal stress (σ2). It is clear that such simplification may be valid in some special conditions only. The influence of the intermediate principal stress σ2 on soil shear strength is discussed by Bishop (1971), Kulhawy and Mayne (1990) or Ochiai and Lade (1983). Barreto and O’Sullivan (2012) examined the effect of inter-particle friction (μ) and the intermediate stress σ2 on the granular material's response, using the discrete element method (DEM). They have shown that both parameters significantly affect the strength characteristics. DEM is also used by Li et al. (2017) to describe the behaviour of soil under complex stress state. They observed that the Bishop's parameter b (Eq. (9)) significantly affects the non-coaxial behaviour of granular materials.
The contribution of the intermediate principal stress σ2 to the plane strain soil strength is particularly studied for practical reasons: to analyse longitudinal foundations, slopes, retaining walls and long excavations. Besides, many experimental techniques, like full-field displacement measurements by digital image correlation (DIC), are usually performed on rectangular plane strain models. Also ground flow problems, static liquefaction and instability are studied in plane strain conditions (Wanatowski and Chu, 2007; Wanatowski et al. 2010).
Experimental investigations of dense granular soils have shown that the plane strain shear strength is higher than that in the axisymmetric conditions (Alshibli et al., 2003). In the case of loose soils, there is no such difference; see Cornforth (1964), Lee (1970), Rowe (1969) and Schanz and Vermeer (1996).
Soil strength can be defined depending on strain conditions (plane or three-dimensional), but also on the range of strains (peak or critical strength). In this paper, the peak soil strength is considered a measure of soil failure state.
Peak strength is the maximum shear stress (maximum q value, Eq. (7)) that the soil can transfer. It is influenced by inter-particle friction, grain arrangement, grain crushing and soil dilation (Mitchell and Soga, 2005). Fig. 2 shows the exemplary results of soil shearing in plane strain conditions (details of the experiment are included in Tables 2 and 3). Fig. 2a defines the peak strength qmax on q − ɛ1 (axial strain) graph, and Fig. 2b shows the corresponding set of principal stress values. The major principal stress σ1 is always the largest, whereas the lateral stress σ2 is the intermediate one. In the paper, the soil mechanics sign convention is used (compression positive). The invariant q is defined under full stress conditions, including the meaning of σ2; see formula (7).
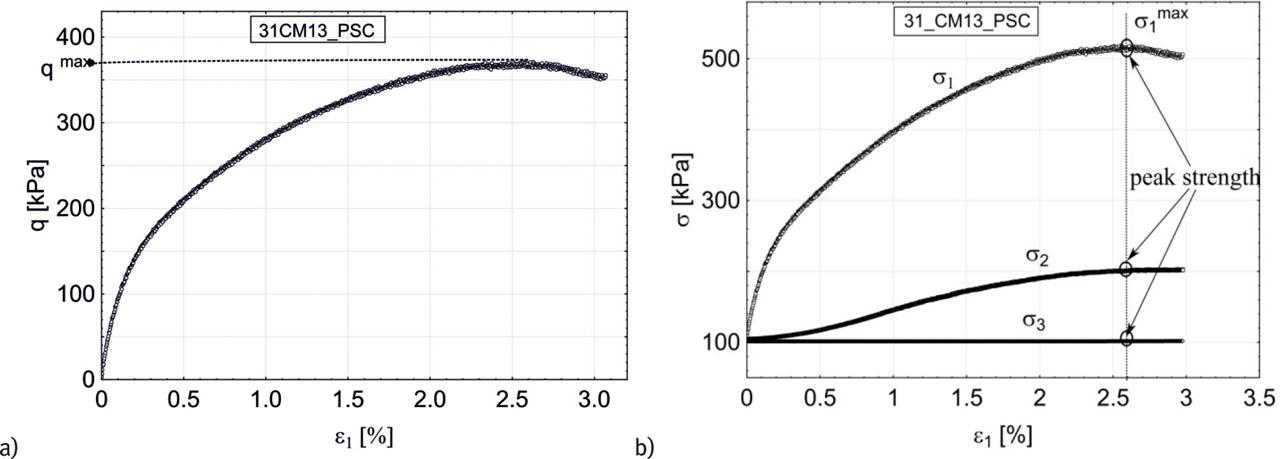
The principal stress and axial strain curves for the selected test in plane strain conditions: a) q(ɛ1) and b) σ1(ɛ1), σ2(ɛ1) and σ3(ɛ1).
Unlike critical soil strength, peak strength depends on the initial density of soil. Most of the research on soil peak strength uses Mohr–Coulomb condition and so the dependence of peak friction angle on soil density. Been and Jefferies (1985, 1986) have shown the relationship between the peak friction angle and the soil state parameter, defined as the difference in void ratio between the initial and steady-state, at the same mean effective stress.
Bolton (1986) studied the relationship between the mobilized friction angle, critical state friction angle and soil relative density in plane strain conditions and proposed the equation describing this relationship. Chakraborty and Salgado (2010) confirmed Bolton's theory for low confining pressures (triaxial and plane strain tests). The effect of confining pressure on peak friction angle in the process of grain crushing is shown in Yamamuro and Lade (1996): as confining pressure increases, the peak friction angle decreases. Sadrekarimi and Olson (2011) or Sarkar et al. (2019) show, in turn, that there exists no clear relationship between the peak friction angle and the effective stress.
The direct dependence of the friction angle on the initial soil porosity was shown already in Lee (1970), where analysed the data obtained in drained tests by Bishop (1961) and Cornforth (1964). The tests were conducted at confining pressure of 275 kPa, both in axisymmetric and plane strain conditions.
Fig. 3 shows their results, completed by the data obtained in this study for Skarpa sand at similar confining pressures between 278 kPa and 295 kPa (Tables 2 and 4). The same tendency: a decrease in the internal friction angle with growing sample porosity is observed in true triaxial tests on Skarpa sand under plane strain conditions, but no quantitative agreement is found, because they are two different soils.

Comparison of the results from drained triaxial and plane strain tests on sand [18] and true-triaxial tests on Skarpa sand.
The main purpose of this study is to establish, both experimentally and semi-theoretically, the parameters characterizing different soil failure criteria, presented in Section 2, and their relationship to the internal friction angle in a given range of initial soil densities in plane strain state.
The experimental way of finding the parameters involves determining the set of principal stress values σ1, σ2 and σ3, corresponding to the soil peak strength (Fig. 2). The same parameters are calculated semi-theoretically using the approach proposed by Vikash and Prashant (2010). The associated flow rule and plane strain condition are used to express the parameters as functions of the plane strain friction angle. The basic difference between the experimental and semi-theoretical approach concerns the intermediate stress σ2. In experiments, its value comes from the direct measurements; in calculations, it is determined on the base of the accepted assumptions and is different for each failure criterion. Validation of the Vikash and Prashant approach on the base of stress measurements is another purpose of the study.
The soil failure criteria are usually formulated using stress invariants, independent of the choice of the coordinate system. In standard triaxial conditions, two invariants of the stress tensor are enough to describe the state of stress and any load path in the stress space. In the true triaxial state, three different principal stresses exist; therefore, one more invariant is needed. Often, combinations of the basic invariants of the stress tensor are used to formulate failure criteria.
Soil failure state is graphically represented, in 3D stress space, by the surface which separates the allowable stress states from the states of uncontrolled plastic flow and is called yield surface. It is accepted in this study that the yield surface corresponds to the stress states at which a soil reaches its maximum (peak) strength. The failure criteria considered in this paper describe the shape of the yield surface and differ in cross-section on the deviatoric plane, perpendicular to the hydrostatic axis σ1 = σ2 = σ3 (Fig. 4).

Failure surfaces in the deviatoric plane, see Georgiadis et al. (2004). In plane strain conditions, Lode angle varies roughly from θ = 10° to θ = 20°.
The mean stress p and deviator stress q are most frequently employed for axisymmetric stress conditions. In the case of the true triaxial state, they are usually completed by Lode angle θ. In case of dry granular material invariants, p, q and θ can be expressed using the basic invariants of total or deviatoric stress tensor, defined by Eqs. (1)–(5):
- a)
The basic invariants of the total stress tensor σ:
(1) {I_1} = {\sigma _{{\rm{ii}}}} = {\sigma _1} + {\sigma _2} + {\sigma _3}, (2) {I_2} = {1 \over 2}\left( {{\sigma _{{\rm{ii}}}}{\sigma _{{\rm{jj}}}} - {\sigma _{{\rm{ij}}}}{\sigma _{{\rm{ij}}}}} \right) = {\sigma _1}{\sigma _2} + {\sigma _1}{\sigma _3} + {\sigma _2}{\sigma _3}, (3) {I_3} = \det {\boldsymbol {\sigma }} = {\sigma _1}{\sigma _2}{\sigma _3}, - b)
The basic invariants of the deviatoric stress tensor
{\boldsymbol {s}} = {\boldsymbol {\sigma }} - {1 \over 3}{\rm{tr}}\left( {\boldsymbol {\sigma }} \right){\bf{1}} (4) {J_2} = {1 \over 2}{\boldsymbol {s:s}} = {1 \over 2}{s_{ij}}{s_{ij}} = {1 \over 6}\left( {{{\left( {{\sigma _1} - {\sigma _2}} \right)}^2} + {{\left( {{\sigma _1} - {\sigma _3}} \right)}^2} + {{\left( {{\sigma _2} - {\sigma _3}} \right)}^2}} \right) (5) {J_3} = {\rm{det}}{\boldsymbol {s}} = {1 \over 3}{s_{ij}}{s_{jk}}{s_{ki}}
The mean stress p, deviator stress q and Lode angle θ are defined by Eqs. (6), (7) and (8).
In classical triaxial compression θ = 0°, in triaxial extension θ =60°, generally 0° < θ < 60°.
Lode angle is in some studies replaced by its alternative – the Bishop's parameter b is defined by Eq. (9) and related to θ by Eq. (10).
Mohr–Coulomb (M-C) failure surface FM-C for non-cohesive soil can be described by equation (11):
Drucker–Prager (D-P) failure criterion was established as a generalization of the Mohr–Coulomb condition; see Drucker and Prager (1952), and this criterion for non-cohesive soil is described by equation (12):
Lade–Duncan (L-D) criterion – true triaxial experiments (especially in plane strain conditions) prove that shear strength for intermediate values of Lode angle (0° < θ < 60°) is higher than that resulting from the M-C criterion in the classical triaxial test; see Eekelen (1980), Lade and Duncan (1973) and Sławińska (2018). An empirical criterion which takes into account these observations is called Lade–Duncan (L-D) criterion (Eq. (13)):
Matsuoka–Nakai (M-N) criterion is proposed on the basis of spatially mobilized plane concept (Matsuoka and Nakai, 1974). This criterion, based on theoretical considerations, is described by the relation (14):
Soil parameters ϕ, κD-P, κL-D and κM-N, appearing in the failure criteria, can be determined directly from Eqs. (11)–(14) using the principal stress values corresponding to the peak soil strength measured experimentally or on the semi-theoretical way, where σ2 is determined assuming the associated flow rule and the plane strain condition and only σ1max and σ3 are measured.
Transforming equations (11)–(14) gives the expressions (15)–(18) which allow to determine the parameters of failure criteria using the measured values of σ1max, σ2 and σ3:
The associated flow rule comes from the rigorous formulation of the plasticity theory, while the non-associated one is only semi-theoretically postulated. The latter was introduced for soils to reduce the mismatch between measured and theoretically predicted volumetric strains in element tests. However, the solution of this particular problem introduces another problem, namely the non-coaxiality of the stress and strain tensors. It is difficult to measure experimentally and limits the application of the upper-bound theorem, based on the assumption of the associated flow rule and frequently used in limit analysis solutions of soil mechanics boundary value problems (e.g. Deusdado et al., 2016, di Santolo et al., 2012).
As a result, both the associated and non-associated flow rules are still used to model soil behaviour, depending on the nature of the problems studied.
Liu (2013) shows various results of triaxial compression tests on sands and their simulations using both the associated and non-associated flow rules. Similar simulations for more complex stress paths in the p - q - θ space can be found in Chan (1988) and Ling and Liu (2003). Their research demonstrates that the associated flow rule predicts well the results of triaxial compression tests for medium and medium-dense soils in the pre-peak stage and under drained conditions. The non-associated flow rule, on the other hand, gives better results for the unstable response of saturated loose sand and under undrained condition. According to these findings, it is justified to use the associated flow rule to analyse the behaviour of medium and medium-dense sand samples up to the peak strength, if volume changes are still significant and no distinct localization occurs.
Plastic flow rule can describe soil deformation at failure state. Its general formulation, as a non-associated flow rule, is given by Eq. (19):
In the Appendix, the set (20) is presented in the expanded form, specific for each failure condition. The set can be completed by Eq. (21), valid in plane strain conditions, to express κD-P, κL-D and κM-N as functions of the internal friction angle ϕps.
To solve (20), first the intermediate principal stress σ2 is determined as a function of σ1 and σ3, separately for D-P, L-D and M-N yield conditions:
It can be seen from Eqs. (22)–(24) that each condition gives the different expression for the intermediate stress σ2. Finally, the following expressions for κD-P, κL-D and κM-N are obtained from the set (20), taking into account Eqs. (21)–(24):
The series of tests in true triaxial apparatus in plane strain conditions were performed to verify both approaches of determining failure criteria parameters. Limiting the strains to plane (two-dimensional) case induces some partly controlled three-dimensional stress state, where σ2 comes from the soil reaction and cannot be applied a priori, but has to be measured. The non-zero σ2 in plane strain condition has always been a problem in interpreting the results of standard 2D soil mechanics tests.
The tests in this study were carried out on Skarpa sand samples at different confining pressures and initial void ratios. All the tests were performed in dry conditions. Basic properties of Skarpa sand are collected in Table 1.
Parameters of Skarpa sand.
| Specific density [kg/m3] | 2650 |
| Mean particle size [mm] | D50 - 0.42 |
| Uniformity coefficient [ − ] | U = 2.5 |
| Minimum void ratio [ − ] | emin = 0.432 |
| Maximum void ratio [ − ] | emax = 0.677 |
The plane strain tests, with deformation fixed in x2 principal stress direction (ɛ2 = 0, Fig. 5), were carried out in true triaxial apparatus. The Electro-Mechanical True Triaxial Apparatus (EMTTA) is manufactured by the British company GDS Instruments Ltd. and is shown in Fig. 6. Plane strain condition can be imposed on the rectangular samples of 150 × 75 × 75 mm dimensions in this type of true triaxial apparatus by fixing the position of the side platens to prevent their movement (Fig. 7). Depending on the way the stresses are exerted on the test specimen, EMTTA is mixed type, with flexible membrane (horizontal stress) and rigid end platens (axial stress).

Layout of the soil sample under plane strain conditions in EMTTA.

Components of EMTTA, used in the study.
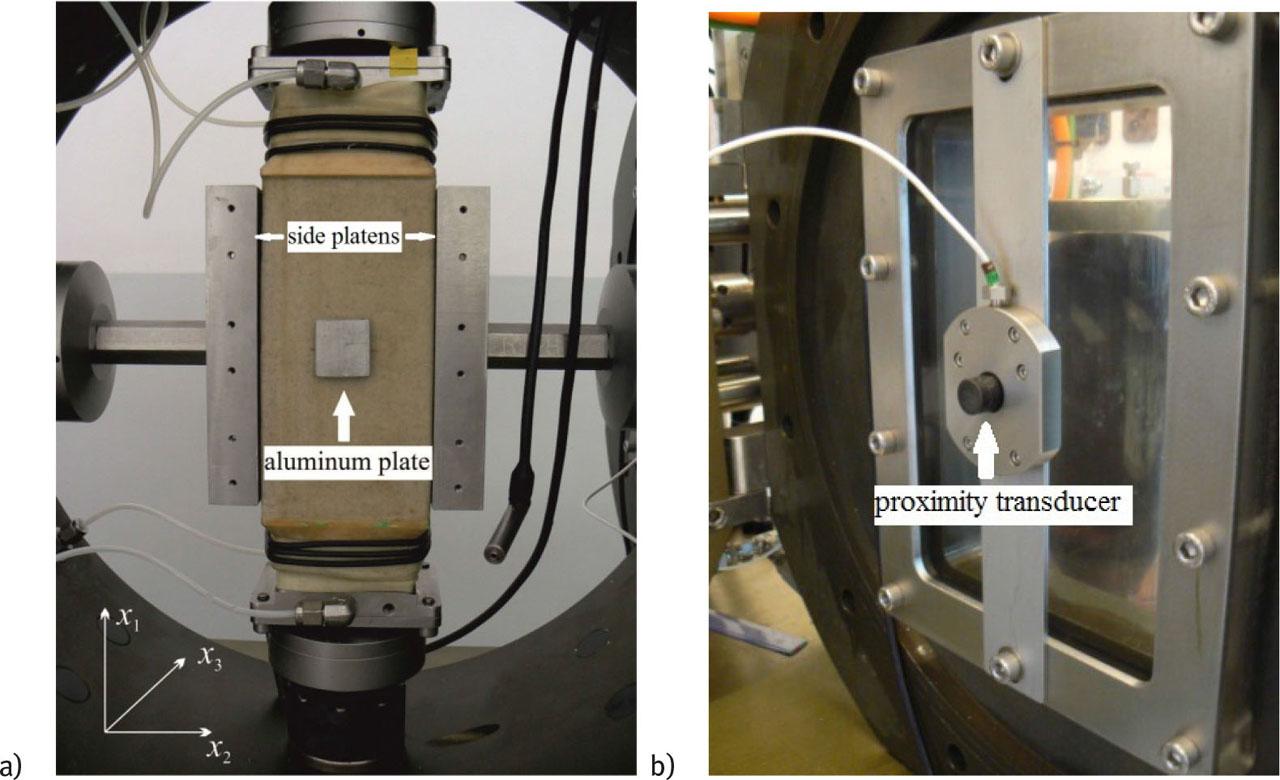
a) The GDS EMTTA chamber with a sample prepared for the test. The role of the side plates is to prevent soil deformations in the x2direction, b) proximity transducer on the doors of the measurement cell (test chamber).
Fig. 7a shows the sample ready for the test, with the side platens fixed. After installing the sample in the testing chamber (measurement cell, Fig. 6), its doors are closed and it is filled with water, then the side platens are gently pressed against the specimen until the difference between horizontal stresses σ2 - σ3 is about 2–3 kPa, to secure the proper contact. To reduce friction between the membrane and the side plates, the plates are lubricated with a special lubricant.
Specimen base pedestal is connected to the pressure/volume controller (back pressure controller, Fig. 6), which is used to apply and measure the pore water pressure and volume changes. Cell pressure is controlled by a pneumatic-hydraulic system (a cell pressure controller), where required value can be set. In addition, TTA is also equipped with a cell pressure transducer (see Fig. 6) located inside the chamber.
Vertical actuators shown in Fig. 6 are used to apply the major σ1 principal stress. The horizontal stress σ3 is applied through the water pressure in the chamber, and σ2 is recorded by a gauge located on vertical actuators.
In order to measure the specimen displacements in x3 direction, two proximity transducers are installed on the inner side of both cell doors, exactly at their centre (Fig. 7b). When the sample deforms, the changes in a distance between the square aluminium plate (Fig. 7a), adhered to the sample and the transducers, are recorded, giving the local value of the displacement. Based on this measurement, ɛ3 is calculated. Displacement in x1 direction is measured by LVDT transducers attached to each actuator; the vertical strain ɛ1 is calculated on its base.
Soil samples are prepared in a membrane-lined split mould by air pluviation. This method involves preparing a soil sample using a funnel with a nozzle of approximately 5 mm. The weighed sand is placed in the funnel at the selected distance from the centre of the mould. The height of the funnel and the mass of sand are determined by ‘trial and error’ to obtain the appropriate relative density (Li et al., 2018).
Eleven tests were carried out according to the same procedure. The tests consisted of two phases:
- a)
Phase 1 (isotropic compression): the sample is loaded isotropically by increasing water pressure in the testing chamber (σ3c in Table 2). This is not carried out under plane strain conditions. The side plates, pressed against the sample, move along with it, while a constant set value of lateral stress (about 2–3 kPa) is maintained.
- b)
Phase 2 (shear): the sample is vertically loaded with a constant vertical displacement rate of 15 mm/hour at constant chamber pressure (σ1 = σ3c = const) in plane strain conditions.
The samples’ porosities were between 0.316 and 0.36 (the relative densities
Table 2 contains the initial conditions of all tested samples: the initial void ratio at the start of Phase 1 (e), the void ratio and porosity after isotropic compression, at the beginning of Phase 2 (ec, nc) and the applied confining pressure (σ3c). Also, the relative density ID, defined by Eq. (28), is given.
The basic results of the eleven tests listed in Table 1 are gathered in Figs 8–11. Each of the figures shows the full set of curves for all the tests: deviator stress (Fig. 8), maximum principal stress (Fig. 9), principal stress in the direction of fixed strain (Fig. 10) and volumetric strain (Fig. 11), as functions of the axial strain.
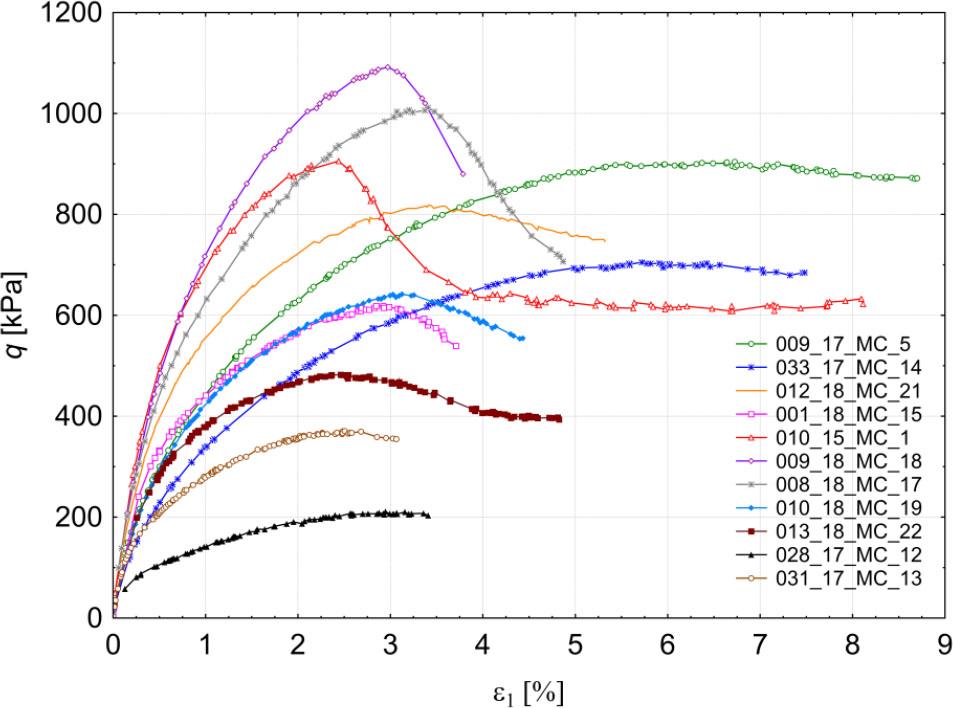
Results of the experimental tests listed in Table 1: deviator stress as a function of the axial strain q(ɛ1).

Results of the experimental tests listed in Table 1: maximum principal stress as a function of the axial strain σ1(ɛ1).
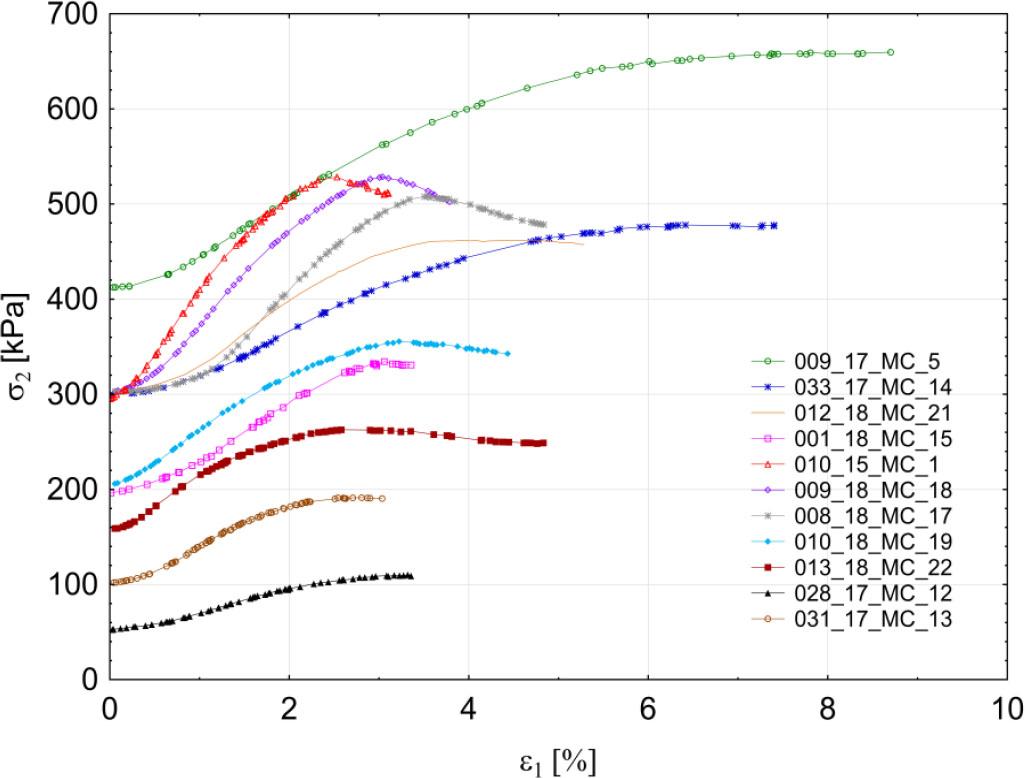
Results of the experimental tests listed in Table 1: principal stress in the direction of fixed strain (ɛ2 = 0) as a function of the axial strain σ2(ɛ1).

Results of the experimental tests listed in Table 1: volumetric strain as a function of the axial strain ɛv(ɛ1).
The sets are highly varied because they correspond to the samples of different densities (medium to very dense), tested at different confining pressures (Table 2). The axial strain at which the peak strength occurs is determined for each test on the base of Fig. 8, and then, the corresponding values of σ1max, σ2 and σ3 are established, like it is demonstrated in Fig. 2.
Initial test conditions.
| Test | e | ID | σc3[kPa] | ec |
| nc |
|---|---|---|---|---|---|---|
| 009_17_MC_5 | 0.585 | 0.376 | 391 | 0.563 | 0.465 | 0.36 |
| 033_17_MC_14 | 0.559 | 0.482 | 293 | 0.548 | 0.527 | 0.354 |
| 012_18_MC_21 | 0.541 | 0.555 | 292 | 0.532 | 0.592 | 0.347 |
| 013_18_MC_22 | 0.519 | 0.645 | 146 | 0.514 | 0.665 | 0.339 |
| 010_18_MC_19 | 0.517 | 0.653 | 195 | 0.508 | 0.690 | 0.337 |
| 001_18_MC_15 | 0.521 | 0.637 | 191 | 0.499 | 0.727 | 0.333 |
| 010_15_MC_1 | 0.496 | 0.739 | 278 | 0.490 | 0.763 | 0.329 |
| 009_18_MC_18 | 0.488 | 0.771 | 292 | 0.480 | 0.804 | 0.324 |
| 008_18_MC_17 | 0.489 | 0.767 | 295 | 0.476 | 0.820 | 0.322 |
| 028_17_MC_12 | 0.467 | 0.857 | 52 | 0.462 | 0.878 | 0.316 |
| 031_17_MC_13 | 0.469 | 0.849 | 99 | 0.462 | 0.878 | 0.316 |
Fig. 11 shows that dilative behaviour is observed in all the tested samples. The volumetric strain reaches the maximum (compression is positive), which is typical for dense samples. The maximum value of the deviator stress q was observed in test ‘009_17_MC_5’ (Fig. 8). The corresponding axial stress equals σ1max = 1402 kPa (Fig. 9). At this range of stress, no grain crushing is possible in case of silica sand, so it is accepted that no grain crushing occurred in the tests; see Yang et al. (2010). Table 3 presents the measured values of σ1max, σ2, σ3, defining the peak strength of each sample, and p, q, θ and b, calculated on their base.
Characteristics of peak strength state for the tested samples.
| Test | σ1max [kPa] | σ2 [kPa] | σ3 [kPa] | p [kPa] | q [kPa] | b [ − ] | θ [ ° ] |
|---|---|---|---|---|---|---|---|
| 009_17_MC_5 | 1402 | 653 | 391 | 815 | 909 | 0.26 | 14.46 |
| 033_17_MC_14 | 1072 | 479 | 293 | 615 | 705 | 0.24 | 13.21 |
| 012_18_MC_21 | 1184 | 459 | 292 | 645 | 821 | 0.19 | 10.14 |
| 013_18_MC_22 | 678 | 262 | 146 | 362 | 485 | 0.22 | 11.97 |
| 010_18_MC_19 | 902 | 355 | 195 | 484 | 642 | 0.23 | 12.46 |
| 001_18_MC_15 | 870 | 332 | 191 | 464 | 621 | 0.21 | 11.35 |
| 010_15_MC_1 | 1291 | 529 | 278 | 699 | 914 | 0.25 | 13.76 |
| 009_18_MC_18 | 1483 | 528 | 292 | 768 | 1092 | 0.20 | 10.78 |
| 008_18_MC_17 | 1396 | 506 | 295 | 732 | 1012 | 0.19 | 10.40 |
| 028_17_MC_12 | 287 | 109 | 52 | 149 | 212 | 0.24 | 13.44 |
| 031_17_MC_13 | 508 | 191 | 99 | 266 | 372 | 0.22 | 12.38 |
Figs 8–11 represent the whole course of the experimental tests, showing pre- and post-peak behaviour. Only the pre-peak part of the tests, defined on the basis of Figs 8–11, is analysed in the paper. Before the onset of localization, the deviator peak strength (not the critical strength) is used. The literature shows that localization is observed after the deviator peak strength has been reached, e.g. Leśniewska et al (2012) and Desrues and Viggiani (2004).
Fig. 12 shows the relationship between principal stress components, corresponding to the peak soil strength q: σ1max (σ3) and σ2(σ3), which can be estimated with sufficient accuracy by straight lines (r = 0.94 and r = 0.9, where r is Pearson's coefficient). Fig. 12 also confirms that in all the tests, the measured σ2 is always the intermediate principal stress.

Relations between principal stress components, corresponding to peak soil strength: σ1max (σ3) and σ2(σ3).
Fig. 13 collects the values of Lode angle calculated using Eq. (8) and the data from Table 3, and it suggests that there is no statistically significant difference in Lode angle due to varying principal stress σ2 or confining pressure σ3. The Lode angle is considered constant at θ = 12.6° (calculated as an arithmetic average), but its scatter around this value is considerable, which is probably related to the unavoidable problem of forming soil samples of repeatable structure. The value of the Lode angle may also depend in a more complex way on the initial density of the soil sample or confining pressure. This problem is open.

Relation between Lode angle θ and intermediate stress σ2.
The constant and relatively low value of Lode angle obtained for all the tests from Table 3 confirms that in plane strain conditions, the influence of the intermediate stress σ2 on the soil peak behaviour is limited and does not depend on the confining pressure. The question remains, how to estimate the magnitude of this influence.
Values of parameters
Characteristic parameters of Drucker–Prager, Matsuoka–Nakai and Lade–Duncan soil failure criteria, obtained from direct stress measurements (A) and the associated flow rule assuming plane strain conditions (B).
| Test | A. Direct stress measurements Eqs. (15)–(18) | B. Flow rule and plane strain condition Eqs. (25)–(27) | ||||||||
|---|---|---|---|---|---|---|---|---|---|---|
| ϕps |
|
|
|
|
|
|
|
|
| |
| 009_17_MC_5 | 34.3° | 0.21 | 11.7 | 40.9 | 1181.5 | 740.4 | 896.5 | 0.179 | 11.7 | 39.6 |
| 033_17_MC_14 | 34.8° | 0.22 | 11.9 | 41.7 | 904.8 | 560.4 | 682.5 | 0.181 | 11.8 | 40.0 |
| 012_18_MC_21 | 37.2° | 0.25 | 12.5 | 45.7 | 1007.5 | 588.0 | 738 | 0.190 | 12.3 | 42.5 |
| 013_18_MC_22 | 40.2° | 0.26 | 13.2 | 49.4 | 583.8 | 314.6 | 412 | 0.202 | 13.1 | 46.3 |
| 010_18_MC_19 | 40.1° | 0.26 | 13.1 | 49.0 | 776.3 | 419.3 | 548.5 | 0.201 | 13.1 | 46.2 |
| 001_18_MC_15 | 39.8° | 0.26 | 13.1 | 49.0 | 747.8 | 407.6 | 530.5 | 0.200 | 13.0 | 45.7 |
| 010_15_MC_1 | 40.2° | 0.25 | 13.1 | 48.6 | 1111.5 | 599.1 | 784.5 | 0.202 | 13.1 | 46.3 |
| 009_18_MC_18 | 42.1° | 0.27 | 13.8 | 53.4 | 1287.1 | 658.1 | 887.5 | 0.209 | 13.7 | 49.1 |
| 008_18_MC_17 | 40.6° | 0.27 | 13.4 | 50.9 | 1203.9 | 641.7 | 745.5 | 0.203 | 13.2 | 46.9 |
| 028_17_MC_12 | 43.9° | 0.27 | 14.3 | 55.3 | 251.0 | 122.1 | 169.5 | 0.215 | 14.3 | 52.0 |
| 031_17_MC_13 | 42.4° | 0.27 | 13.8 | 52.9 | 441.3 | 224.3 | 303.5 | 0.209 | 13.7 | 46.5 |
The data included in Table 4 are presented in Figs 14–17. First, the relationship between the intermediate principal stress σ2 for Drucker–Prager, Matsuoka–Nakai and Lade–Duncan criteria, obtained from Eqs. (22)–(24) and measured in the experiments, is analysed, and then Vikash and Prashant solution, given by Eqs. (25)–(27), is verified experimentally.
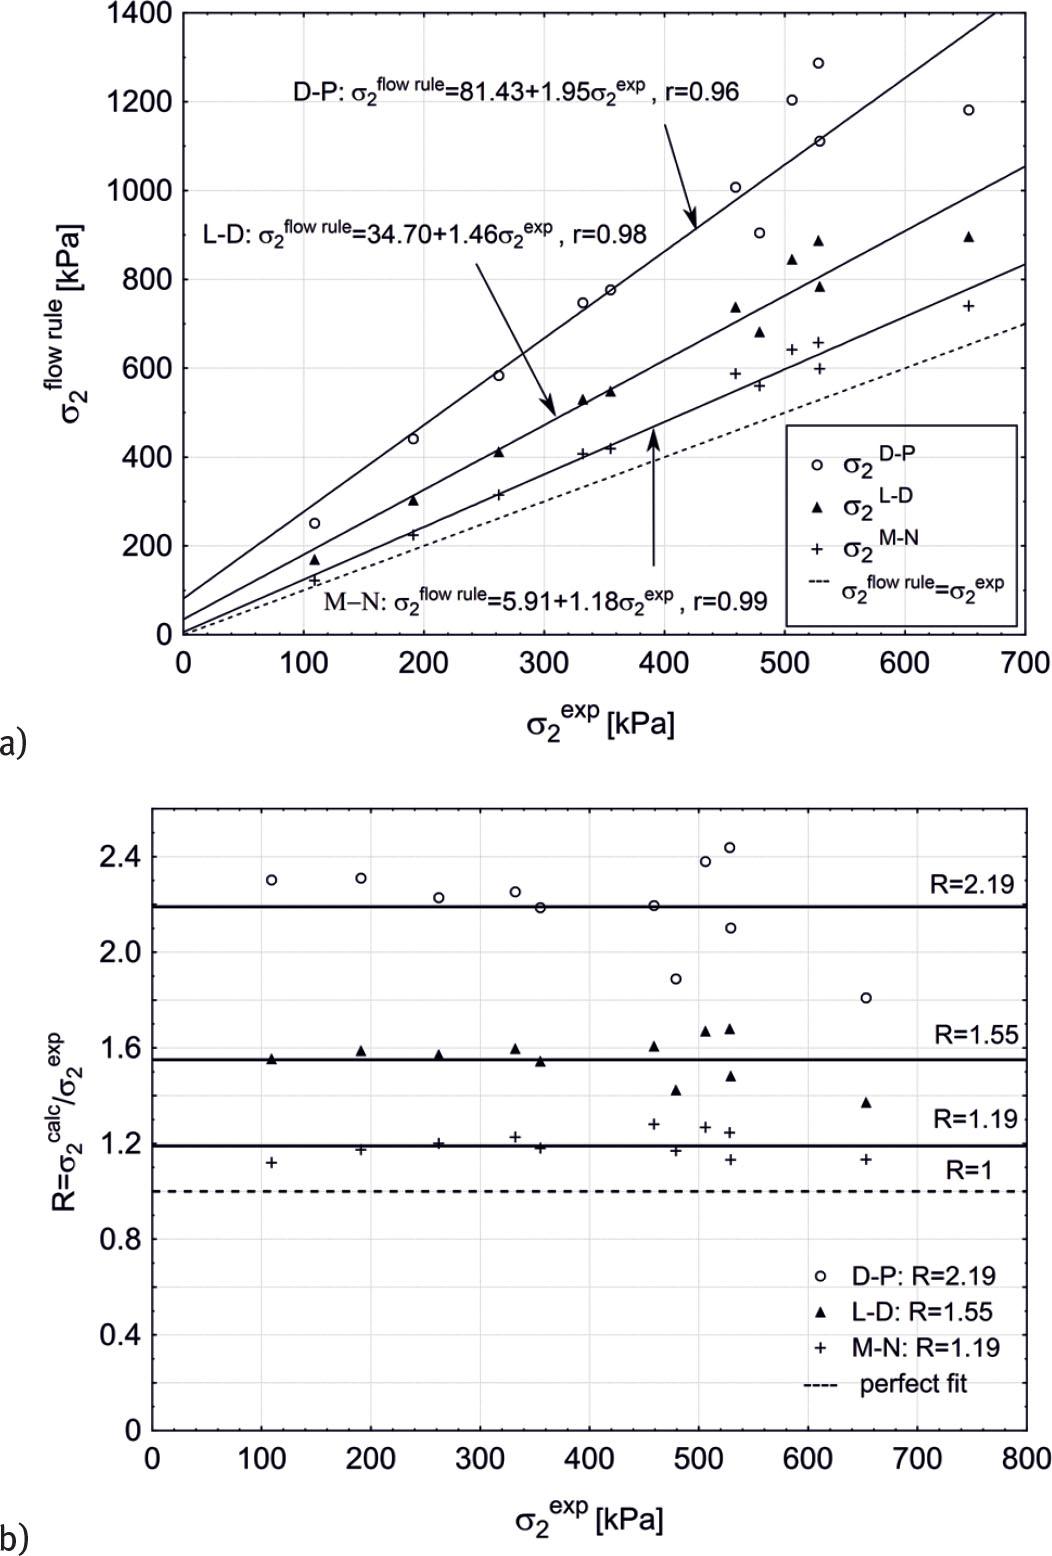
The intermediate stress σ2, obtained for Drucker–Prager (D-P), Matsuoka–Nakai (M-N) and Lade–Duncan (L-D) failure criteria, assuming plane strain condition and the associated flow rule, as function of the measured σ2 (Table 3): (a) σ2calc (σ2exp) and (b) R(σ2exp), where R = σ2calc/σ2exp.
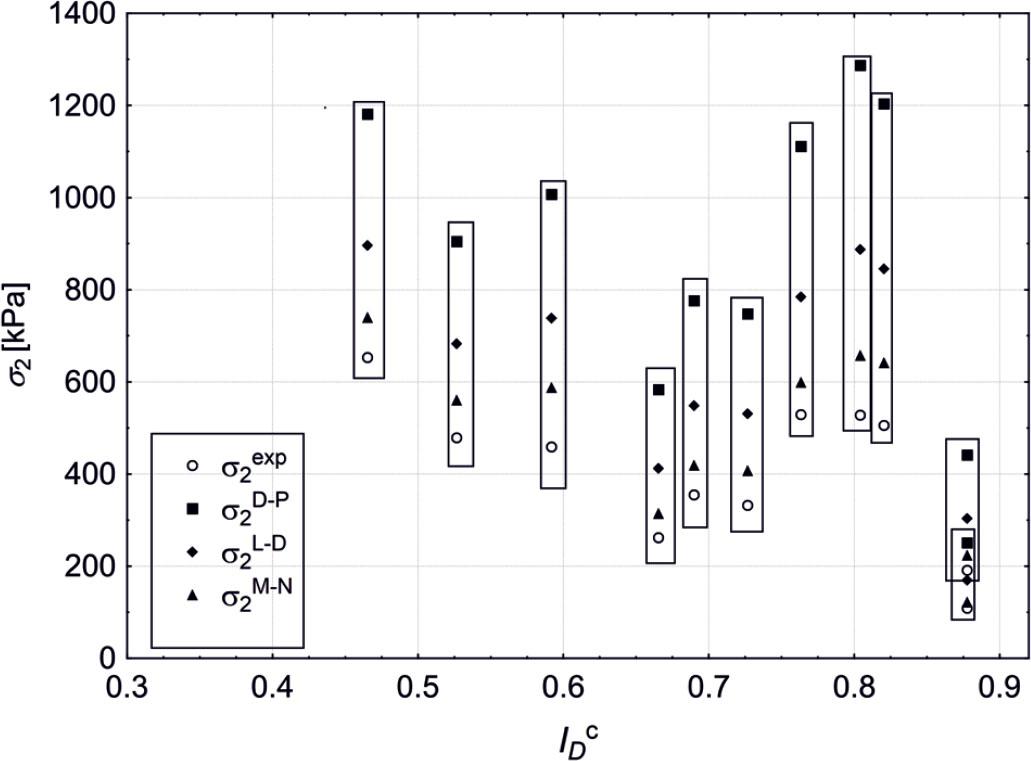
Dependence of the ratio of intermediate stress σ2 to confining pressure σ3 (Table 4) on the initial relative density of Skarpa sand.
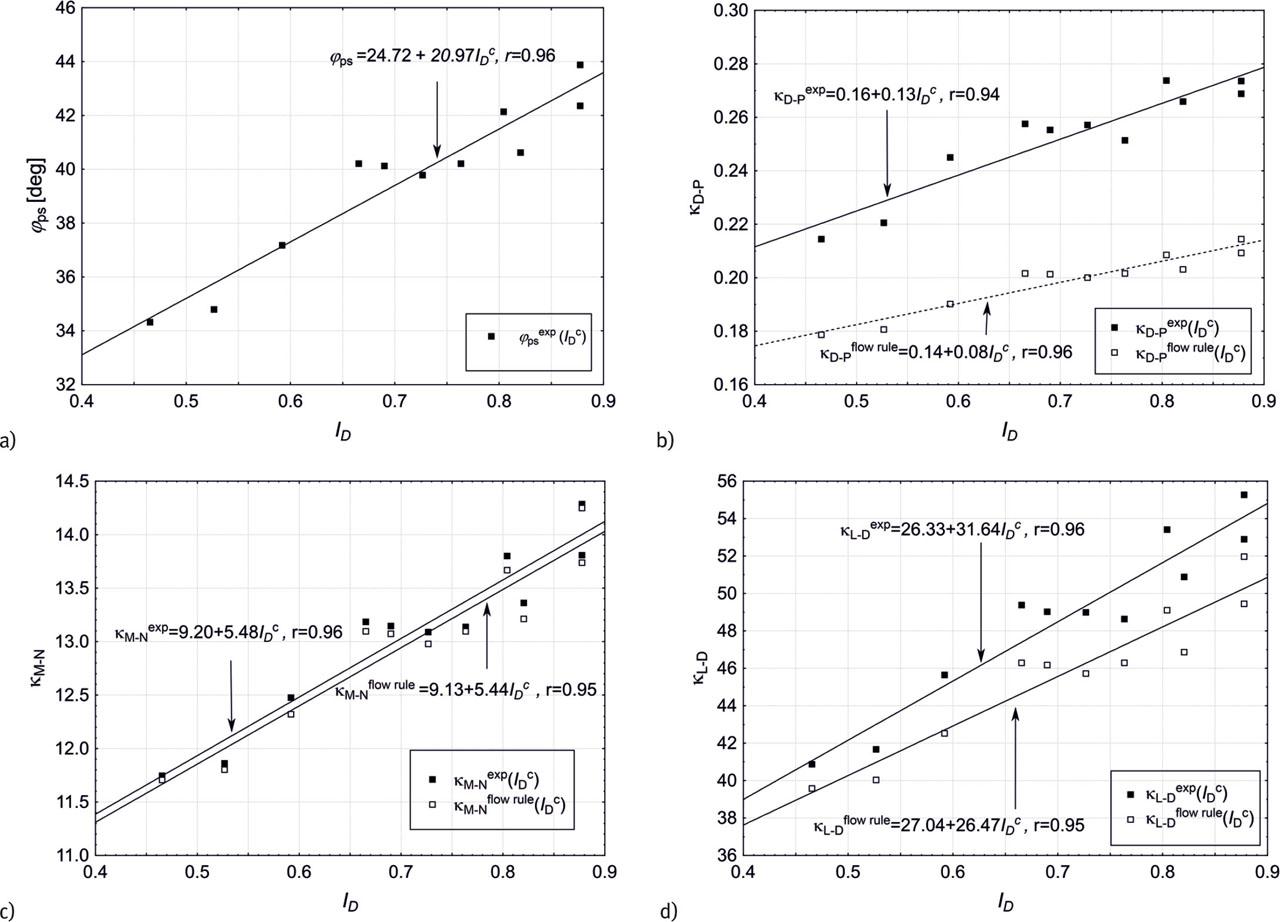
Parameters of Mohr–Coulomb (M-C), Drucker–Prager (D-C), Matsuoka–Nakai (M-N) and Lade–Duncan (L-D) failure criteria depending on soil relative density: (a) friction angle ϕ, (b)–(d) comparison of κD-P, κL-D and κM-N, obtained by Eqs. (16)–(18) (full stress state measurement) and Eqs. (25)–(27) (plane strain condition – Vikash and Prashant approach).
Fig. 14a presents σ2D-P, σ2M-N and σ2L-D as functions of the experimental σ2, taken from Table 3. A perfect fit between the calculated and measured values would mean that they lie on the dashed line σ2calc = σ2exp, shown in the figure.
A linear relationship between the calculated and measured intermediate stress σ2 for all three selected criteria is found, but only Matsuoka–Nakai is close to the perfect fit. The ratio R = σ2calc / σ2exp plotted in Fig. 14b shows three constant trends: 2.15 for Drucker–Prager, 1.52 for Lade–Duncan and 1.17 for Matsuoka–Nakai condition, with perfect fit equal to 1. It means that the Vikash and Prashant (2010) approach, highly overestimates the influence of the intermediate stress in plane strain conditions for Drucker–Prager, gives about 50% overestimation for Lade–Duncan and is close to measured values for Matsuoka–Nakai criterion.
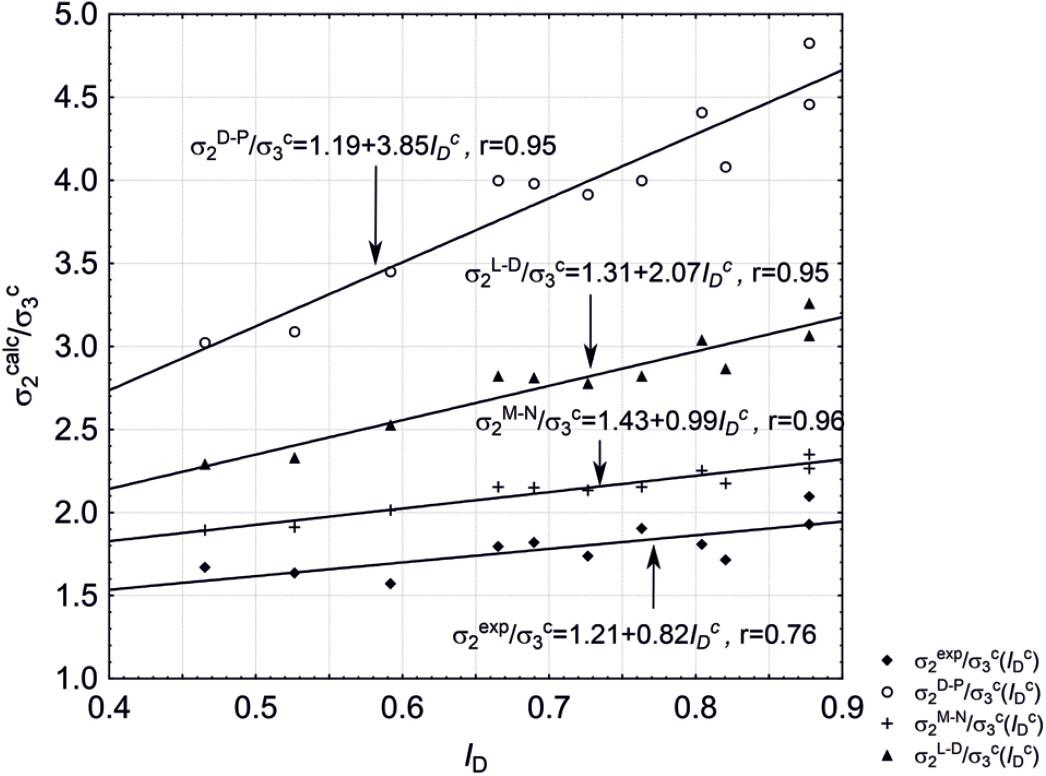
Fig. 15 shows the dependence of the intermediate stress σ2, measured and calculated by Eqs. (25)–(27), on the initial relative density of Skarpa sand. There is no clear tendency visible because the tests presented in the paper were performed at different confining pressures. If the ratio of σ2 to the confining pressure σ3c is examined instead (Fig. 16), the linear trends appear both in the case of measured and calculated values and again the Matsuoka–Nakai criterion is closest to reality.
Parameters ϕps, κD-, κL-D and κM-N, obtained by Eqs. (15)–(18), requiring knowledge of the full set of principal stresses σ1, σ2 and σ3, and by Vikash and Prashant approach, which requires measurement of two principal stresses only (σ1 and σ1), are shown in Fig. 17, as functions of the relative density ID, for all the true triaxial tests (Tables 2–4).
It is possible in Vikash and Prashant approach to replace σ1 and σ3 by the internal friction angle ϕps (Eqs. (25)–(27)). The internal friction angle for plane strain condition can be obtained directly from the relation (21) and play the role of the independent variable that specifies κD-P, κL-D and κM-N.
Fig. 17(a) shows the relation between the M-C friction angle ϕps and the relative density
There is no such a good fit in case of Drucker–Prager and Lade–Duncan conditions. As Matsuoka–Nakai criterion is most commonly used to estimate soil strength in complex stress states, this finding can help to determine parameters necessary for numerical analysis of plane strain problems in a relatively simple way.
All three failure conditions give linear increase of κM-N, κD-P and κM-N with soil relative density, regardless of the way they are obtained, as expected.
The linear fits for the failure criteria parameter κexp, obtained from the direct stress measurement of σ1max, σ2 and σ3 (Table 3) and expressed as a function of the relative soil density (ID) or the plane strain friction angle ϕps, are given in Tables 5 and 6, respectively.
The linear fits
| Linear fit | Pearson's coefficient r | |
|---|---|---|
| Drucker–Prager |
| rD-P = 0.94 |
| Lade–Duncan |
| rL-D = 0.96 |
| Matsuoka–Nakai |
| rM-N = 0.96 |
The linear fits κexp(ϕps)and the corresponding statistics Pearson's correlation coefficients.
| Linear fit | Pearson's coefficient r | |
|---|---|---|
| Drucker–Prager |
| rD-P = 0.970 |
| Lade–Duncan |
| rL-D = 0.993 |
| Matsuoka–Nakai |
| rM-N = 0.997 |
Values of Pearson's correlation coefficient r in Tables 5 and 6 lay between 0.970 and 0.997, which proves very good linear fit in each case. The Statistica software was used to determine the fits by the least-squares method.
To estimate more quantitatively the difference between the two approaches of determining the failure criteria parameters, two statistical measures are employed:vκ and vσ2.
vκ is a measure of the average relative difference between κflow rule = κ(σ1, σ3) = κ(ϕps)and κexp (Table 4) and is given by the formula (30):
Similarly, vσ2 is the average relative difference between the semi-theoretically and experimentally validated σ2, and it is calculated according to the relationship (31):
Table 7 shows the summary of the calculations carried out for each of the criteria.
Average relative difference of parameters κ and intermediate principal stress σ2, determined by the two approaches: full set of principal stresses and Vikash and Prashant proposal, for Drucker–Prager, Lade–Duncan and Matsuoka–Nakai failure criteria.
| vκ | vσ2 | |
|---|---|---|
| Drucker–Prager |
|
|
| Lade–Duncan |
|
|
| Matsuoka–Nakai |
|
|
The smallest average differences are for Matsuoka–Nakai criterion
- –
A series of shear tests on Skarpa sand was carried out in true triaxial apparatus in plane strain conditions. Experiments covered a wide range of initial soil densities and confining pressures, with the initial relative density index
I_D^c \in \left\langle {0.465,\,0878} \right\rangle I_D^c - –
The semi-theoretical approach proposed by Vikash and Prashant (2010) is compared with the results of the calculations based on the measurements of the full set of principal stresses. Both approaches differ in the way of obtaining the value of intermediate stress σ2, which can be measured independently or calculated on the base of σ1 and σ3 measurement, assuming associative flow rule.
- –
The most important conclusion for soil testing in plane strain conditions is that using Matsuoka–Nakai failure condition, the associated flow rule takes properly into account the effect of non-zero intermediate stress σ2, without a need to measure it.
- –
Linear fits to describe the relationship between κexp and ϕps for each failure criterion have been obtained. The values of Pearson's coefficient r lay between 0.970 and 0.997, which proves a very good linear fit in each case. The best linear fit characterizes Matsuoka–Nakai criterion and rM-N = 0.993. It has been shown that relation
{\kappa ^{\exp }}\left( {I_D^c} \right) - –
The constant and relatively low value of Lode angle obtained for all the TTA tests confirms that in plane strain conditions, the influence of the intermediate stress σ2 on the soil peak behaviour is limited and does not depend significantly on the confining pressure. The trend for Lode angle is constant (θ = 12.16°) with some statistical scatter. This value is consistent with Tatsuoka et al. (1986) and Wanatowski and Chu (2007).