
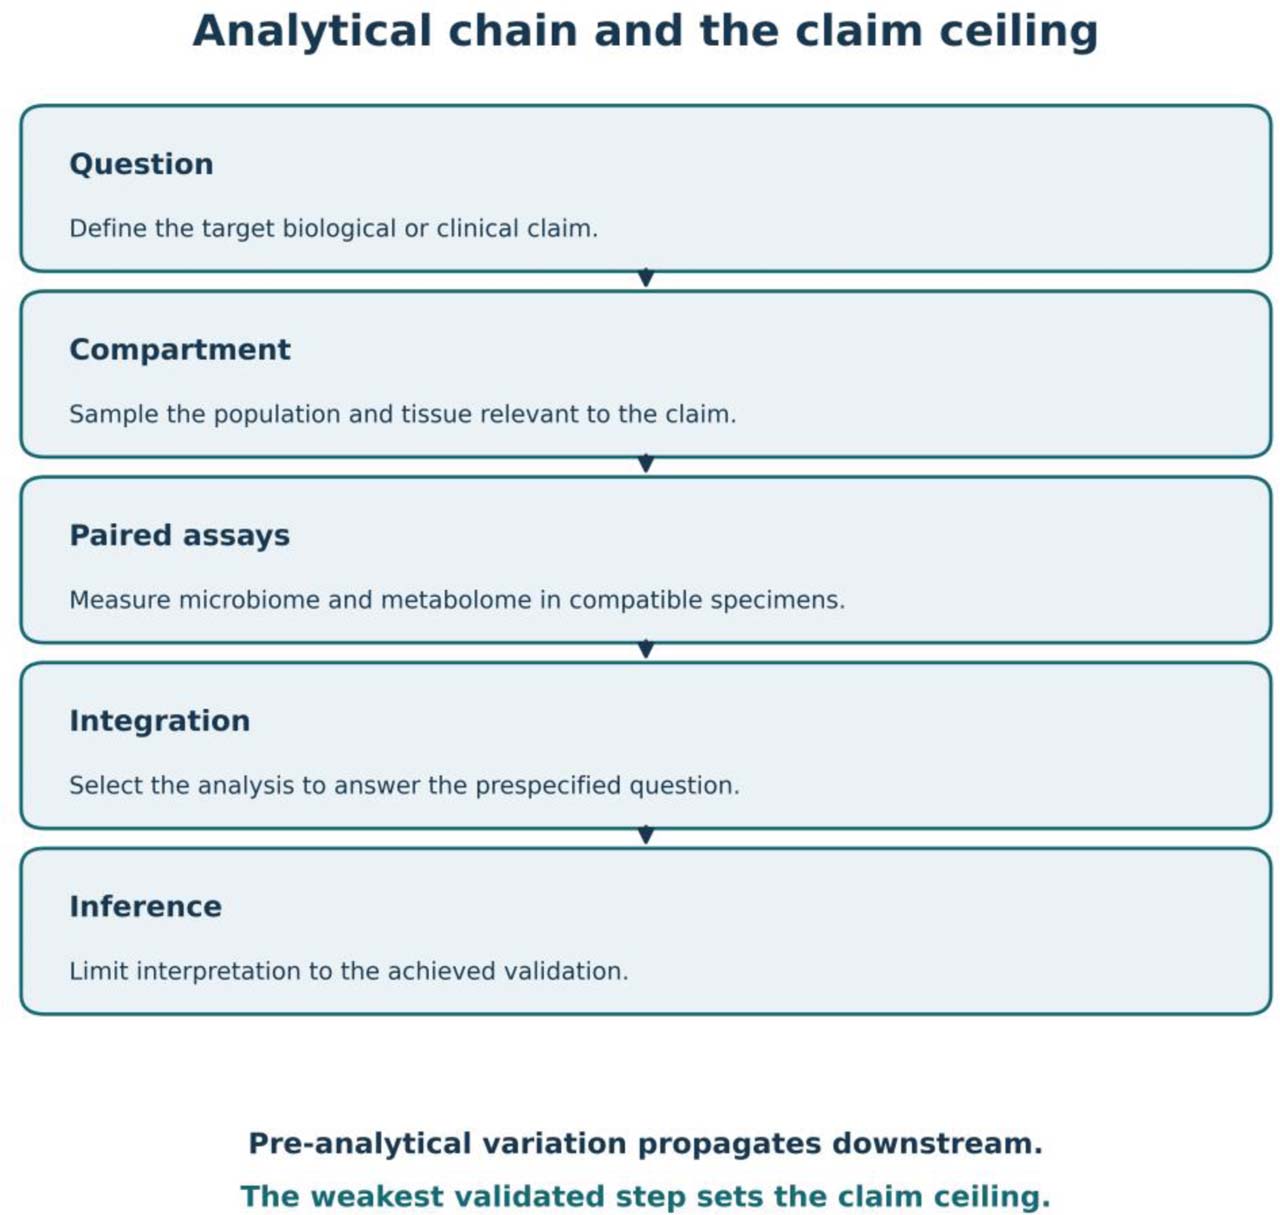
Figure 1.
From clinical question to defensible inference: the integrated microbiome–metabolome analytical chain
Figure 1. The workflow begins by defining the intended biological or clinical claim and links it to the biological compartment, analytical technologies, integration strategy and highest defensible level of inference. Pre-analytical and technical variability propagates through the workflow and cannot be fully corrected downstream; the weakest methodological component, not the most sophisticated model, sets the claim ceiling.
Prospective collection of standardized participant metadata is essential for reducing confounding and interpreting microbiome–metabolome associations. The variables listed represent a practical minimum dataset for most human studies, while additional context-specific information should be incorporated according to the study hypothesis, target population, and intended clinical or biological inference.
Table 1.
Recommended minimum metadata for human microbiome–metabolome studies
| Category | Variables to record | Why it matters |
|---|---|---|
| Demographic & anthropometric | Age, sex, body mass index | Major host determinants of microbial composition and common confounders in microbiome and metabolomics studies |
| Clinical | Relevant diagnoses, disease activity or severity | Define study populations, support stratification and adjustment for clinical confounding |
| Medication & supplements | Current medications, probiotics, dietary supplements, recent antibiotic exposure | Strong modifiers of both microbial communities and metabolite profiles |
| Diet & lifestyle | Habitual diet, alcohol consumption, smoking status, physical activity | Influence substrate availability, microbial metabolism and circulating metabolites |
| Gastrointestinal | Bowel frequency, stool consistency (Bristol Stool Form Scale), transit time or validated proxies | Affect microbial abundance estimates, fecal water content and metabolite concentrations |
| Sample collection | Date and time of collection, fasting status (if applicable), time to stabilization/freezing | Reduce pre-analytical variability and facilitate batch adjustment |
| Context-dependent | Menstrual status, renal function, liver function, geography, socioeconomic status | Important depending on the hypothesis and metabolite under investigation (e.g., renal function for trimethylamine N-oxide [TMAO]) |
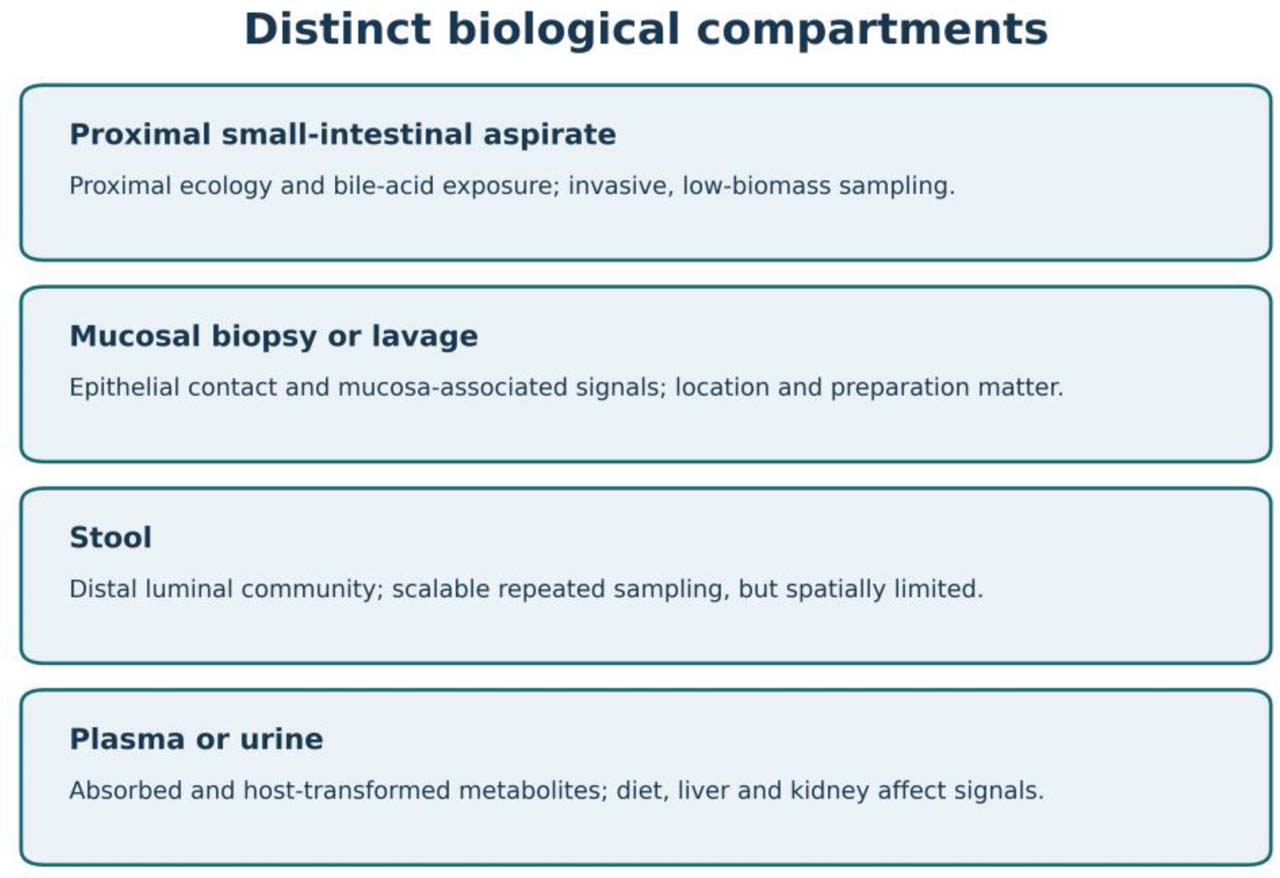
Figure 2.
Biological sampling matrices for gut microbiome–metabolome research and their interpretive scope
Figure 2. Biological compartments sampled in gut microbiome–metabolome studies and the biological information represented by each specimen. Different sampling matrices capture distinct microbial communities and metabolic environments. Consequently, specimen selection should be guided by the biological or clinical question under investigation rather than by sample accessibility alone.
Pre-analytical factors influence the quality and interpretability of both microbiome and metabolomics data before laboratory analysis begins. The table summarizes common sources of variability, their potential impact on downstream analyses, and practical measures that can improve reproducibility and reduce technical bias in integrated microbiome–metabolome studies.
The sequencing depths presented are illustrative design benchmarks derived from current methodological literature and should not be interpreted as universal thresholds. The optimal analytical approach and sequencing depth depend on the biological question, the desired taxonomic or functional resolution, sample characteristics (including host DNA content and microbial biomass), and the intended downstream analyses. Amplicon sequencing is generally appropriate for community composition studies, whereas shotgun metagenomics provides higher taxonomic resolution and direct characterization of functional potential at the expense of greater sequencing and computational requirements. Targeted quantitative PCR (qPCR) offers sensitive quantification of predefined taxa or genes but is not suitable for community-wide discovery. Researchers should therefore select the profiling strategy according to the study objective rather than sequencing depth alone.
Community-recommended confidence levels for metabolite identification and the appropriate terminology for reporting LC-MS features. Adapted from the Metabolomics Standards Initiative (MSI) and subsequent community reporting recommendations. Because untargeted LC-MS typically detects many more spectral features than confidently identified metabolites, feature count should not be interpreted as equivalent to metabolite count. Reporting the confidence level assigned to each annotation improves transparency, reproducibility and biological interpretation.
Table 2.
Major sources of pre-analytical variation and mitigation
| Pre-analytical factor | Primary analytical layer affected | Consequence if uncontrolled | Recommended mitigation |
|---|---|---|---|
| Specimen type (stool, mucosa, aspirate) | Both | Samples a different ecosystem than the one hypothesized | Match the compartment to the process being inferred |
| Homogenization and aliquoting | Both | Spatial heterogeneity inflates variability | Homogenize before aliquoting when feasible |
| Stabilization buffer | Microbiome and/or metabolome (buffer-dependent) | A DNA-optimized preservative can distort metabolites | Use separate aliquots per assay; validate the device for the intended platform |
| Freeze-thaw and storage duration | Both (metabolome sensitive) | Degradation and profile drift | Record cycles, temperature and duration; minimize thaws |
| Time to stabilization | Both | Continued microbial and enzymatic change after collection | Record and standardize the interval; freeze promptly |
| Batch assignment | Both | Technical batch becomes confounded with clinical group | Randomize across batches; never process cases and controls separately |
| Metadata completeness | Both | Residual confounding and limited biological interpretation | Collect standardized metadata prospectively according to the study hypothesis |
Table 3.
Illustrative microbiome profiling benchmarks
| Approach | Illustrative sequencing depth | Typical taxonomic/functional resolution | Major methodological considerations |
|---|---|---|---|
| 16S rRNA amplicon sequencing | Tens of thousands of quality-filtered reads | Genus; limited species-level resolution; strain-level generally not achievable | Dependent on primer choice, amplified region and reference database; functional profiles are inferred rather than measured |
| Shallow shotgun metagenomics | Approximately 2–5 million reads | Species-level profiling may be feasible for abundant organisms, depending on depth, database and community complexity | Lower technical bias than 16S in some settings; limited genome assembly and strain resolution |
| Deep shotgun metagenomics | Context-dependent; plan from host DNA, complexity and endpoint | Species, gene-family and pathway profiling; strain analysis may require greater depth | Greater cost; report usable non-host reads and coverage; no universal read-count threshold |
| Targeted qPCR | Not read-based | Absolute copies only with validated standards, assay efficiency and normalization [16]; otherwise relative estimates | Restricted to predefined targets; unsuitable for community-wide discovery |
Table 4.
Metabolite identification confidence terminology
| Confidence level | Minimum evidence required | Appropriate term |
|---|---|---|
| Level 1 - Identified metabolite | Match to an authentic reference standard using at least two orthogonal properties (e.g., accurate mass, retention time and/or MS/MS spectrum) acquired under identical analytical conditions | Identified metabolite |
| Level 2 - Putatively annotated compound | Match to a public or in-house spectral library without confirmation using an authentic standard analyzed in the same laboratory | Putatively annotated compound |
| Level 3 - Putatively characterized compound class | Spectral evidence supports assignment to a compound class, but not to a unique molecular structure | Putatively characterized compound class |
| Level 4 - Unknown feature | Reproducible spectral feature without sufficient evidence for structural annotation | Unknown feature (report m/z, retention time and, where applicable, MS/MS spectrum) |
[i] MSI, Metabolomics Standards Initiative; MS/MS, tandem mass spectrometry; LC-MS, liquid chromatography–mass spectrometry; m/z, mass-to-charge ratio. These are MSI-based reporting categories [24].
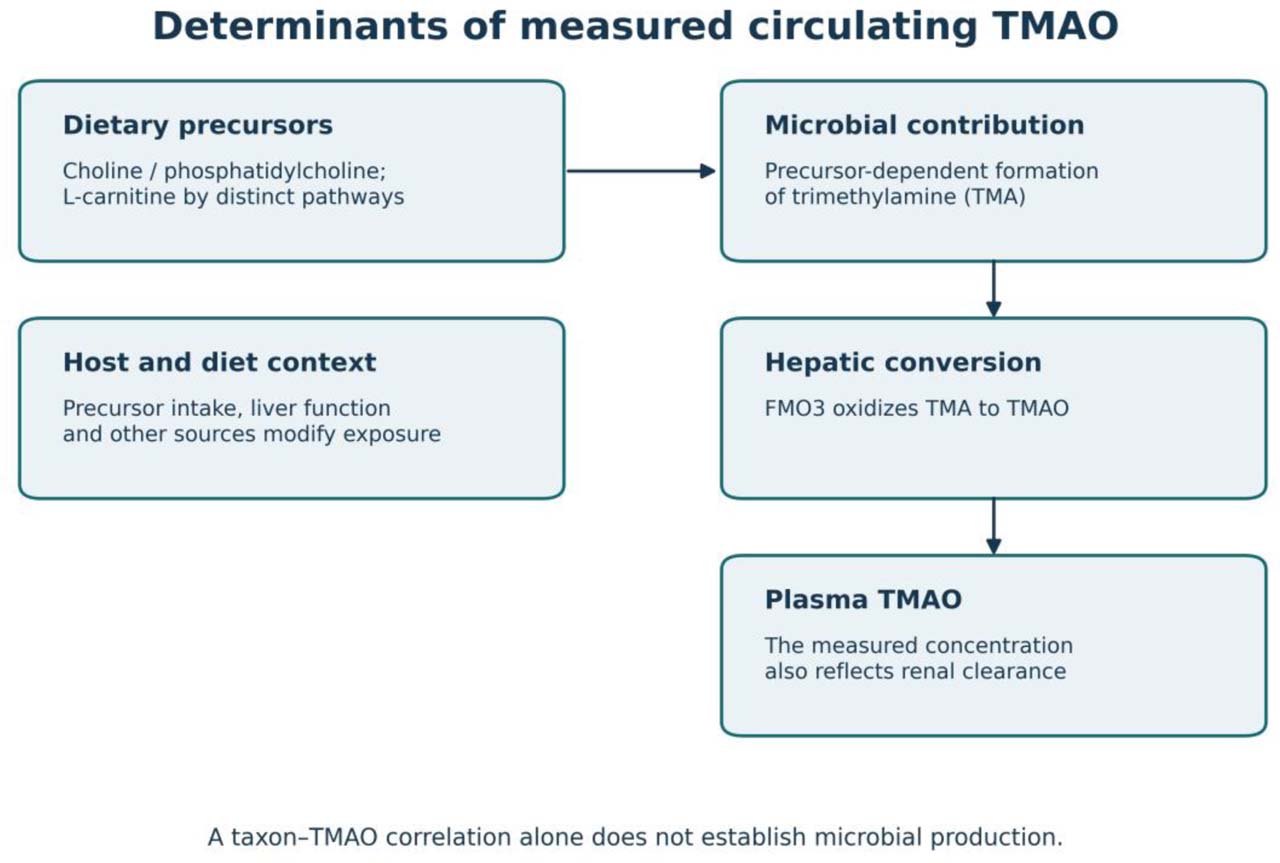
Figure 3.
Biological determinants of circulating trimethylamine N-oxide (TMAO) concentrations
Figure 3. Biological determinants of circulating trimethylamine N-oxide (TMAO) concentrations as an example of microbiome-derived metabolite interpretation. Dietary precursors (primarily choline, phosphatidylcholine and L-carnitine) are converted to trimethylamine (TMA) by gut microbial enzymes, after which TMA undergoes hepatic oxidation by flavin-containing monooxygenase 3 (FMO3) to form TMAO. The plasma TMAO concentration measured in metabolomic assays therefore reflects the combined influence of dietary precursor availability, microbial metabolic capacity, hepatic metabolism and renal clearance rather than microbial activity alone. Consequently, an observed association between a microbial taxon and circulating TMAO should not be interpreted as evidence of causal microbial production without supporting information such as microbial pathway genes, dietary exposure, metabolic intermediates and relevant host covariates.
Comparison of statistical methods commonly used for microbiome–metabolome integration. Methods differ in their primary analytical objective, whether they are supervised or unsupervised, the principal tuning parameters requiring optimization, the minimum validation strategy needed to obtain reliable results, and the main limitations affecting interpretation. Validation approaches should be implemented without information leakage, and supervised methods require complete separation between model development and performance evaluation. Network- and latent-factor methods identify statistical structure rather than causal biological mechanisms, whereas predictive methods should undergo rigorous internal and, whenever possible, external validation.
Table 5.
Integration methods, supervision, validation and limitations
| Method | Primary objective | Supervision | Main tuning parameters | Recommended validation | Principal interpretive limitation |
|---|---|---|---|---|---|
| Adjusted regression | Prespecified cross-omic association | Outcome or exposure specified | Covariates; log ratios; multiplicity | Adjusted estimates; sensitivity analysis | Compositionality, confounding and multiple testing |
| sPLS regression | Predict one omic block from another | Asymmetric / supervised by response block | Components; sparsity | Nested tuning; independent test | Feature instability and leakage |
| sPLS canonical | Symmetric cross-block covariation | No outcome supervision | Components; sparsity | Stability; permutation | Correlation does not imply direction |
| Sparse CCA | Symmetric cross-block correlation | Unsupervised | Penalties; components | Stability; permutation | Batch effects and unstable features |
| MOFA | Shared and modality-specific latent factors | Unsupervised | Factors; regularization | Factor stability; batch sensitivity | Technical factors may masquerade as biology |
| DIABLO | Classification with multi-omic signature | Supervised by class labels | Components; selected features | Nested training; locked external test | Information leakage and optimism |
| Longitudinal mixed models | Paired repeated-measures change | Time / outcome specified | Random effects; lags | Within-person replication | Time-varying confounding and misaligned sampling |
| Mediation / causal methods | Specified indirect effect or causal contrast | Exposure and outcome specified | Causal graph; sensitivity | Identification assumptions; targeted perturbation | Unmeasured confounding; compositional mediation [47] |
| Pathway-guided integration | Biologically specified pathway features | Depends on target | Annotation; gene sets | Independent pathway measurement | Pathway annotation and coverage bias |
| Clustering / stratification | Patient subgroups | Unsupervised | Distance; cluster number | Out-of-sample stability | Batch-associated and unstable subgroups |
| Incomplete-block factor models | Shared latent structure with missing assays | Unsupervised | Missingness assumptions | Held-out block and sensitivity | Nonrandom missing blocks bias factors |
| WGCNA / networks | Correlated feature modules | Usually unsupervised | Module parameters | Independent module preservation | Edges are not causal conversions |
| mmvec | Conditional microbe–metabolite co-occurrence | Unsupervised | Embedding / training | Held-out fit; experimental follow-up | Co-occurrence is not production or causal direction |
[i] sPLS, sparse partial least squares; CCA, canonical correlation analysis; MOFA, Multi-Omics Factor Analysis; DIABLO, Data Integration Analysis for Biomarker discovery using Latent cOmponents; WGCNA, weighted gene co-expression network analysis; mmvec, microbial metabolite vectors. Statistical association is not causation.
Table 6.
Comparison of microbiome and metabolomics platforms
| Platform | Primary analytical output | Major strengths | Principal limitations | Most appropriate application |
|---|---|---|---|---|
| qPCR | Quantification of predefined microbial targets | Sensitive, rapid, inexpensive, highly quantitative | Limited to predefined organisms or genes | Validation studies; targeted hypothesis testing |
| 16S rRNA gene sequencing | Community taxonomic composition | Cost-effective, scalable, standardized workflows | Limited species/strain resolution; limited functional inference | Exploratory community profiling; cohort studies |
| Shotgun metagenomics | Species, strains, genes and metabolic pathways | High taxonomic resolution; functional characterization | Greater sequencing depth, cost and computational requirements | Mechanistic studies; pathway analyses; microbiome–metabolome integration |
| Metatranscriptomics | Microbial gene expression | Reflects transcriptional activity | RNA instability; demanding sample processing; higher analytical complexity | Dynamic functional responses; active metabolic pathways |
| NMR spectroscopy | Quantitative profile of abundant metabolites | Highly reproducible; inherently quantitative; minimal sample preparation | Lower analytical sensitivity; limited metabolite coverage | Large cohorts; longitudinal validation; clinical translation |
| GC-MS | Volatile and derivatized metabolites | Excellent chromatographic resolution; mature spectral libraries | Derivatization required; restricted chemical space | SCFAs, organic acids and central carbon metabolism |
| LC-MS | Broad metabolite feature profiling | Highest sensitivity; extensive metabolite coverage; targeted and untargeted workflows | Matrix effects; signal drift; metabolite annotation challenges | Exploratory feature discovery or targeted validation panels; no method covers the full metabolome |
Table 7.
Representative studies and author-derived methodological lessons
| Study / setting | Compartments | Microbiome / metabolome layers | Integration and principal finding | Transferable methodological lesson |
|---|---|---|---|---|
| Zierer et al. [26], population cohort | Stool + host metadata | Microbiome: 16S / community profile Metabolome: Fecal metabolomics | Integration: Variance partitioning and associations Finding: Metabolite variation reflects microbial ecology but also host characteristics | Adjustment for host factors and diet is essential when interpreting microbiome–metabolome associations. |
| Franzosa et al. [4], IBD | Stool | Microbiome: Shotgun metagenome Metabolome: Untargeted metabolomics | Integration: Cross-omic association and disease models Finding: Functional metabolic alterations discriminate disease more consistently than taxonomy | Functional profiles may be more reproducible than taxonomic composition. |
| Lloyd-Price et al. [2], longitudinal IBD | Longitudinal stool, biopsy and blood from 132 participants | Microbiome: Metagenome + metatranscriptome Metabolome: Metabolomics | Integration: Longitudinal multi-layer integration Finding: Cross-omic relationships vary over time and with disease activity | Longitudinal sampling improves interpretation of dynamic microbiome–metabolome interactions. |
| McHardy et al. [13], mucosal lavage | Endoscopic cecal and sigmoid mucosal lavage | Microbiome: 16S profiling Metabolome: Mucosal metabolomics | Paired 16S profiling and mucosal mass spectrometry; mucosal microbial and metabolic features were associated | Lesson inferred: sample the compartment that matches the biological question; the study did not directly establish superiority over stool |
| Wang et al. [27] and Tang et al. [28], TMAO pathway | Plasma/urine challenge metabolites; animal perturbation | Wang: plasma metabolomic discovery plus mouse perturbations; Tang: targeted phosphatidylcholine challenge before and after antibiotics, plus cardiovascular cohort | Wang linked dietary choline metabolites with cardiovascular risk and tested microbial dependence in mice; Tang measured suppression/reappear ance of challenge- induced TMAO with antibiotics and prospective outcome association | The experimental perturbation supports microbial contribution; neither study measured the stool shotgun–plasma association implied by the previous table |
| Ning et al. [43], cross-cohort IBD | Stool across independent cohorts | Microbial and fecal metabolite profiles with cross-cohort integration | Reported cross-cohort microbiome/metabolome features associated with IBD | Lesson inferred: assess transportability across cohorts rather than treating discovery-only feature pairs as stable |
Table 8.
Evidence before clinical implementation
| Evidence domain | Minimum evidence required before clinical implementation |
|---|---|
| Intended clinical use | Is the intended use (screening, diagnosis, prognosis, monitoring or treatment selection) explicitly defined? |
| Analytical validity | Are analytical precision, limits of detection, assay failure rates, quality controls and batch effects reported? |
| Reference population | Is the reference population clearly described, including geography, demographics, diet, medication exposure and exclusion criteria? |
| Biological variability | Is within-person variability characterized and are appropriate sampling intervals defined? |
| Reproducibility | Have comparable results been demonstrated across independent laboratories, analytical platforms and study populations? |
| Algorithm transparency | Are input features, preprocessing, normalization, model locking, version control and missing-data handling documented? |
| Clinical validity | Has the model undergone independent external validation with appropriate measures of discrimination, calibration and clinical performance? |
| Incremental value | Does the test improve prediction beyond established clinical variables or existing biomarkers? |
| Clinical utility | Is there evidence that using the test improves clinical decision-making and patient outcomes while avoiding unnecessary interventions or harm? |
[i] STORMS, Strengthening the Organizing and Reporting of Microbiome Studies; TRIPOD+AI, Transparent Reporting of a multivariable prediction model for Individual Prognosis Or Diagnosis plus Artificial Intelligence; PROBAST+AI, Prediction model Risk Of Bias ASsessment Tool plus Artificial Intelligence.
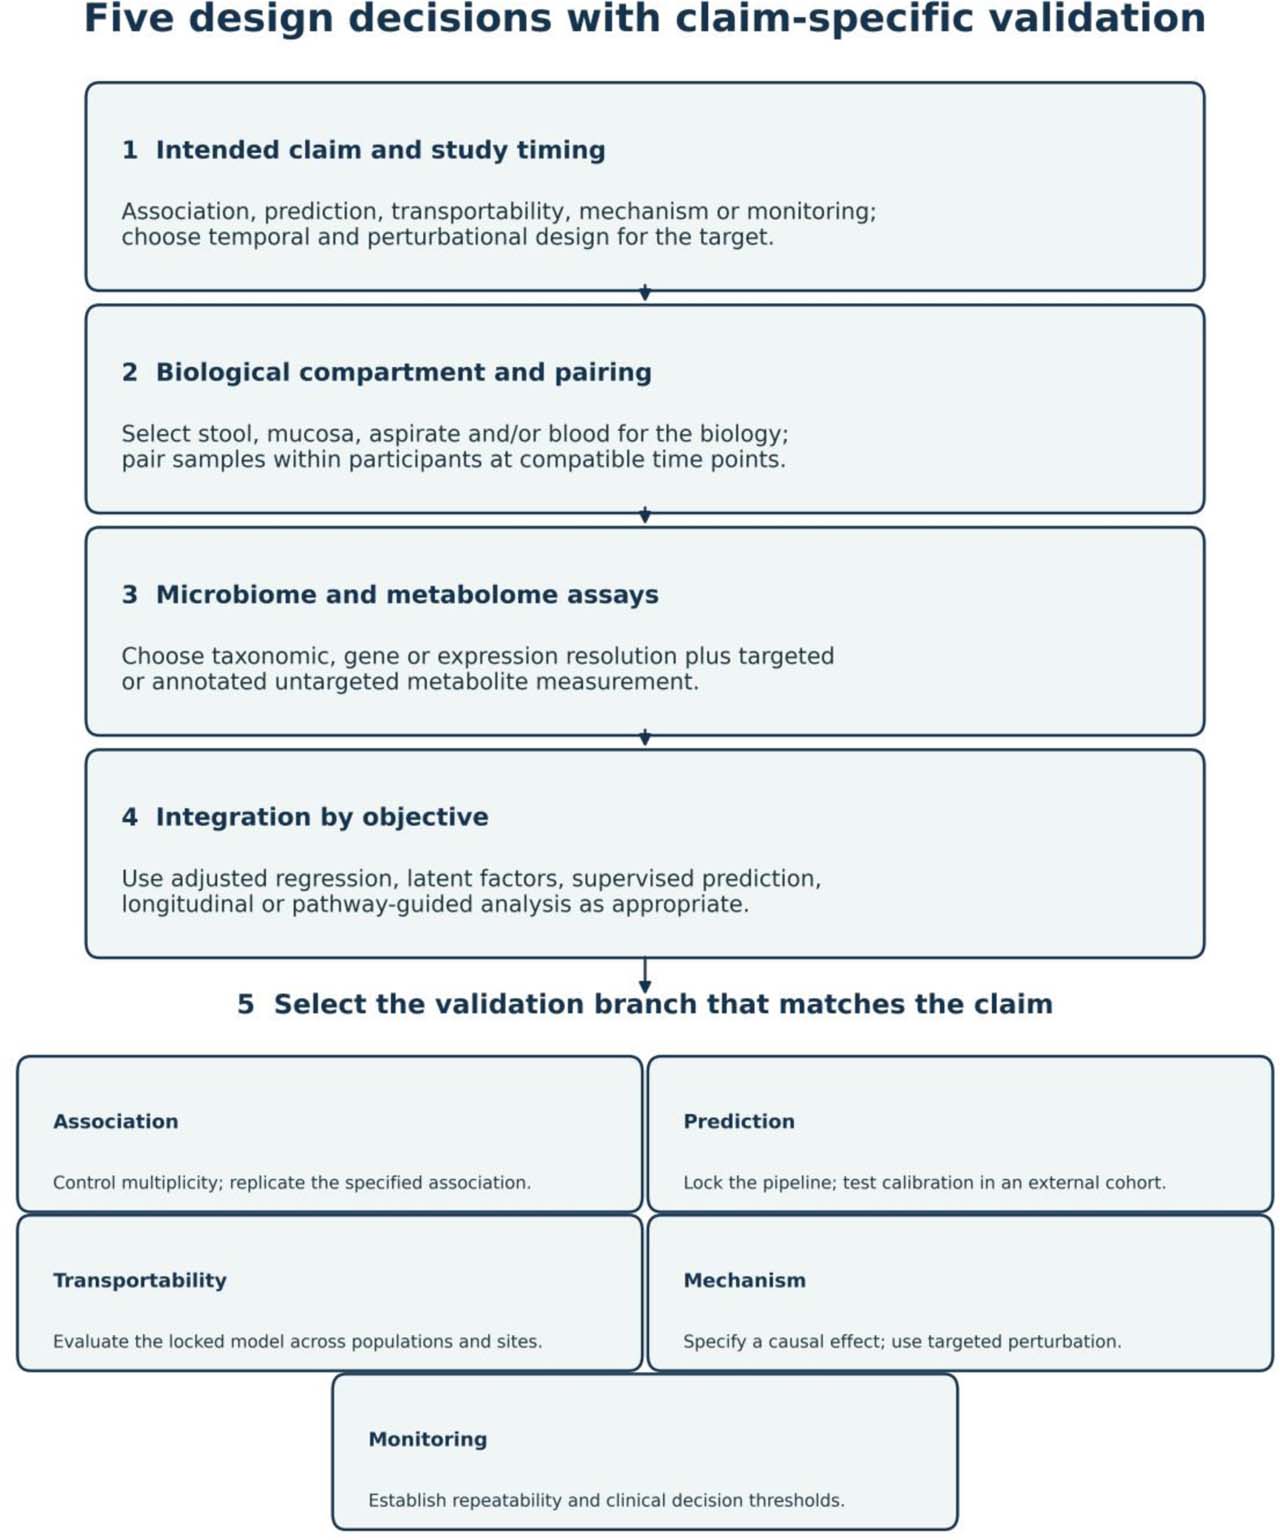
Figure 4.
Five-stage decision framework for microbiome–metabolome studies
Figure 4. Branching workflow from target claim and sampling time to paired assays, integration and claim-specific validation. mmvec provides co-occurrence evidence only. 16S, 16S ribosomal RNA; qPCR, quantitative polymerase chain reaction.
No single analytical platform is optimal for all study objectives. Platform selection should be guided by the biological question, the required analytical resolution, the biological compartment sampled and the intended downstream statistical analyses. Exploratory studies generally prioritize broad taxonomic or metabolite coverage, whereas hypothesis-driven investigations and validation studies emphasize quantitative accuracy, reproducibility and targeted measurements. Metagenomic and metabolomic platforms provide complementary information and are frequently combined in integrated multi-omics study designs.
Rather than summarizing all study characteristics, the table highlights the principal biological or analytical insight that can inform the design, interpretation and validation of future microbiome–metabolome investigations. Together, these studies demonstrate the importance of biological compartment selection, longitudinal sampling, functional profiling, adjustment for host factors and cautious interpretation of microbial associations.
Before implementation, evidence is required across analytical validity, transparent reporting, biological variability, prediction-model validation and clinical utility. The checklist synthesizes STORMS, TRIPOD, PROBAST and biomarker-development principles; it is not a regulatory standard.
Table 9.
Comparison with existing guidance and practical decisions
| Guidance / intended users | Scope and organizing principle | Methods included | Validation and causal inference |
|---|---|---|---|
| STORMS [8] / microbiome authors | Reporting checklist for human microbiome studies | Collection, laboratory, bioinformatics and statistics | Transparent reporting; does not select claim-specific causal strategy |
| Muller et al. [9] / multi-omics researchers | Question-led map of microbiome integration methods | Association, subgroups, disease shifts and mechanisms | Method-specific strengths; not a clinical prediction reporting checklist |
| TRIPOD+AI / PROBAST+AI [41, 42] / model developers and reviewers | Prediction reporting and risk-of-bias appraisal | Regression and machine-learning prediction | Development, evaluation, applicability; not mechanistic identification |
| Present framework / clinical investigators | Prospective choices from claim and timing to compartment, paired assays and integration | Targeted/untargeted omics and question-matched statistical families | Separate association, prediction, external performance, monitoring and mechanism; claim bounded by validation |
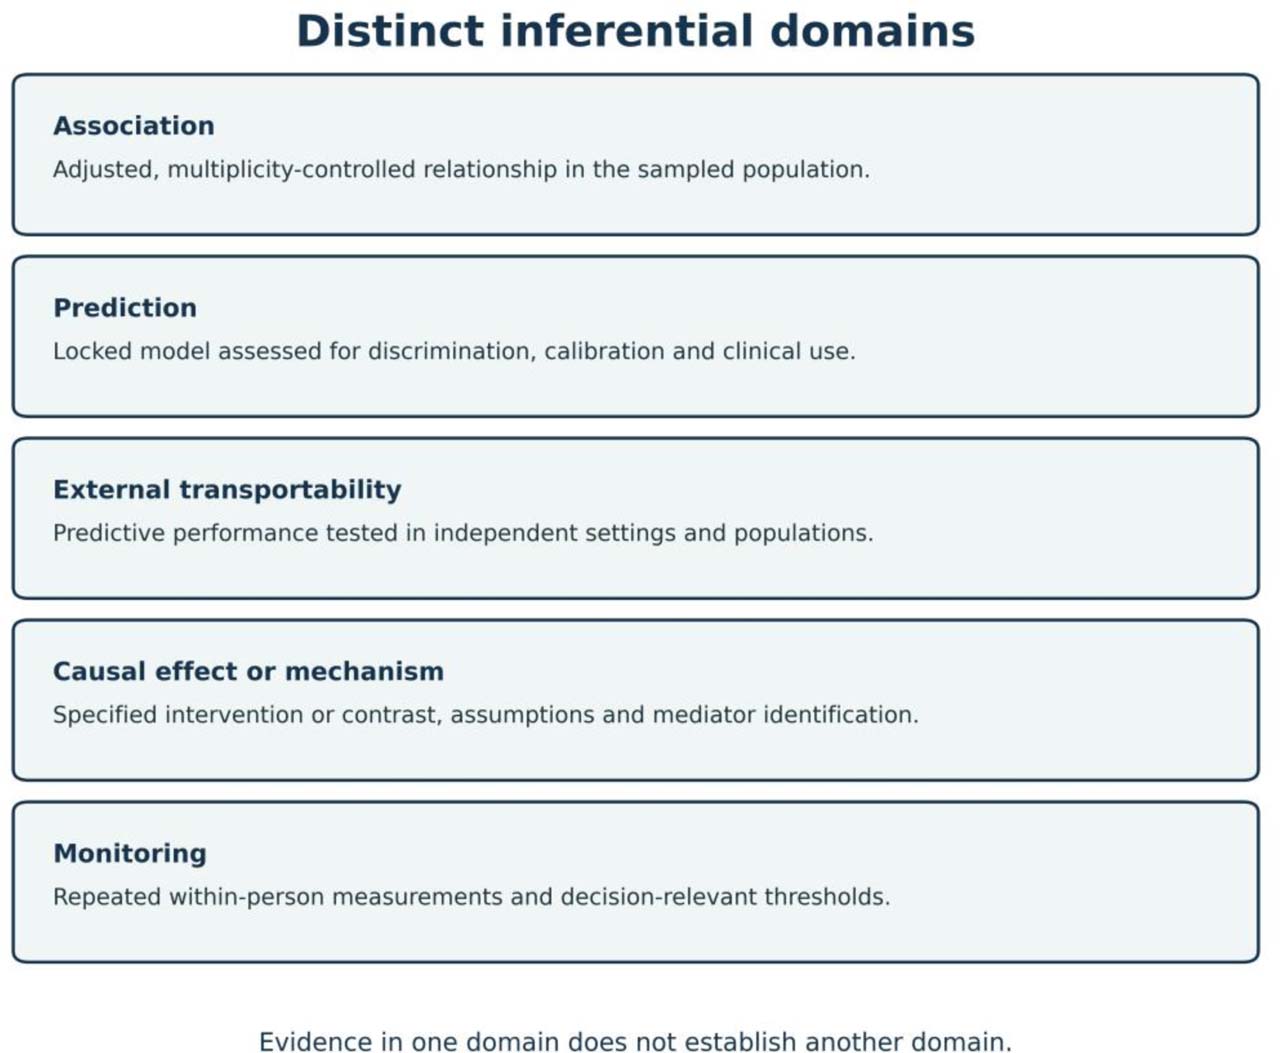
Figure 5.
Independent inferential domains in microbiome–metabolome research
Figure 5. Association, prediction, external transportability, causal effect/mechanism and monitoring are separate aims. External validation tests a locked predictive model; replication of an association does not establish a mechanism. Longitudinal observation supports temporality but not causal identification. Clinical monitoring requires within-person repeatability and a decision-relevant use case.