
What is new/what is important?
Recent reviews have begun to organize microbiome multi-omics guidance around the research question rather than around technology comparison alone [9]. This review moves beyond that general orientation by proposing an explicit, sequential decision framework that ties each methodological choice (compartment, analytical depth, integration method) to a specific, named level of inference, and makes the weakest validated step in that chain — rather than the most sophisticated analysis — the ceiling on the permissible claim. Instead of advocating a universally optimal workflow, it emphasizes that study design, analytical depth, data integration and validation should be selected according to the intended level of inference. By clearly distinguishing association from functional interpretation, prediction and causal evidence, and by illustrating the framework with two worked examples, the proposed framework provides a structured, reproducible approach for designing, interpreting and critically evaluating integrated microbiome–metabolome studies, to improve reproducibility, biomarker development and responsible clinical translation.
1. Introduction
Human gut microbiome research has shifted from taxonomic inventories toward functional models of host-microbial interaction [1]. Yet taxonomic abundance does not establish metabolic activity, gene presence does not prove expression, and a metabolite measured in stool, plasma or urine may reflect microbial metabolism, host metabolism, diet or medication [2, 3, 4]. Microbiome and metabolome data are therefore complementary layers, not interchangeable proxies [2, 3, 4].
Validity depends on the entire analytical chain. Bias introduced during recruitment, sampling, storage or batch allocation cannot be repaired by sophisticated downstream statistics [1, 5, 6]. Diet, bowel transit, medication, extraction procedures and instrument batches can equal or exceed the biological signal [5, 6]. Microbiome data are sparse and compositional, whereas metabolomics data are platform- and matrix-sensitive and often incompletely annotated [7, 8]. These properties require prospective design and transparent reporting [1, 6, 8].
Existing guidance defines best practices for microbiome studies and maps families of multi-omics integration methods [1, 8, 9]. A practical translational challenge is how choices made before data generation constrain the claim that can later be defended. This conceptual narrative review synthesizes methodological guidance, benchmarking studies and representative human investigations; it is not an exhaustive or quantitative evidence synthesis. We propose a five-stage framework (Figure 1): define the intended claim, choose the compartment, match analytical depth, select integration by purpose, and limit interpretation to the achieved validation level.
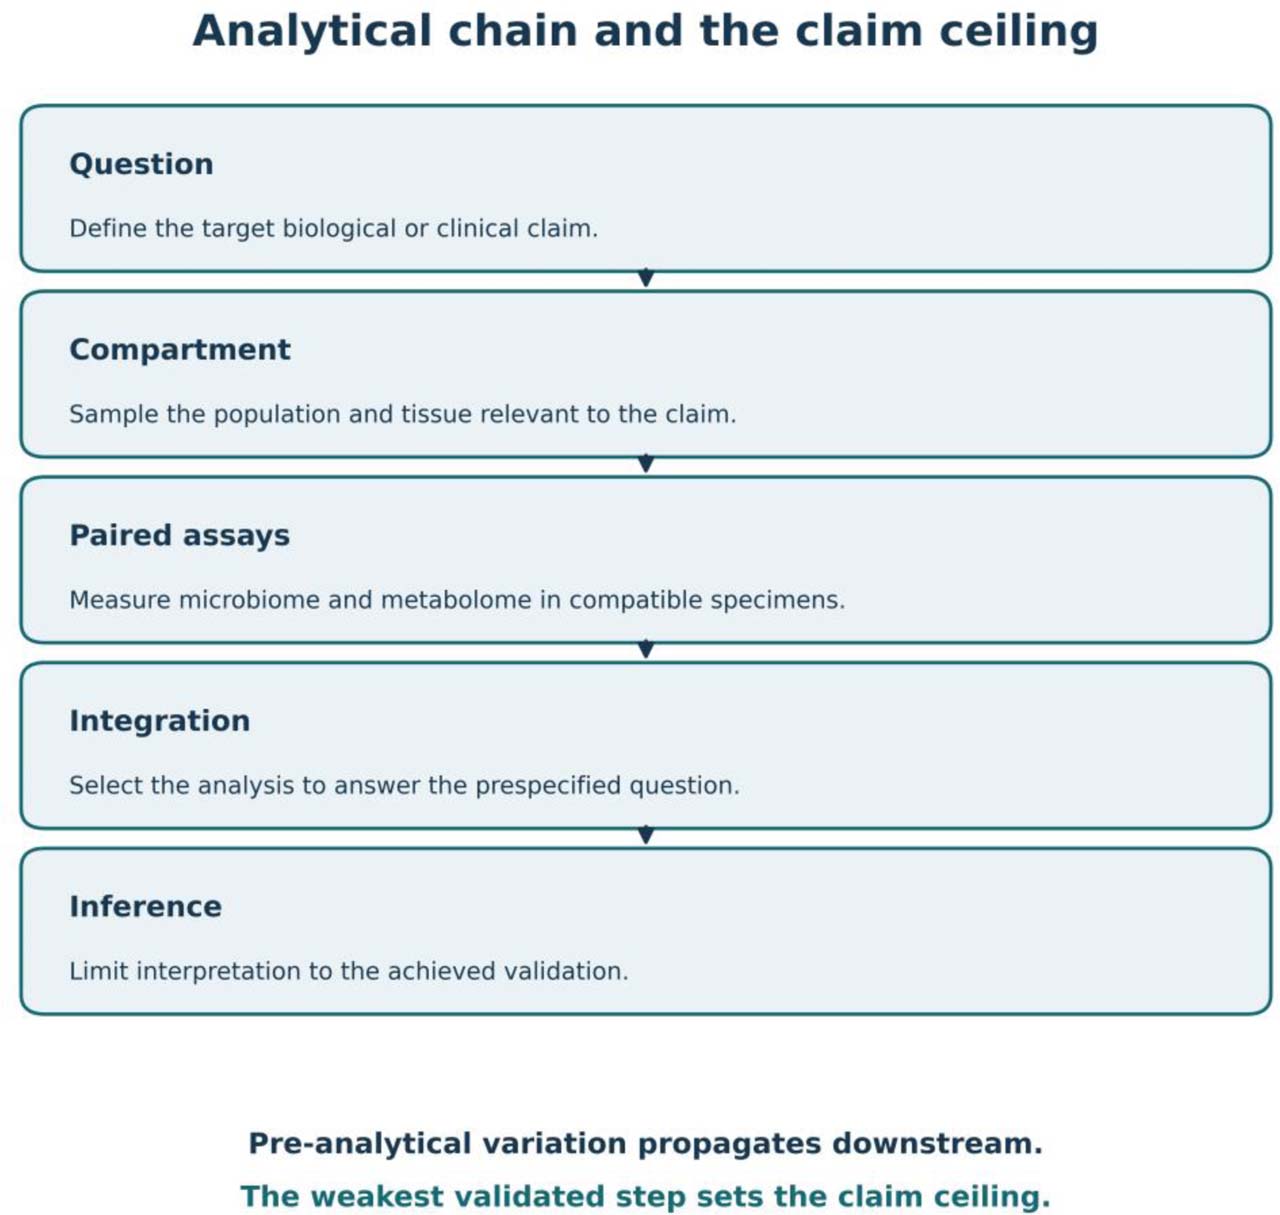
Figure 1.
From clinical question to defensible inference: the integrated microbiome–metabolome analytical chain
Figure 1. The workflow begins by defining the intended biological or clinical claim and links it to the biological compartment, analytical technologies, integration strategy and highest defensible level of inference. Pre-analytical and technical variability propagates through the workflow and cannot be fully corrected downstream; the weakest methodological component, not the most sophisticated model, sets the claim ceiling.
Prospective collection of standardized participant metadata is essential for reducing confounding and interpreting microbiome–metabolome associations. The variables listed represent a practical minimum dataset for most human studies, while additional context-specific information should be incorporated according to the study hypothesis, target population, and intended clinical or biological inference.
1.1. Review methods
This conceptual narrative review used a purposive selection of methodological guidance and representative human studies, rather than a systematic search. During revision, targeted PubMed/MEDLINE searches through 27 September 2026 used combinations of microbiome, metabolome, multi-omics integration, sampling, compositionality, prediction validation and causal inference; citation trails of selected guidance and primary studies were checked. Studies in Table 7 were chosen to illustrate differences in compartment, time, analytical layer and perturbational leverage, not to estimate pooled effects. The five-stage framework was derived by mapping recurring design choices to the specific claim each can support. No formal risk-of-bias grading, protocol, Delphi process or quantitative synthesis was performed. The search was not exhaustive, and the choice of examples is a limitation.
2. Defining the Clinical and Biological Question
A study should begin with a prespecified target question and, for an effect estimate, an estimand that defines the population, exposure or intervention contrast, outcome, time horizon and summary measure [1, 9]. Amplicon sequencing may answer questions about community structure, whereas species, gene-content or pathway questions generally require shotgun metagenomics [1, 10]. When the hypothesis concerns a defined metabolite, a validated targeted assay is usually preferable to an untargeted discovery platform.
Design should match the expected temporal dynamics. Cross-sectional studies are efficient for hypothesis generation but remain vulnerable to reverse causality and between-person heterogeneity. Longitudinal sampling separates stable person-specific features from transient variation, while prospective or intervention designs provide stronger temporal evidence when specimens precede outcomes or follow a defined perturbation [1, 8]. Longitudinal observation supports temporal ordering, but by itself does not eliminate confounding or establish a microbial mediator.
A minimum metadata set should prospectively capture age, sex, adiposity, diagnoses, medications and supplements, recent antibiotics, habitual diet, smoking and alcohol, bowel habits or transit proxies, and collection timing [1, 8]. Renal function and other context-specific variables should be added when required by the hypothesis. Table 1 summarizes a practical minimum.
Table 1.
Recommended minimum metadata for human microbiome–metabolome studies
| Category | Variables to record | Why it matters |
|---|---|---|
| Demographic & anthropometric | Age, sex, body mass index | Major host determinants of microbial composition and common confounders in microbiome and metabolomics studies |
| Clinical | Relevant diagnoses, disease activity or severity | Define study populations, support stratification and adjustment for clinical confounding |
| Medication & supplements | Current medications, probiotics, dietary supplements, recent antibiotic exposure | Strong modifiers of both microbial communities and metabolite profiles |
| Diet & lifestyle | Habitual diet, alcohol consumption, smoking status, physical activity | Influence substrate availability, microbial metabolism and circulating metabolites |
| Gastrointestinal | Bowel frequency, stool consistency (Bristol Stool Form Scale), transit time or validated proxies | Affect microbial abundance estimates, fecal water content and metabolite concentrations |
| Sample collection | Date and time of collection, fasting status (if applicable), time to stabilization/freezing | Reduce pre-analytical variability and facilitate batch adjustment |
| Context-dependent | Menstrual status, renal function, liver function, geography, socioeconomic status | Important depending on the hypothesis and metabolite under investigation (e.g., renal function for trimethylamine N-oxide [TMAO]) |
3. Pre-analytical Phase: Sampling, Transport and Biobanking
3.1. Stool collection
Stool permits non-invasive repeated sampling but primarily represents the distal luminal community [11, 12]. It does not reproduce mucosa-associated, small-intestinal or spatially localized ecosystems, so claims about unsampled regions must remain qualified [11, 13].
Mucosal biopsy is appropriate for host-microbe contact, epithelial inflammation or adherent organisms; biopsy location, low biomass, bowel preparation and host DNA require dedicated controls [13]. Aspirates can address proximal ecology but are invasive and susceptible to contamination. Compartment-specific specimens should therefore be selected for a defined question, not treated as universally superior to stool [11, 12, 13].
Participants should receive standardized instructions and collection materials. The protocol should specify whether the specimen is homogenized before aliquoting because within-stool spatial heterogeneity can affect both microbial and metabolite measurements [5, 12].
The selected compartment constrains the ecosystem component that can be interrogated and the downstream interpretation (Figure 2).
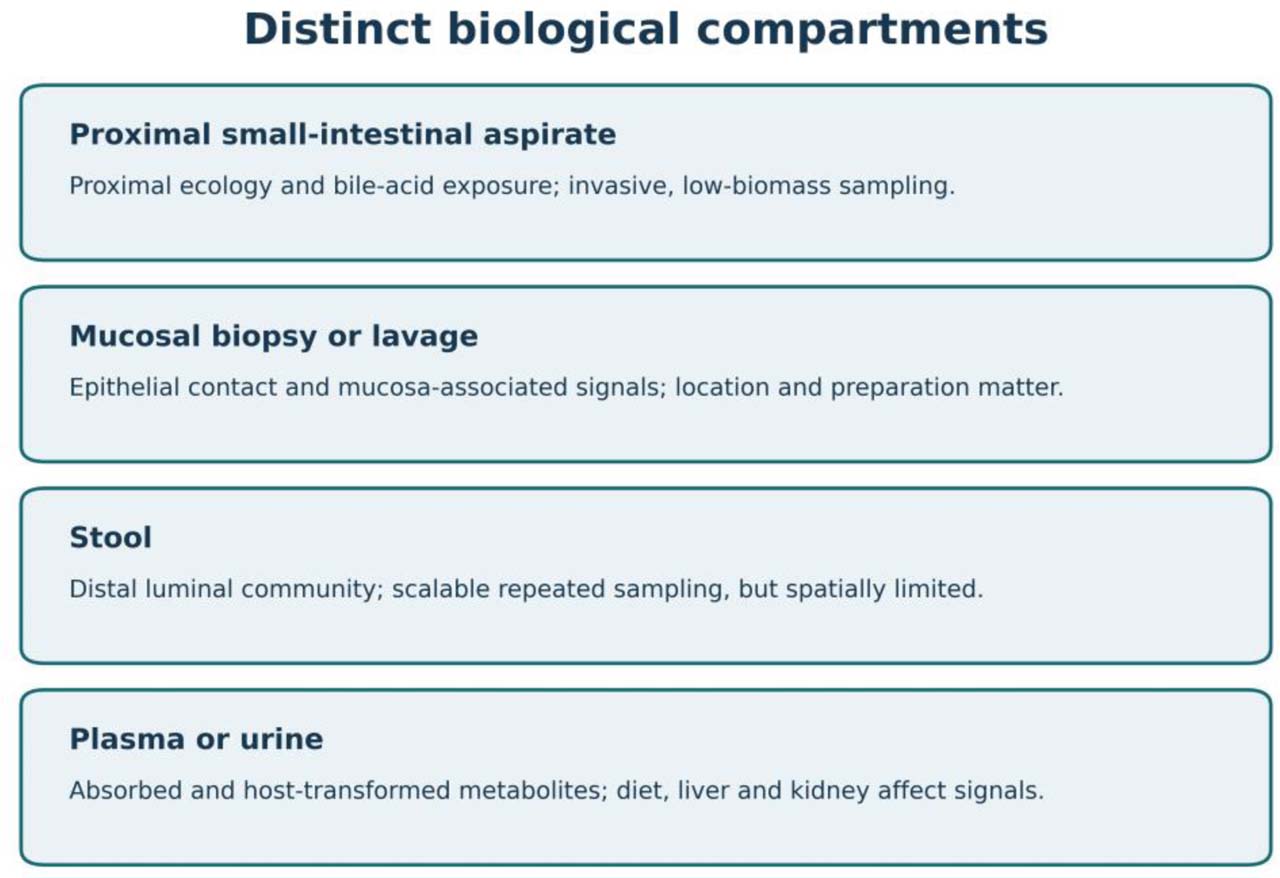
Figure 2.
Biological sampling matrices for gut microbiome–metabolome research and their interpretive scope
Figure 2. Biological compartments sampled in gut microbiome–metabolome studies and the biological information represented by each specimen. Different sampling matrices capture distinct microbial communities and metabolic environments. Consequently, specimen selection should be guided by the biological or clinical question under investigation rather than by sample accessibility alone.
Pre-analytical factors influence the quality and interpretability of both microbiome and metabolomics data before laboratory analysis begins. The table summarizes common sources of variability, their potential impact on downstream analyses, and practical measures that can improve reproducibility and reduce technical bias in integrated microbiome–metabolome studies.
The sequencing depths presented are illustrative design benchmarks derived from current methodological literature and should not be interpreted as universal thresholds. The optimal analytical approach and sequencing depth depend on the biological question, the desired taxonomic or functional resolution, sample characteristics (including host DNA content and microbial biomass), and the intended downstream analyses. Amplicon sequencing is generally appropriate for community composition studies, whereas shotgun metagenomics provides higher taxonomic resolution and direct characterization of functional potential at the expense of greater sequencing and computational requirements. Targeted quantitative PCR (qPCR) offers sensitive quantification of predefined taxa or genes but is not suitable for community-wide discovery. Researchers should therefore select the profiling strategy according to the study objective rather than sequencing depth alone.
Community-recommended confidence levels for metabolite identification and the appropriate terminology for reporting LC-MS features. Adapted from the Metabolomics Standards Initiative (MSI) and subsequent community reporting recommendations. Because untargeted LC-MS typically detects many more spectral features than confidently identified metabolites, feature count should not be interpreted as equivalent to metabolite count. Reporting the confidence level assigned to each annotation improves transparency, reproducibility and biological interpretation.
3.2. Stabilization and storage
Immediate freezing at −80 °C is a reference approach, but home collection may require validated stabilization or short transport intervals [5, 12]. A preservative optimized for DNA can distort metabolite profiles. Integrated studies should therefore use separate aliquots optimized for nucleic acids, metabolomics and any planned culture or host-biomarker analyses [5, 14].
Time to stabilization, temperature, storage duration and freeze-thaw cycles should be recorded. Samples should be balanced and randomized across extraction and instrument batches; processing all cases separately from controls confounds biological group with technical batch [1, 5, 6]. Table 2 summarizes major pre-analytical risks and mitigation strategies.
Table 2.
Major sources of pre-analytical variation and mitigation
| Pre-analytical factor | Primary analytical layer affected | Consequence if uncontrolled | Recommended mitigation |
|---|---|---|---|
| Specimen type (stool, mucosa, aspirate) | Both | Samples a different ecosystem than the one hypothesized | Match the compartment to the process being inferred |
| Homogenization and aliquoting | Both | Spatial heterogeneity inflates variability | Homogenize before aliquoting when feasible |
| Stabilization buffer | Microbiome and/or metabolome (buffer-dependent) | A DNA-optimized preservative can distort metabolites | Use separate aliquots per assay; validate the device for the intended platform |
| Freeze-thaw and storage duration | Both (metabolome sensitive) | Degradation and profile drift | Record cycles, temperature and duration; minimize thaws |
| Time to stabilization | Both | Continued microbial and enzymatic change after collection | Record and standardize the interval; freeze promptly |
| Batch assignment | Both | Technical batch becomes confounded with clinical group | Randomize across batches; never process cases and controls separately |
| Metadata completeness | Both | Residual confounding and limited biological interpretation | Collect standardized metadata prospectively according to the study hypothesis |
4. Microbiome Profiling Methods
4.1. Culture-based methods and quantitative PCR
Culture remains essential when viable organisms, phenotypes, antimicrobial susceptibility or experimental isolates are required, although it is selective and labour-intensive [15]. Quantitative PCR (qPCR) offers sensitive measurement of predefined taxa or genes and is valuable for focused hypotheses, low-biomass samples and validation [16]. Because it cannot characterize an unknown community, it complements rather than replaces broader sequencing.
4.2. 16S rRNA gene amplicon sequencing
16S rRNA gene amplicon sequencing is cost-effective for bacterial profiling; archaeal recovery depends on validated extraction and primer coverage, but performance depends on extraction, primers, variable region, platform and reference database [1, 6]. Species resolution is limited, strain-level inference is generally inappropriate, and marker-gene functional profiles are imputed rather than measured [17, 18]. It is best suited to community profiling when direct functional characterization is not the primary objective.
Sequencing depth should follow the endpoint. Tens of thousands of quality-filtered amplicon reads often stabilize common diversity measures; shallow shotgun sequencing can support species profiling, whereas robust gene- or pathway-level analyses may require substantially deeper sequencing [19, 20]. Fixed read thresholds are only design anchors because host DNA, community complexity and pathway rarity alter requirements.
Amplicon sequence variants improve reproducibility but do not remove upstream bias [17]. Negative controls and mock communities remain important. Absolute microbial load can complement relative abundance and distinguish true expansion from apparent change caused by depletion of other community members [21].
4.3. Shotgun metagenomics
Shotgun metagenomics can provide species or strain information, gene families, pathways, resistance genes and genome reconstruction [10]. It is well suited to integration with metabolomics, but requires greater depth, computational resources and control of human DNA and contamination. Gene content represents functional potential, not expression, protein activity or metabolic flux [2, 4, 10].
Functional annotation depends on the database and organism novelty. Reports should provide total and host-depleted reads, mapping fractions, database versions and the proportion retained at each stage [1, 8]. Table 3 presents illustrative, not prescriptive, design benchmarks.
Table 3.
Illustrative microbiome profiling benchmarks
| Approach | Illustrative sequencing depth | Typical taxonomic/functional resolution | Major methodological considerations |
|---|---|---|---|
| 16S rRNA amplicon sequencing | Tens of thousands of quality-filtered reads | Genus; limited species-level resolution; strain-level generally not achievable | Dependent on primer choice, amplified region and reference database; functional profiles are inferred rather than measured |
| Shallow shotgun metagenomics | Approximately 2–5 million reads | Species-level profiling may be feasible for abundant organisms, depending on depth, database and community complexity | Lower technical bias than 16S in some settings; limited genome assembly and strain resolution |
| Deep shotgun metagenomics | Context-dependent; plan from host DNA, complexity and endpoint | Species, gene-family and pathway profiling; strain analysis may require greater depth | Greater cost; report usable non-host reads and coverage; no universal read-count threshold |
| Targeted qPCR | Not read-based | Absolute copies only with validated standards, assay efficiency and normalization [16]; otherwise relative estimates | Restricted to predefined targets; unsuitable for community-wide discovery |
4.4. Metatranscriptomics and complementary functional assays
Metatranscriptomics moves closer to active gene expression but is affected by RNA instability, extraction and ribosomal-depletion variability; transcript abundance still does not establish protein activity [2, 4]. In many clinical cohorts, metagenomics combined with targeted metabolite measurement is the more feasible functional extension.
5. Metabolomic Platforms
5.1. Targeted and untargeted strategies
Targeted metabolomics quantifies predefined compounds using standards, calibration and isotope-labelled internal standards when available; it is therefore appropriate for hypothesis testing [22]. Untargeted workflows support discovery but are frequently semi-quantitative and incompletely annotated. A spectral feature should not be called an identified metabolite unless identification criteria are met [22].
5.2. Nuclear magnetic resonance spectroscopy
Nuclear magnetic resonance spectroscopy is reproducible, minimally destructive and quantitative for many abundant metabolites, but less sensitive than mass spectrometry [22]. It is attractive for large cohorts and longitudinal validation when the targets fall within its sensitivity range.
5.3. Gas chromatography-mass spectrometry
Gas chromatography-mass spectrometry provides strong separation and mature libraries for volatile or derivatized compounds, including short-chain fatty acids and organic acids [22, 23]. Derivatization and volatility requirements limit chemical coverage and increase sensitivity to sample handling.
5.4. Liquid chromatography-mass spectrometry
Liquid chromatography-mass spectrometry offers high sensitivity and broad chemical coverage, but no single chromatographic and ionization method captures the entire metabolome [22]. Matrix effects, adducts, fragmentation and drift require blanks, internal standards, pooled quality-control samples, randomized injection order and pre-specified filtering [22, 23, 24]. Thousands of detected features must not be equated with thousands of identified metabolites. Table 4 summarizes Metabolomics Standards Initiative (MSI) annotation terminology [24].
Table 4.
Metabolite identification confidence terminology
| Confidence level | Minimum evidence required | Appropriate term |
|---|---|---|
| Level 1 - Identified metabolite | Match to an authentic reference standard using at least two orthogonal properties (e.g., accurate mass, retention time and/or MS/MS spectrum) acquired under identical analytical conditions | Identified metabolite |
| Level 2 - Putatively annotated compound | Match to a public or in-house spectral library without confirmation using an authentic standard analyzed in the same laboratory | Putatively annotated compound |
| Level 3 - Putatively characterized compound class | Spectral evidence supports assignment to a compound class, but not to a unique molecular structure | Putatively characterized compound class |
| Level 4 - Unknown feature | Reproducible spectral feature without sufficient evidence for structural annotation | Unknown feature (report m/z, retention time and, where applicable, MS/MS spectrum) |
[i] MSI, Metabolomics Standards Initiative; MS/MS, tandem mass spectrometry; LC-MS, liquid chromatography–mass spectrometry; m/z, mass-to-charge ratio. These are MSI-based reporting categories [24].
6. Metabolites at the Host-Microbial Interface
Short-chain fatty acids, bile acids, aromatic amino-acid derivatives, indoles, phenols and methylamines illustrate the host-microbial interface [25]. Fecal concentrations reflect production, absorption, transit and stool water, whereas circulating values also reflect hepatic transformation, renal clearance and host metabolism [25, 26]. Matrix selection is therefore part of the biological hypothesis. Fecal metabolite concentrations should be reported with water-content or dry-mass normalization when the analytical question requires between-sample comparison.
Trimethylamine N-oxide (TMAO) illustrates this distinction. Microbial enzymes convert dietary precursors to trimethylamine, which is oxidized by hepatic flavin-containing monooxygenases [27, 28]. Plasma TMAO also depends on diet and renal function [25, 27, 28]; a taxon-TMAO association alone cannot establish causal production. Interpretation is stronger when pathway genes, precursor exposure, intermediates and host covariates are integrated (Figure 3).
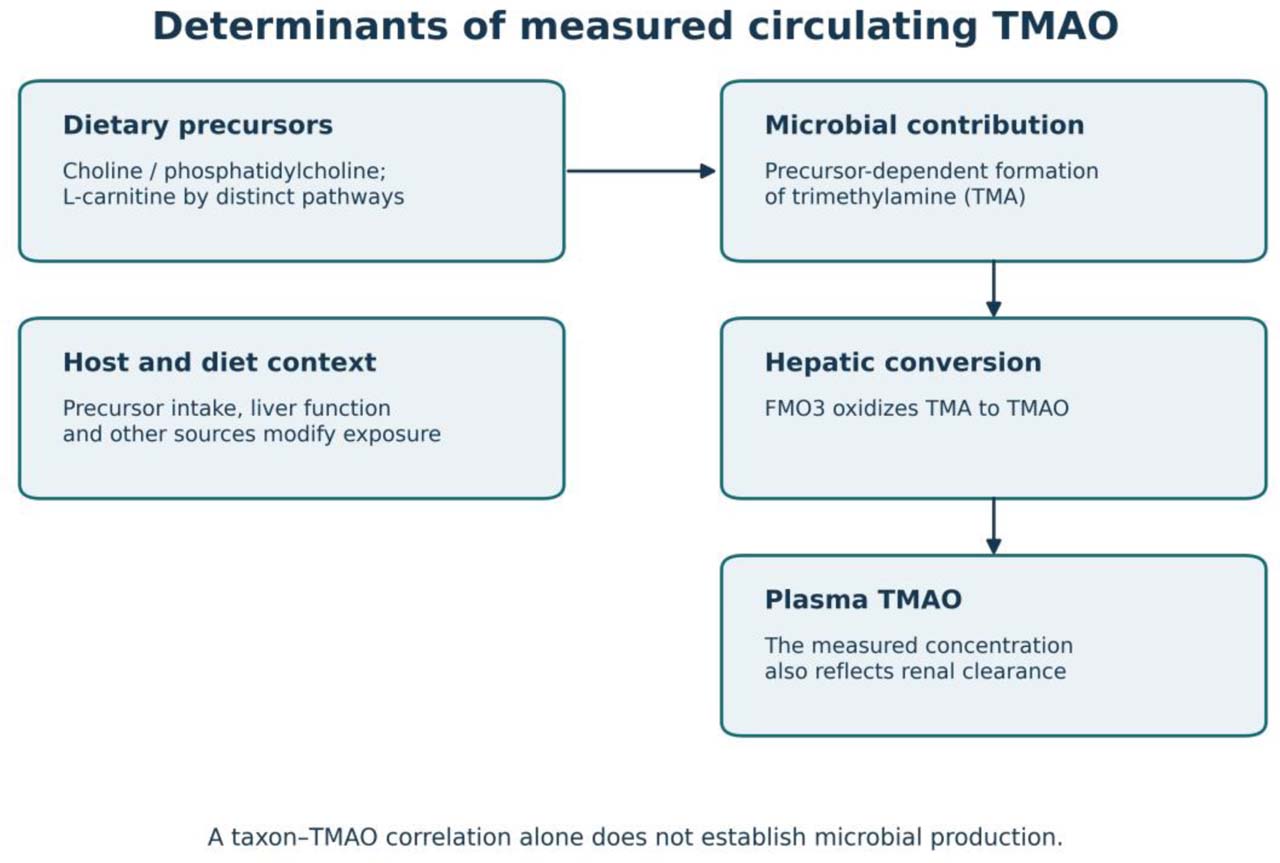
Figure 3.
Biological determinants of circulating trimethylamine N-oxide (TMAO) concentrations
Figure 3. Biological determinants of circulating trimethylamine N-oxide (TMAO) concentrations as an example of microbiome-derived metabolite interpretation. Dietary precursors (primarily choline, phosphatidylcholine and L-carnitine) are converted to trimethylamine (TMA) by gut microbial enzymes, after which TMA undergoes hepatic oxidation by flavin-containing monooxygenase 3 (FMO3) to form TMAO. The plasma TMAO concentration measured in metabolomic assays therefore reflects the combined influence of dietary precursor availability, microbial metabolic capacity, hepatic metabolism and renal clearance rather than microbial activity alone. Consequently, an observed association between a microbial taxon and circulating TMAO should not be interpreted as evidence of causal microbial production without supporting information such as microbial pathway genes, dietary exposure, metabolic intermediates and relevant host covariates.
Comparison of statistical methods commonly used for microbiome–metabolome integration. Methods differ in their primary analytical objective, whether they are supervised or unsupervised, the principal tuning parameters requiring optimization, the minimum validation strategy needed to obtain reliable results, and the main limitations affecting interpretation. Validation approaches should be implemented without information leakage, and supervised methods require complete separation between model development and performance evaluation. Network- and latent-factor methods identify statistical structure rather than causal biological mechanisms, whereas predictive methods should undergo rigorous internal and, whenever possible, external validation.
7. Bioinformatics and Statistical Analysis
7.1. Microbiome-specific properties
Microbiome abundance tables are high-dimensional, sparse and compositional [7]. Analyses of raw proportions can generate denominator-driven associations. Filtering, normalization and differential-abundance methods should be justified and examined in sensitivity analyses because different methods can yield materially different results [19, 29]. Alpha and beta diversity are descriptive summaries, not universal markers of health.
If 200 microbial features are tested against 500 metabolites, 100,000 pairwise comparisons result before subgroup analyses. Report effect sizes and uncertainty, control the false-discovery rate or use an appropriate permutation strategy, and distinguish prespecified contrasts from discovery screens [30]. Dimensionality reduction and latent-variable approaches limit the number of independent hypotheses but require stable feature selection and leakage-free validation [31, 32].
7.2. Metabolomics preprocessing
Metabolomics preprocessing includes peak detection, alignment, deconvolution, blank subtraction, missing-value handling, normalization, batch correction and transformation [22, 23]. Missing values may represent concentrations below detection, ionization failure or biological absence; automatic replacement with a fixed fraction of the minimum is not generally defensible. Quality-control filtering and all imputation rules should be pre-specified and reported [22, 33].
8. Integrating Microbiome and Metabolome Data
8.1. Pairwise and regression-based integration
Pre-specified regression is the most transparent option for a limited set of biologically supported pathways and metabolites. It yields interpretable adjusted estimates but remains vulnerable to residual confounding, collinearity and multiple testing [30]. Microbial predictors require log-ratio transformations or methods developed for compositional data; otherwise, apparent associations may reflect the shared denominator [7, 34].
8.2. Latent-component and factor models
Sparse partial least squares (sPLS) in canonical mode constructs components that maximize cross-block covariance while selecting features [31, 35]. Component number and sparsity must be tuned within repeated or nested cross-validation rather than on the full dataset [31, 32]. Regularized canonical-correlation methods can explore global cross-block correlations, whereas sPLS can be useful when interpretable joint feature selection is required.
MOFA is unsupervised and separates shared from modality-specific latent variation [36]. DIABLO is supervised and identifies correlated cross-omic features that discriminate predefined groups [37]. MOFA should be evaluated by factor stability and explained structure, while DIABLO requires strict protection against information leakage and independent predictive assessment.
8.3. Networks and microbiome-specific co-occurrence models
WGCNA and related networks reduce complexity by organizing correlated features into modules, but edges are statistical dependencies rather than biochemical conversions [38]. mmvec estimates conditional microbe-metabolite co-occurrence and generates candidates for validation; it does not establish biosynthetic direction or host versus microbial origin [39]. Table 5 compares the principal integration approaches.
Table 5.
Integration methods, supervision, validation and limitations
| Method | Primary objective | Supervision | Main tuning parameters | Recommended validation | Principal interpretive limitation |
|---|---|---|---|---|---|
| Adjusted regression | Prespecified cross-omic association | Outcome or exposure specified | Covariates; log ratios; multiplicity | Adjusted estimates; sensitivity analysis | Compositionality, confounding and multiple testing |
| sPLS regression | Predict one omic block from another | Asymmetric / supervised by response block | Components; sparsity | Nested tuning; independent test | Feature instability and leakage |
| sPLS canonical | Symmetric cross-block covariation | No outcome supervision | Components; sparsity | Stability; permutation | Correlation does not imply direction |
| Sparse CCA | Symmetric cross-block correlation | Unsupervised | Penalties; components | Stability; permutation | Batch effects and unstable features |
| MOFA | Shared and modality-specific latent factors | Unsupervised | Factors; regularization | Factor stability; batch sensitivity | Technical factors may masquerade as biology |
| DIABLO | Classification with multi-omic signature | Supervised by class labels | Components; selected features | Nested training; locked external test | Information leakage and optimism |
| Longitudinal mixed models | Paired repeated-measures change | Time / outcome specified | Random effects; lags | Within-person replication | Time-varying confounding and misaligned sampling |
| Mediation / causal methods | Specified indirect effect or causal contrast | Exposure and outcome specified | Causal graph; sensitivity | Identification assumptions; targeted perturbation | Unmeasured confounding; compositional mediation [47] |
| Pathway-guided integration | Biologically specified pathway features | Depends on target | Annotation; gene sets | Independent pathway measurement | Pathway annotation and coverage bias |
| Clustering / stratification | Patient subgroups | Unsupervised | Distance; cluster number | Out-of-sample stability | Batch-associated and unstable subgroups |
| Incomplete-block factor models | Shared latent structure with missing assays | Unsupervised | Missingness assumptions | Held-out block and sensitivity | Nonrandom missing blocks bias factors |
| WGCNA / networks | Correlated feature modules | Usually unsupervised | Module parameters | Independent module preservation | Edges are not causal conversions |
| mmvec | Conditional microbe–metabolite co-occurrence | Unsupervised | Embedding / training | Held-out fit; experimental follow-up | Co-occurrence is not production or causal direction |
[i] sPLS, sparse partial least squares; CCA, canonical correlation analysis; MOFA, Multi-Omics Factor Analysis; DIABLO, Data Integration Analysis for Biomarker discovery using Latent cOmponents; WGCNA, weighted gene co-expression network analysis; mmvec, microbial metabolite vectors. Statistical association is not causation.
8.4. Sample size, tuning and validation
For binary or time-to-event prediction, anticipated outcome events, predictor parameters and overfitting must inform sample size [40]. No universal sample-size rule exists for multi-omics integration because effective complexity depends on sparsity, outcome prevalence, correlation, feature filtering and the validation plan [40]. Simulation or resampling based on plausible effects is preferable to simple participant-per-variable rules.
Separate model development from evaluation. Within training data, repeat imputation, filtering, transformation, feature selection and tuning at each resampling step; use nested validation when tuning models [32]. After locking the full pipeline, evaluate it in an independent sample without feature reselection or retuning. Report discrimination, calibration, uncertainty, incremental value beyond standard clinical predictors and decision-relevant clinical utility under TRIPOD+AI and PROBAST+AI [41, 42]. External validation in distinct populations, laboratories and time periods tests transportability; recalibration is model updating, not an unchanged external test.
9. Platform Selection and Transferable Lessons
Platform selection should be driven by the biological question, compartment and intended inference, not by instrument availability [1, 9, 22]. No platform simultaneously maximizes taxonomic resolution, functional depth, metabolite coverage, quantitative precision and scalability. Exploratory studies may prioritize breadth, whereas hypothesis testing and validation prioritize targeted quantification and reproducibility. Table 6 summarizes the practical trade-offs.
Table 6.
Comparison of microbiome and metabolomics platforms
| Platform | Primary analytical output | Major strengths | Principal limitations | Most appropriate application |
|---|---|---|---|---|
| qPCR | Quantification of predefined microbial targets | Sensitive, rapid, inexpensive, highly quantitative | Limited to predefined organisms or genes | Validation studies; targeted hypothesis testing |
| 16S rRNA gene sequencing | Community taxonomic composition | Cost-effective, scalable, standardized workflows | Limited species/strain resolution; limited functional inference | Exploratory community profiling; cohort studies |
| Shotgun metagenomics | Species, strains, genes and metabolic pathways | High taxonomic resolution; functional characterization | Greater sequencing depth, cost and computational requirements | Mechanistic studies; pathway analyses; microbiome–metabolome integration |
| Metatranscriptomics | Microbial gene expression | Reflects transcriptional activity | RNA instability; demanding sample processing; higher analytical complexity | Dynamic functional responses; active metabolic pathways |
| NMR spectroscopy | Quantitative profile of abundant metabolites | Highly reproducible; inherently quantitative; minimal sample preparation | Lower analytical sensitivity; limited metabolite coverage | Large cohorts; longitudinal validation; clinical translation |
| GC-MS | Volatile and derivatized metabolites | Excellent chromatographic resolution; mature spectral libraries | Derivatization required; restricted chemical space | SCFAs, organic acids and central carbon metabolism |
| LC-MS | Broad metabolite feature profiling | Highest sensitivity; extensive metabolite coverage; targeted and untargeted workflows | Matrix effects; signal drift; metabolite annotation challenges | Exploratory feature discovery or targeted validation panels; no method covers the full metabolome |
Integration must likewise follow purpose: adjusted regression for focused association testing, latent-factor models for heterogeneity, supervised methods for prediction, and probabilistic or network models for candidate cross-omic relationships [9, 30, 31, 36, 39].
9.1. Lessons from Representative Integrated Studies
Representative studies, including cross-cohort IBD integration [43], show that compartment, time and host physiology shape the interpretation of cross-omic findings (Table 7). Longitudinal IBD studies revealed dynamic functional changes, mucosal analyses characterized a distinct, sampled compartment, and population cohorts showed that fecal metabolites reflect both microbial ecology and host factors [2, 4, 13, 26]. Functional redundancy helps explain why pathway-metabolite relationships may reproduce even when the associated taxa differ [44]. Replication claims should therefore specify whether they concern exact feature pairs, pathways, latent signatures or predictive performance.
Table 7.
Representative studies and author-derived methodological lessons
| Study / setting | Compartments | Microbiome / metabolome layers | Integration and principal finding | Transferable methodological lesson |
|---|---|---|---|---|
| Zierer et al. [26], population cohort | Stool + host metadata | Microbiome: 16S / community profile Metabolome: Fecal metabolomics | Integration: Variance partitioning and associations Finding: Metabolite variation reflects microbial ecology but also host characteristics | Adjustment for host factors and diet is essential when interpreting microbiome–metabolome associations. |
| Franzosa et al. [4], IBD | Stool | Microbiome: Shotgun metagenome Metabolome: Untargeted metabolomics | Integration: Cross-omic association and disease models Finding: Functional metabolic alterations discriminate disease more consistently than taxonomy | Functional profiles may be more reproducible than taxonomic composition. |
| Lloyd-Price et al. [2], longitudinal IBD | Longitudinal stool, biopsy and blood from 132 participants | Microbiome: Metagenome + metatranscriptome Metabolome: Metabolomics | Integration: Longitudinal multi-layer integration Finding: Cross-omic relationships vary over time and with disease activity | Longitudinal sampling improves interpretation of dynamic microbiome–metabolome interactions. |
| McHardy et al. [13], mucosal lavage | Endoscopic cecal and sigmoid mucosal lavage | Microbiome: 16S profiling Metabolome: Mucosal metabolomics | Paired 16S profiling and mucosal mass spectrometry; mucosal microbial and metabolic features were associated | Lesson inferred: sample the compartment that matches the biological question; the study did not directly establish superiority over stool |
| Wang et al. [27] and Tang et al. [28], TMAO pathway | Plasma/urine challenge metabolites; animal perturbation | Wang: plasma metabolomic discovery plus mouse perturbations; Tang: targeted phosphatidylcholine challenge before and after antibiotics, plus cardiovascular cohort | Wang linked dietary choline metabolites with cardiovascular risk and tested microbial dependence in mice; Tang measured suppression/reappear ance of challenge- induced TMAO with antibiotics and prospective outcome association | The experimental perturbation supports microbial contribution; neither study measured the stool shotgun–plasma association implied by the previous table |
| Ning et al. [43], cross-cohort IBD | Stool across independent cohorts | Microbial and fecal metabolite profiles with cross-cohort integration | Reported cross-cohort microbiome/metabolome features associated with IBD | Lesson inferred: assess transportability across cohorts rather than treating discovery-only feature pairs as stable |
10. Confounding, Reproducibility and Reporting
Diet, medication, transit, age, adiposity and disease severity can influence both microbiome and metabolome, creating confounding and mediation structures [45]. A causal diagram or explicit conceptual model should precede adjustment: conditioning on a metabolite that lies on the causal pathway can obscure rather than remove an association [46]. Observational mediation of compositional microbial data requires an explicit causal contrast, assumptions about confounding and sensitivity analysis; statistical mediation alone does not identify microbial causation [47].
Quality control should include microbiome extraction and reagent blanks, mock communities or reference materials, and metabolomics pooled controls, solvent blanks and internal standards [5, 6, 23]. Batch identifiers and processing dates must remain linked to every sample. Technical replicates estimate analytical variation; longitudinal or biological replicates address different questions.
Inter-laboratory assessments show high within-centre reproducibility but substantial between-centre variation, with primers, extraction, sequencing and bioinformatics all contributing [6, 48]. Cross-laboratory proficiency testing, reference materials and complete protocol reporting are therefore necessary before clinically comparable measurements can be claimed.
Human microbiome studies should follow STORMS and report selection, sampling, laboratory methods, bioinformatics, statistics, and data and code availability [8]. Metabolomics reports should include feature tables, processing workflows and annotation confidence [22, 24]. Reproducibility requires enough detail to reconstruct the workflow, not merely the name of a commercial platform.
11. Clinical Interpretation and Commercial Testing
Clinical interpretation must remain proportional to analytical validity and clinical evidence [1, 8]. Difference from a proprietary reference population does not establish dysbiosis, disease causation or an actionable target, particularly when host and environmental determinants are incompletely controlled [45]. Commercial reports with opaque reference populations or algorithms may support exploration, but should not function as stand-alone diagnoses or treatment directives [8].
A clinically useful biomarker requires analytical validity, reproducibility, association with a meaningful endpoint, incremental value beyond established predictors and evidence of clinical utility [41, 42, 49]. Integrated microbiome–metabolome signatures are promising, but require independent validation across populations, laboratories and platforms before clinical implementation [49, 50].
A clinically applicable test should report collection and stability limits, precision, failure rates, identification methods, reference population and within-person variability [1, 8]. Predictive algorithms should be locked and versioned before external validation in the intended-use population, with assessment of discrimination, calibration and incremental performance [41, 42]. Until evidence shows improved decisions or patient outcomes, algorithm-derived dysbiosis or wellness scores remain exploratory. Table 8 summarizes the minimum evidence domains.
Table 8.
Evidence before clinical implementation
| Evidence domain | Minimum evidence required before clinical implementation |
|---|---|
| Intended clinical use | Is the intended use (screening, diagnosis, prognosis, monitoring or treatment selection) explicitly defined? |
| Analytical validity | Are analytical precision, limits of detection, assay failure rates, quality controls and batch effects reported? |
| Reference population | Is the reference population clearly described, including geography, demographics, diet, medication exposure and exclusion criteria? |
| Biological variability | Is within-person variability characterized and are appropriate sampling intervals defined? |
| Reproducibility | Have comparable results been demonstrated across independent laboratories, analytical platforms and study populations? |
| Algorithm transparency | Are input features, preprocessing, normalization, model locking, version control and missing-data handling documented? |
| Clinical validity | Has the model undergone independent external validation with appropriate measures of discrimination, calibration and clinical performance? |
| Incremental value | Does the test improve prediction beyond established clinical variables or existing biomarkers? |
| Clinical utility | Is there evidence that using the test improves clinical decision-making and patient outcomes while avoiding unnecessary interventions or harm? |
[i] STORMS, Strengthening the Organizing and Reporting of Microbiome Studies; TRIPOD+AI, Transparent Reporting of a multivariable prediction model for Individual Prognosis Or Diagnosis plus Artificial Intelligence; PROBAST+AI, Prediction model Risk Of Bias ASsessment Tool plus Artificial Intelligence.
12. The Five-Stage Decision Framework
The five stages (Figure 4) connect the intended claim and study design to paired specimen timing, appropriate assays, integration and claim-specific validation [1, 8, 9, 30]. The same participant must contribute biologically compatible compartments at time points relevant to the target question; for prediction, predictors must precede the outcome. Repeated sampling should characterize within-person variation rather than treating one specimen as a stable personal baseline. Table 9 compares this operational approach with reporting and methods guidance: its added decision is which specimen, timing, assay and validation can support a prespecified claim.
Define the intended claim and study design. State whether the objective is association, prediction, transportability, monitoring or a specified causal effect; fix the relevant collection and outcome times.
Select and pair compartments. Choose stool, mucosa, aspirate and/or systemic biofluids according to the process and align specimens within participants.
Match assays and resolution. Choose bacterial or shotgun profiling, targeted genes or expression together with targeted or annotated untargeted metabolomics.
Select integration by purpose. Use adjusted regression, longitudinal models, latent factors, supervised prediction or pathway-guided methods according to the target claim.
Validate the specific claim. Control multiplicity for association, lock and externally test prediction, assess repeatability for monitoring, and require identification assumptions and targeted perturbation for mechanism.
The weakest validated measurement or design component limits the justified conclusion. Figure 5 separates inferential domains; validation in one domain does not automatically establish another.
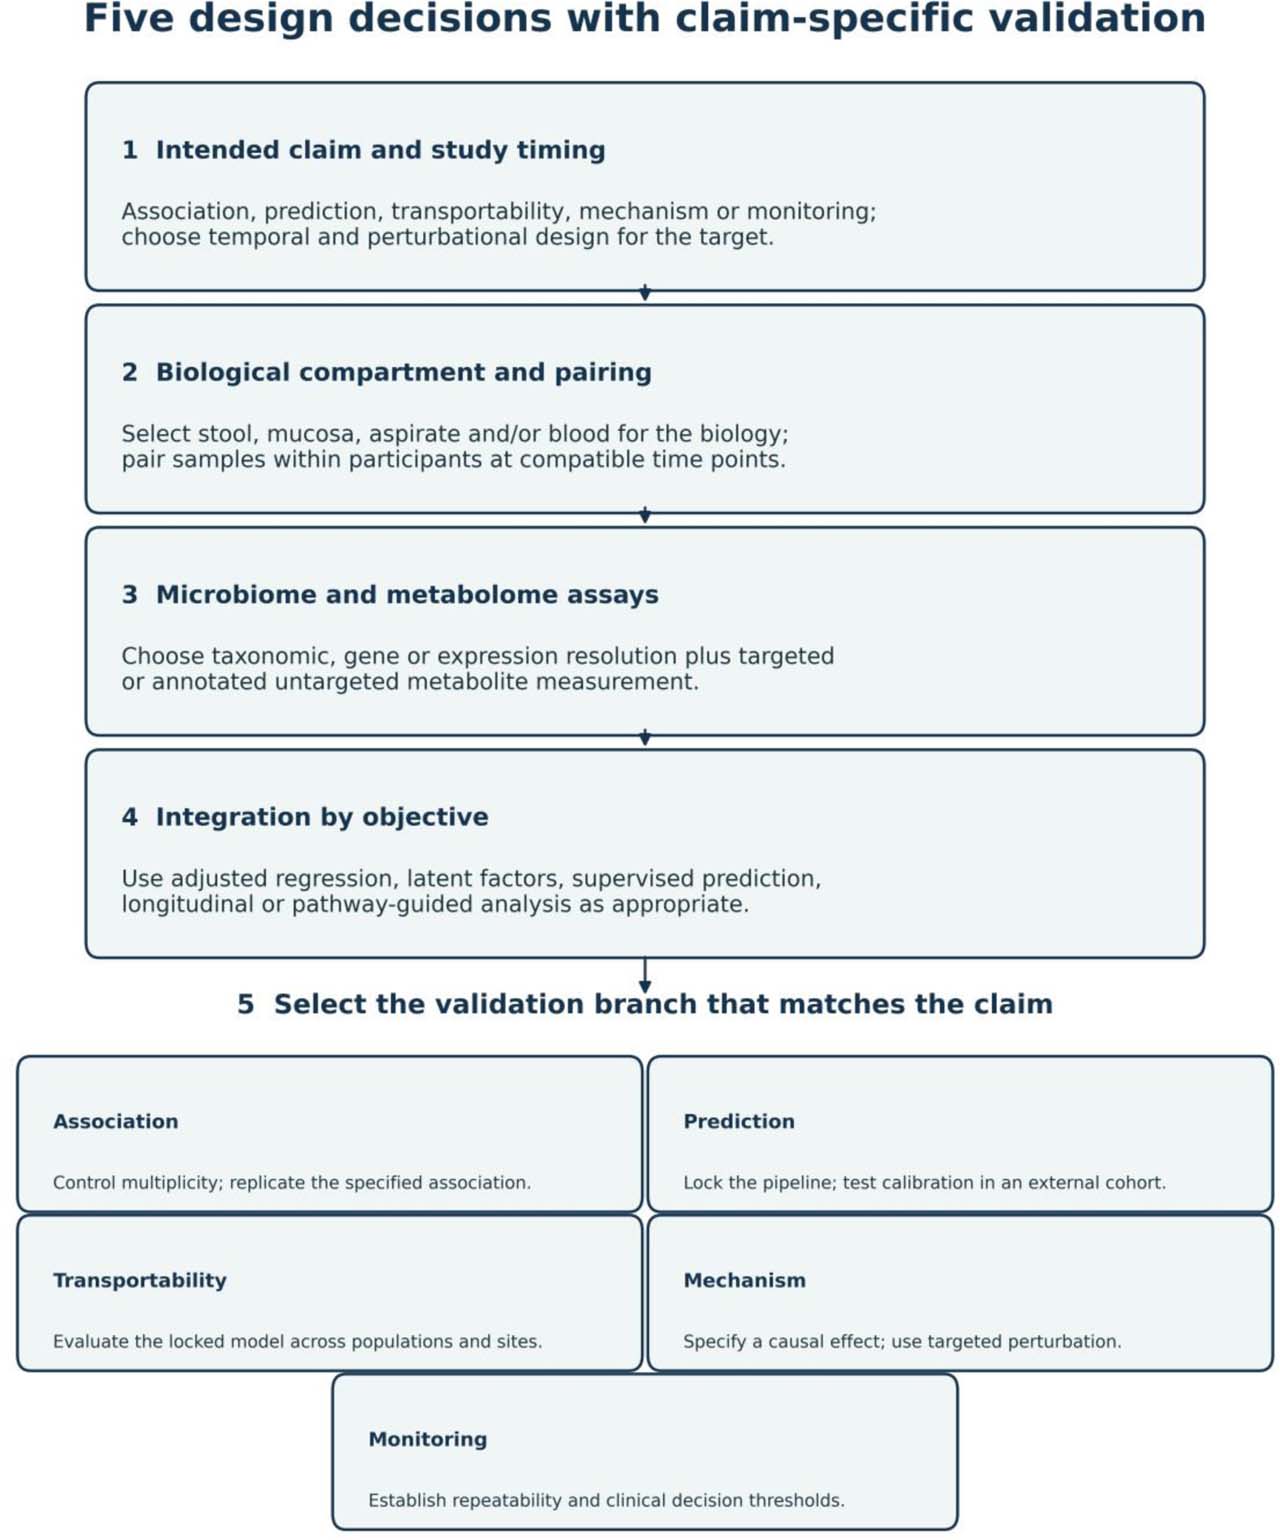
Figure 4.
Five-stage decision framework for microbiome–metabolome studies
Figure 4. Branching workflow from target claim and sampling time to paired assays, integration and claim-specific validation. mmvec provides co-occurrence evidence only. 16S, 16S ribosomal RNA; qPCR, quantitative polymerase chain reaction.
No single analytical platform is optimal for all study objectives. Platform selection should be guided by the biological question, the required analytical resolution, the biological compartment sampled and the intended downstream statistical analyses. Exploratory studies generally prioritize broad taxonomic or metabolite coverage, whereas hypothesis-driven investigations and validation studies emphasize quantitative accuracy, reproducibility and targeted measurements. Metagenomic and metabolomic platforms provide complementary information and are frequently combined in integrated multi-omics study designs.
Rather than summarizing all study characteristics, the table highlights the principal biological or analytical insight that can inform the design, interpretation and validation of future microbiome–metabolome investigations. Together, these studies demonstrate the importance of biological compartment selection, longitudinal sampling, functional profiling, adjustment for host factors and cautious interpretation of microbial associations.
Before implementation, evidence is required across analytical validity, transparent reporting, biological variability, prediction-model validation and clinical utility. The checklist synthesizes STORMS, TRIPOD, PROBAST and biomarker-development principles; it is not a regulatory standard.
Table 9.
Comparison with existing guidance and practical decisions
| Guidance / intended users | Scope and organizing principle | Methods included | Validation and causal inference |
|---|---|---|---|
| STORMS [8] / microbiome authors | Reporting checklist for human microbiome studies | Collection, laboratory, bioinformatics and statistics | Transparent reporting; does not select claim-specific causal strategy |
| Muller et al. [9] / multi-omics researchers | Question-led map of microbiome integration methods | Association, subgroups, disease shifts and mechanisms | Method-specific strengths; not a clinical prediction reporting checklist |
| TRIPOD+AI / PROBAST+AI [41, 42] / model developers and reviewers | Prediction reporting and risk-of-bias appraisal | Regression and machine-learning prediction | Development, evaluation, applicability; not mechanistic identification |
| Present framework / clinical investigators | Prospective choices from claim and timing to compartment, paired assays and integration | Targeted/untargeted omics and question-matched statistical families | Separate association, prediction, external performance, monitoring and mechanism; claim bounded by validation |
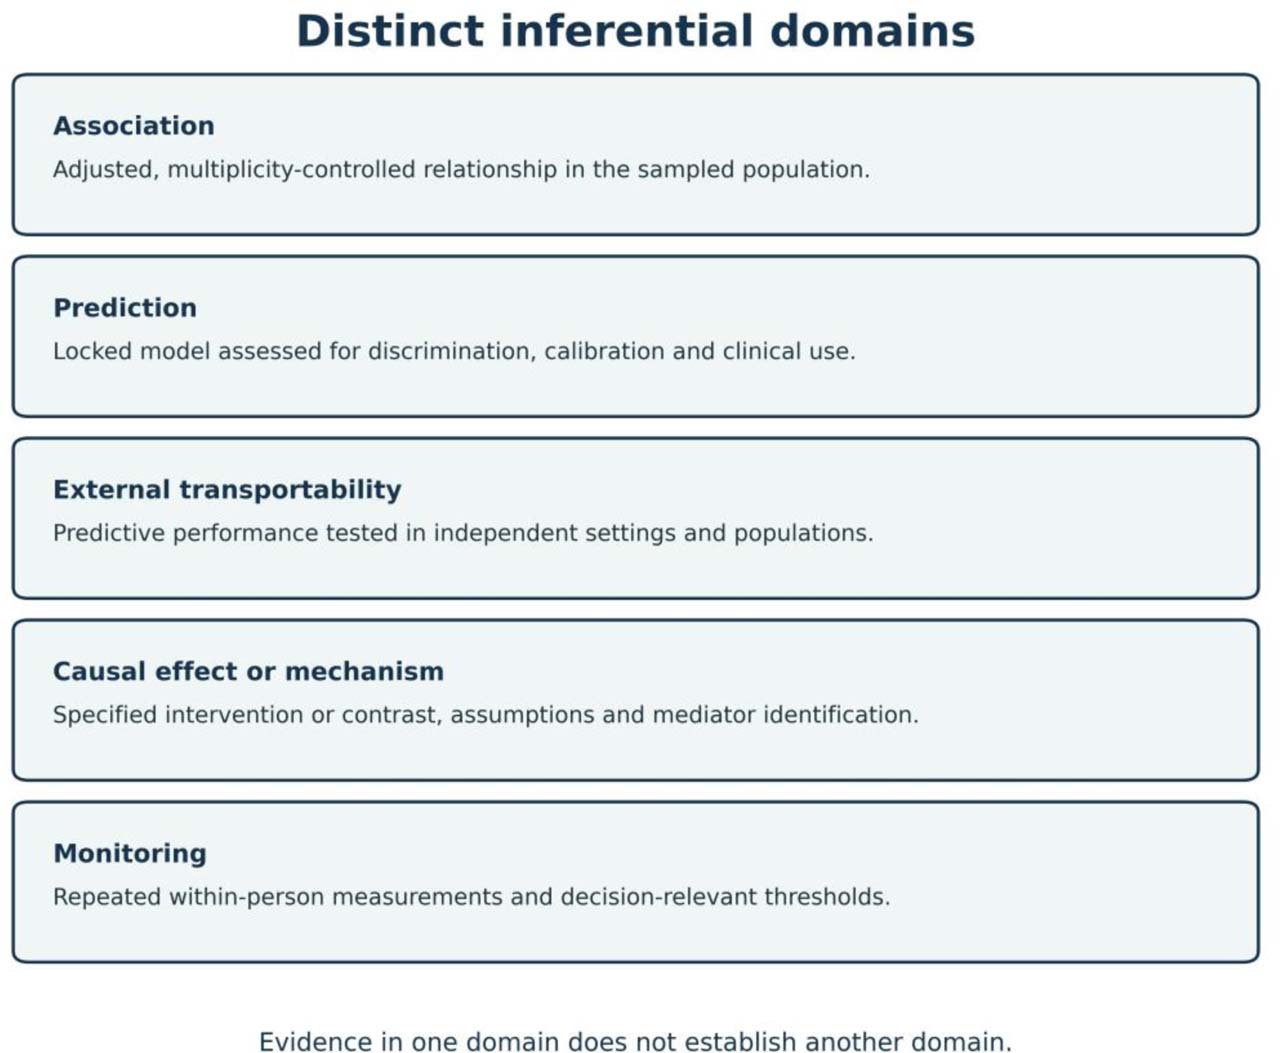
Figure 5.
Independent inferential domains in microbiome–metabolome research
Figure 5. Association, prediction, external transportability, causal effect/mechanism and monitoring are separate aims. External validation tests a locked predictive model; replication of an association does not establish a mechanism. Longitudinal observation supports temporality but not causal identification. Clinical monitoring requires within-person repeatability and a decision-relevant use case.
12.1. Worked design examples
Clinical prediction example. Target claim: a microbiome–metabolome signature improves 12-month prediction of IBD flare beyond established clinical predictors. Design: prospective cohort with stool and blood collected at baseline before outcome ascertainment, repeated sampling where feasible, and predefined medication/diet covariates. Assays: stool shotgun metagenomics and targeted plasma metabolomics with calibrated quality controls. Integration: supervised regularized model with all transformations and feature selection restricted to nested training folds. Validation: adequate event-based sample size, locked model, independent external cohort, discrimination, calibration, incremental value and decision-curve utility. Justified conclusion: the locked signature predicts flare in the externally tested population if those evaluations are satisfactory; it does not establish a microbial cause.
Mechanistic example. Target claim: gut microbial metabolism contributes to circulating trimethylamine N-oxide (TMAO) after phosphatidylcholine exposure. Design: standardized dietary challenge with serial paired samples before and after a defined microbial perturbation, plus appropriate controls; temporal measurements distinguish precursor, trimethylamine and circulating TMAO. Assays: targeted microbial CutC/CutD pathway measurements in stool or the relevant compartment and isotope-labelled targeted plasma/urine metabolomics, with renal function measured. Integration: prespecified within-person kinetic comparison and pathway-informed analysis rather than association-only co-occurrence. Validation: replication of the challenge and perturbation effect; identifying a specific microbial mediator requires an additional targeted manipulation and defensible mediation assumptions. Justified conclusion: the perturbation supports microbial involvement in TMAO formation under the tested conditions, but a diet- or antibiotic-wide perturbation alone cannot assign the effect to a particular taxon or prove that TMAO mediates cardiovascular events [27, 28, 47].
13. Conclusions
Integrated microbiome–metabolome research can move beyond taxonomic association by linking microbial composition, functional potential, metabolite measurement and host physiology [2, 4, 9, 26]. The proposed framework places the intended claim at the start of design and the achieved validation level at the end. Its value lies in coherence: compartment, analytical depth, integration and interpretation must all answer the same question [1, 8, 9].
No workflow is universally optimal. Sequencing and untargeted metabolomics can support exploratory discovery; shotgun metagenomics paired with validated targeted assays can strengthen pathway-level interpretation. Longitudinal sampling establishes temporal order but does not by itself control confounding. Replication of an association replicates that association, not a causal effect. Multifactor interventions do not isolate a microbial mediator unless the mediator is specifically identified. Prediction needs locked-model evaluation and transportability testing, whereas causal claims need a specified effect, defensible identification assumptions and informative perturbation [8, 41, 42, 47].
Notes
[10] Contributed by Author Contributions
Conceptualization, M.M.P. and S.M.C.; methodology, M.M.P. and S.M.C.; literature search and screening, R.F.I., A.C.S. and I.C.; data curation and bibliographic verification, O.A.P. and A.C.S.; writing-original draft preparation, R.F.I.; writing-review and editing, R.F.I., M.M.P., A.C.S., O.A.P., I.C., S.M.C. and L.A.P.; critical scientific revision, S.M.C. and L.A.P.; visualization, M.M.P. and L.A.P.; supervision, S.M.C. and L.A.P.; project administration, L.A.P. All authors have read and approved the submitted version.
[11] Funding:
This research received no external funding. Any article processing charges will be covered by the authors.
[14] Artificial Intelligence (AI)-Assisted Technologies: During manuscript preparation, ChatGPT (OpenAI) assisted with language editing, structural refinement, consistency checks, and the design and coding of Figures 1–5. The schematic diagrams were rendered from Matplotlib code; no generative image model was used. The authors remain responsible for the accuracy and integrity of the final text, figures, references and interpretations.
Acknowledgements
None.