
Figure 1:
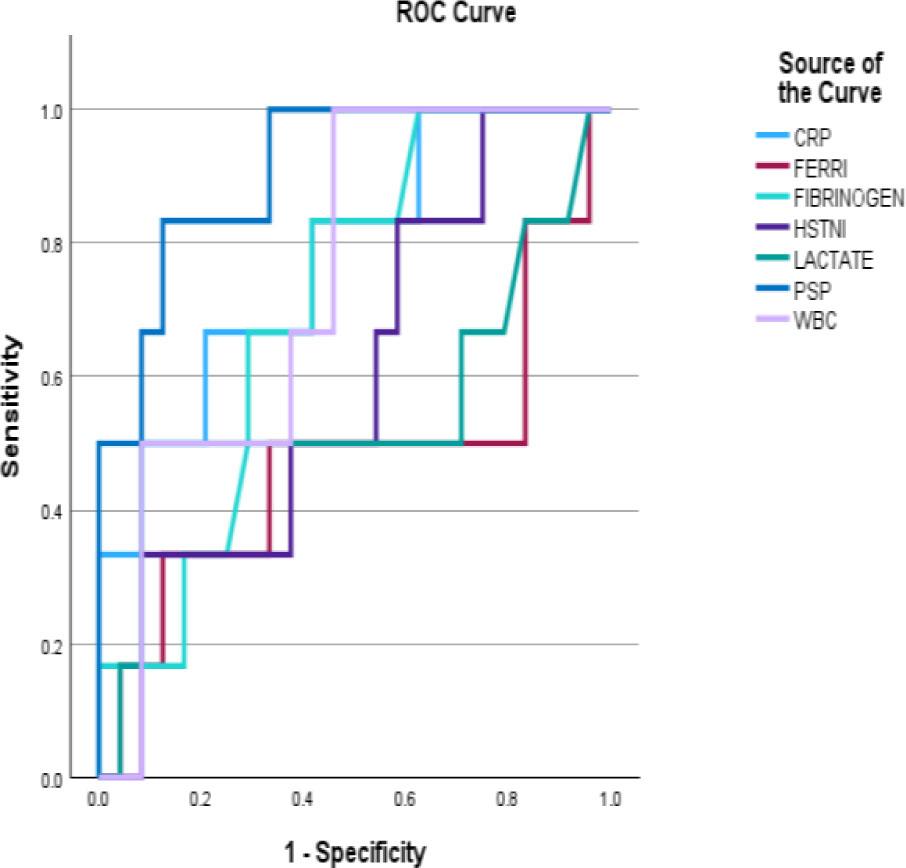
ROC curve analysis for biomarkers predicting prolonged length of stay (>9 days)
| Biomarker | AUC | 95% CI | Sensitivity (%) | Specificity (%) | Threshold value |
|---|---|---|---|---|---|
| Pancreatic Stone Protein (PSP) | 0.910 | 0.851–0.970 | 86.5 | 87.3 | 76 ng/mL |
| C-Reactive Protein (CRP) | 0.778 | 0.678–0.878 | 69.2 | 79.3 | 25.9 mg/l |
| White Blood Cell count (WBC) | 0.743 | 0.635–0.850 | 63.5 | 75.0 | 8.84 ×10³/L |
| Lactate | 0.726 | 0.620–0.832 | 61.5 | 72.6 | 2.20 mmol/L |
| Fibrinogen | 0.687 | 0.578–0.796 | 59.6 | 68.4 | 511 mg/dL |
| Ferritin | 0.655 | 0.540–0.770 | 55.8 | 65.3 | 1048 ng/mL |
Summary of demographic characteristics
| Parameter Group | Characteristic | Value |
|---|---|---|
| Demographics | Mean age ± SD | 66.7 ± 20.8 years |
| Sex: male / female | 44.6% / 55.4% | |
| Primary infection site(n) | Lower respiratory tract infections | 47.4% (54) |
| Urinary tract infections | 34.2% (39) | |
| Intra-abdominal infections | 18.4 % (21) | |
| Inflammatory biomarkers | Lactate (mmol/L) | 1.8 ± 2.8 |
| C-reactive protein (CRP, mg/dL) | 11.7 ± 2.7 | |
| High-sensitivity troponin I (ng/L) | 101.2 (10.2–2016.6) | |
| Median (min–max) | ||
| 435 (16–2593) | |
| Fibrinogen | 509.6±219.9 | |
| White blood count (K/μL) | 15910.2±3910.8 | |
| Comorbidities | Diabetes mellitus | 27% |
| Hypertension | 33% | |
| Cardiovascular disease | 17% | |
| Dyslipidemia | 28% | |
| Chronic kidney disease | 2% | |
| Cancer | 7% |