
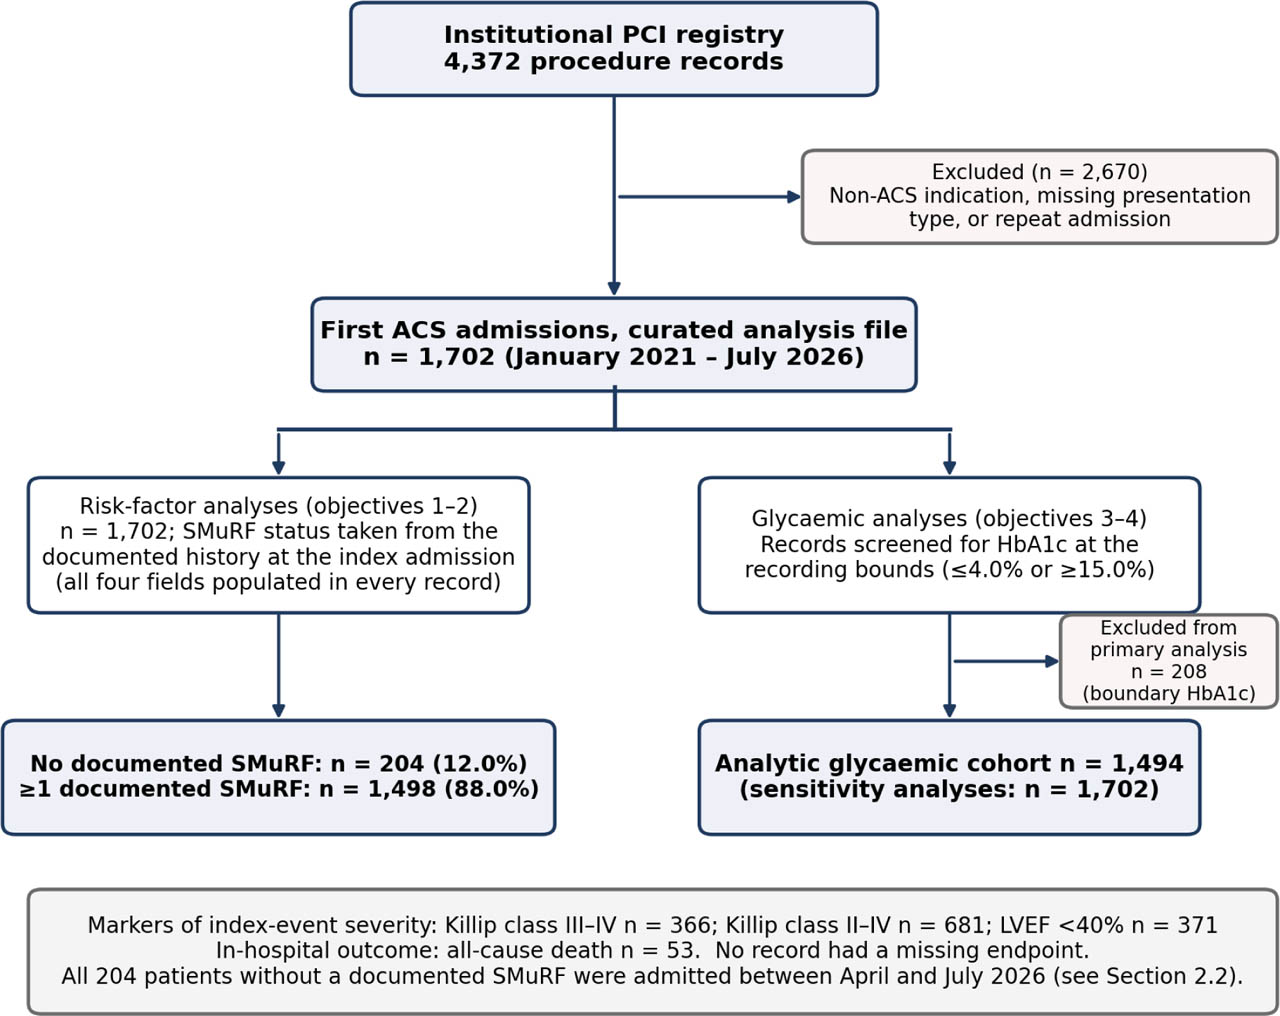
Figure 1-
Study flow. Derivation of the analysis cohort from the institutional PCI registry and allocation to the analytical objectives. SMuRF status was taken from the documented history at the index admission; all four-history fields were populated in every record. All 204 patients without a documented SMuRF were admitted between April 2026 and July 2026. The glycaemic analyses use the analytic cohort defined after the recording-bound audit. ACS, acute coronary syndrome; PCI, percutaneous coronary intervention; SMuRFs, standard modifiable cardiovascular risk factors.
Table 1-
Data-quality audit: number of records at the lower and upper recording bounds of each continuous variable (n = 1702).
| Variable | Lower bound | n (%) at bound | Mean of 5 adjacent values | Upper bound | n (%) at bound | Mean of 5 adjacent values |
|---|---|---|---|---|---|---|
| HbA1c (%) | 4 | 182 (10.7) | 14.0 | 15 | 26 (1.5) | 2.0 |
| Total cholesterol (mg/dL) | 60 | 150 (8.8) | 3.2 | 450 | 6 (0.4) | 1.0 |
| LDL cholesterol (mg/dL) | 20 | 94 (5.5) | 3.2 | 350 | 4 (0.2) | 1.2 |
| Creatinine (mg/dL) | 0.3 | 45 (2.6) | 7.6 | 15 | 21 (1.2) | 1.0 |
| eGFR (mL/min/1.73 m2) | 3 | 31 (1.8) | 1.2 | 150 | 23 (1.4) | 1.0 |
| GRACE score | 40 | 73 (4.3) | 4.2 | 320 | 3 (0.2) | 1.0 |
| Heart rate (beats/min) | 30 | 54 (3.2) | 7.6 | 180 | 5 (0.3) | 1.4 |
| BMI (kg/m2) | 14 | 32 (1.9) | 2.2 | 47.7 | 1 (0.1) | 1.0 |
| Registry glucose (mg/dL) | 71 | 1 (0.1) | 1.2 | 800 | 13 (0.8) | 1.0 |
| Systolic blood pressure (mmHg) | 70 | 1 (0.1) | 1.2 | 237 | 1 (0.1) | 2.0 |
| LV ejection fraction (%) | 20 | 1 (0.1) | 5.8 | 74 | 1 (0.1) | 4.0 |
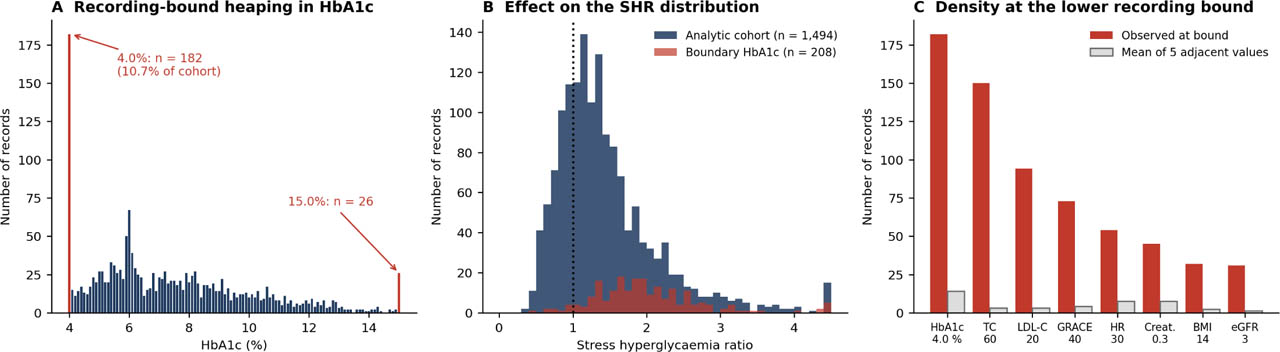
Figure 2-
Data-quality audit. (A) Distribution of recorded HbA1c, with values at the lower (4.0%) and upper (15.0%) recording bounds highlighted. (B) Distribution of the SHR in the analytic cohort and in the excluded boundary-HbA1c records, showing the inflation produced by a truncated denominator. (C) Number of records at the lower recording bound of eight variables compared with the mean number at the five adjacent values. BMI, body mass index; eFGR, estimated glomerular filtration rate; SHR, stress hyperglycaemia ratio; SMuRF, standard modifiable cardiovascular risk factor.
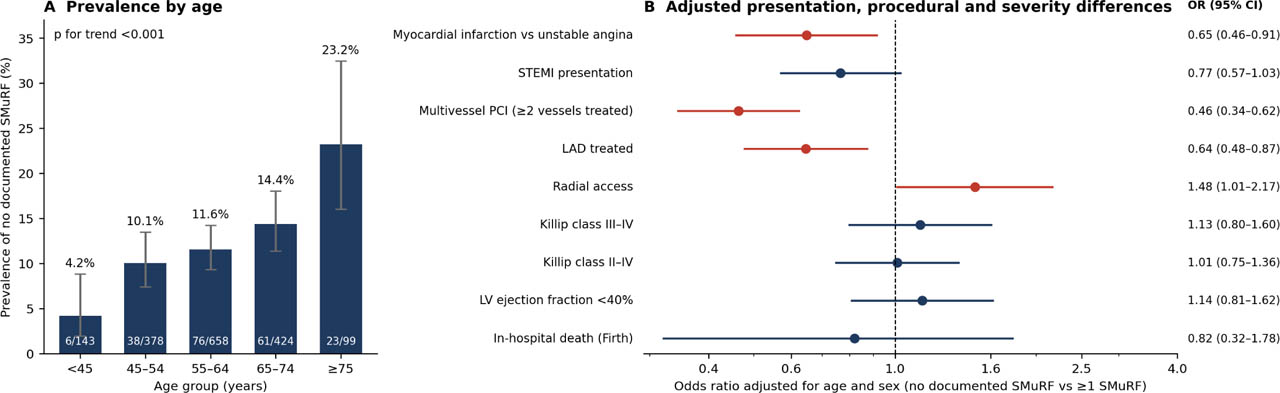
Figure 3-
ACS without a documented SMuRF. (A) Proportion by age group with Wilson 95% CIs; the number of patients without a documented SMuRF and the group size are shown in each bar. (B) ORs comparing patients without and with a documented SMuRF, adjusted for age and sex (the in-hospital death model is Firth-penalised and additionally adjusted for STEMI). Red markers denote intervals excluding 1. Multivessel PCI is defined as two or more vessels treated. ACS, acute coronary syndrome; CI, confidence intervals; LAD, left anterior descending artery; OR, odds ratio; PCI, percutaneous coronary intervention; SMuRFs, standard modifiable cardiovascular risk factors; STEMI, ST-elevation myocardial infarction.
Table 2-
Proportion of patients without a documented SMuRF under the primary and five pre-specified alternative definitions (n = 1702).
| Definition | n/N | Proportion, % (95% CI) |
|---|---|---|
| Primary definition (no documented history of any of the four SMuRFs) | 204/1702 | 12.0 (10.5–13.6) |
| Hypercholesterolaemia broadened to history or LDL-C ≥130 mg/dL | 172/1702 | 10.1 (8.8–11.6) |
| Diabetes broadened to history or HbA1c ≥6.5% | 204/1702 | 12.0 (10.5–13.6) |
| Hypertension broadened to history or admission SBP ≥140 mmHga | 160/1702 | 9.4 (8.1–10.9) |
| Ever-smoking substituted for current smoking | 64/1702 | 3.8 (3.0–4.8) |
| All four broadenings applied together | 45/1702 | 2.6 (2.0–3.5) |
Table 3-
Baseline characteristics, presentation, markers of index-event severity and in-hospital death of patients with ACS, by documented SMuRF status.
| Variable | n | Overall | ≥1 SMuRF | No documented SMuRF | p |
|---|---|---|---|---|---|
| Demographics and medical history (not part of the SMuRF definition) | |||||
| Age (years) | 1702 | 60 (52–66) | 60 (52–66) | 62 (55–69) | <0.001 |
| Male sex | 1702 | 1266 (74.4) | 1123 (75.0) | 143 (70.1) | 0.159 |
| BMI (kg/m2) | 1702 | 24.5 (21.2–28.3) | 24.9 (21.0–28.8) | 23.4 (21.7–25.6) | <0.001 |
| Ever smoking | 1702 | 1258 (73.9) | 1118 (74.6) | 140 (68.6) | 0.081 |
| Family history of premature CVD | 1702 | 242 (14.2) | 209 (14.0) | 33 (16.2) | 0.455 |
| Previous myocardial infarction | 1702 | 43 (2.5) | 38 (2.5) | 5 (2.5) | 1.000 |
| Previous PCI | 1702 | 181 (10.6) | 156 (10.4) | 25 (12.3) | 0.497 |
| Previous heart failure | 1702 | 294 (17.3) | 253 (16.9) | 41 (20.1) | 0.299 |
| Cerebrovascular disease | 1702 | 34 (2.0) | 33 (2.2) | 1 (0.5) | 0.114 |
| Chronic kidney disease | 1702 | 31 (1.8) | 28 (1.9) | 3 (1.5) | 1.000 |
| Documented SMuRFs (defining variables) | |||||
| Hypertension | 1702 | 1093 (64.2) | 1093 (73.0) | 0 (0.0) | <0.001 |
| Diabetes mellitus | 1702 | 1013 (59.5) | 1013 (67.6) | 0 (0.0) | <0.001 |
| Dyslipidaemia | 1702 | 946 (55.6) | 946 (63.2) | 0 (0.0) | <0.001 |
| Current smoking | 1702 | 710 (41.7) | 710 (47.4) | 0 (0.0) | <0.001 |
| Measurements linked to the SMuRF definition (differences expected by construction) | |||||
| Systolic blood pressure (mmHg) | 1702 | 140 (125–158) | 143 (128–160) | 125 (112–137) | <0.001 |
| Diastolic blood pressure (mmHg) | 1702 | 89 (81–99) | 90 (83–100) | 76 (68–84) | <0.001 |
| Total cholesterol (mg/dL) | 1702 | 162 (110–218) | 168 (112–224) | 142 (106–173) | <0.001 |
| LDL cholesterol (mg/dL) | 1702 | 116 (71–165) | 124 (76–171) | 80 (60–110) | <0.001 |
| HbA1c (%)a | 1494 | 7.2 (5.8–9.1) | 7.7 (6.1–9.5) | 5.9 (5.5–6.0) | <0.001 |
| Registry glucose (mg/dL)a | 1494 | 187 (145–289) | 204 (151–310) | 150 (126–170) | <0.001 |
| Other measurements | |||||
| SHRa | 1494 | 1.29 (0.98–1.69) | 1.30 (0.94–1.79) | 1.27 (1.13–1.43) | 0.731 |
| Heart rate (beats/min) | 1702 | 82 (63–100) | 82 (63–102) | 80 (66–93) | 0.067 |
| Creatinine (mg/dL) | 1702 | 1.1 (0.8–1.4) | 1.1 (0.8–1.4) | 1.0 (0.8–1.3) | 0.577 |
| eGFR (mL/min/1.73 m2) | 1702 | 78 (54–99) | 78 (54–99) | 75 (53–96) | 0.467 |
| GRACE risk score | 1702 | 134 (95–173) | 136 (96–176) | 126 (95–156) | 0.035 |
| Presentation and markers of index-event severity | |||||
| STEMI presentation | 1702 | 941 (55.3) | 840 (56.1) | 101 (49.5) | 0.090 |
| Myocardial infarction (STEMI or NSTEMI) | 1702 | 1382 (81.2) | 1229 (82.0) | 153 (75.0) | 0.020 |
| Killip class III–IV | 1702 | 366 (21.5) | 318 (21.2) | 48 (23.5) | 0.509 |
| Killip class II–IV | 1702 | 681 (40.0) | 599 (40.0) | 82 (40.2) | 1.000 |
| LV ejection fraction (%) | 1702 | 52 (48–56) | 52 (48–56) | 52 (48–56) | 0.978 |
| LV ejection fraction <40% | 1702 | 371 (21.8) | 322 (21.5) | 49 (24.0) | 0.466 |
| Procedure | |||||
| Vessels treated, n | 1702 | 2 (1–3) | 2 (1–3) | 1 (1–3) | 0.002 |
| LAD treated | 1702 | 1144 (67.2) | 1025 (68.4) | 119 (58.3) | 0.005 |
| Left main treated | 1702 | 82 (4.8) | 72 (4.8) | 10 (4.9) | 1.000 |
| Multivessel PCI (≥2 vessels treated)b | 1702 | 1102 (64.7) | 1004 (67.0) | 98 (48.0) | <0.001 |
| Registry ‘multivessel’ fieldb | 1702 | 1198 (70.4) | 1079 (72.0) | 119 (58.3) | <0.001 |
| Radial access | 1702 | 250 (14.7) | 211 (14.1) | 39 (19.1) | 0.072 |
| Discharge medication and in-hospital outcome | |||||
| Statin at dischargec | 1649 | 1647 (99.9) | 1449 (99.9) | 198 (100.0) | 1.000 |
| P2Y12 inhibitor at dischargec | 1649 | 1641 (99.5) | 1443 (99.4) | 198 (100.0) | 0.607 |
| Aspirin at dischargec | 1649 | 1629 (98.8) | 1432 (98.7) | 197 (99.5) | 0.499 |
| In-hospital all-cause death | 1702 | 53 (3.1) | 47 (3.1) | 6 (2.9) | 1.000 |
ACS, acute coronary syndrome; CVD, cardiovascular disease; eGFR, estimated glomerular filtration rate; IQR, interquartile range; LAD, left anterior descending artery; LDL, low-density lipoprotein; LV, left ventricular; NSTEMI, non-ST-elevation myocardial infarction, PCI, percutaneous coronary intervention; SMuRF, standard modifiable cardiovascular risk factor; STEMI, ST-elevation myocardial infarction.
Continuous variables are median (IQR); categorical variables are n (%). The n column gives the number of records contributing to that row.
a Calculated in the analytic cohort of 1494 patients (≥1 SMuRF n = 1290; no documented SMuRF n = 204) after exclusion of boundary-recorded HbA1c; all other rows use all 1702 records (≥1 SMuRF n = 1498; no documented SMuRF n = 204).
Table 4-
Adjusted differences between patients without and with a documented SMuRF.
| Characteristic | Effect measure | Estimate (95% CI) | p | n |
|---|---|---|---|---|
| Measurements linked to the SMuRF definition (differences expected by construction) | ||||
| Systolic blood pressure (mmHg) | Adjusted mean difference | −20.18 (−23.62 to −16.74) | <0.001 | 1702 |
| Diastolic blood pressure (mmHg) | Adjusted mean difference | −15.69 (−17.65 to −13.74) | <0.001 | 1702 |
| Total cholesterol (mg/dL) | Adjusted mean difference | −35.43 (−46.87 to −23.99) | <0.001 | 1702 |
| LDL cholesterol (mg/dL) | Adjusted mean difference | −38.25 (−47.55 to −28.94) | <0.001 | 1702 |
| HbA1c (%)a | Adjusted mean difference | −2.23 (−2.57 to −1.90) | <0.001 | 1494 |
| Registry glucose (mg/dL)a | Adjusted mean difference | −98.55 (−118.63 to −78.47) | <0.001 | 1494 |
| Variables not part of the SMuRF definition | ||||
| Age (years) | Adjusted mean difference | +3.29 (1.81–4.78) | <0.001 | 1702 |
| BMI (kg/m2) | Adjusted mean difference | −1.55 (−2.39 to −0.70) | <0.001 | 1702 |
| Heart rate (beats/min) | Adjusted mean difference | −4.89 (−9.12 to −0.66) | 0.023 | 1702 |
| Creatinine (mg/dL) | Adjusted mean difference | −0.38 (−0.67 to −0.10) | 0.009 | 1702 |
| eGFR (mL/min/1.73 m2) | Adjusted mean difference | +3.69 (−0.53 to 7.92) | 0.087 | 1702 |
| GRACE risk score | Adjusted mean difference | −18.66 (−25.46 to −11.87) | <0.001 | 1702 |
| SHR (mean)a,b | Adjusted mean difference | −0.17 (−0.28 to −0.06) | 0.003 | 1494 |
| LV ejection fraction (%) | Adjusted mean difference | −0.31 (−1.93 to 1.30) | 0.705 | 1702 |
| Vessels treated, n | Adjusted mean difference | −0.21 (−0.38 to −0.04) | 0.017 | 1702 |
| STEMI presentation | aOR | 0.77 (0.57–1.03) | 0.075 | 1702 |
| Myocardial infarction versus unstable angina | aOR | 0.65 (0.46–0.91) | 0.014 | 1702 |
| Killip class III–IV | aOR | 1.13 (0.80–1.60) | 0.489 | 1702 |
| Killip class II–IV | aOR | 1.01 (0.75–1.36) | 0.946 | 1702 |
| LV ejection fraction <40% | aOR | 1.14 (0.81–1.62) | 0.450 | 1702 |
| LAD treated | aOR | 0.64 (0.48–0.87) | 0.004 | 1702 |
| Left main treated | aOR | 1.12 (0.57–2.22) | 0.745 | 1702 |
| Multivessel PCI (≥2 vessels treated) | aOR | 0.46 (0.34–0.62) | <0.001 | 1702 |
| Radial access | aOR | 1.48 (1.01–2.17) | 0.044 | 1702 |
| In-hospital all-cause death | aOR (Firth) | 0.82 (0.32–1.78) | 0.637 | 1702 |
aOR, adjusted odds ratio; eFGR, estimated glomerular filtration rate; LAD, left anterior descending artery; LDL, low-density lipoprotein; LV, left ventricular; PCI, percutaneous coronary intervention; SHR, stress hyperglycaemia ratio; SMuRFs, standard modifiable cardiovascular risk factors; STEMI, ST-elevation myocardial infarction.
All estimates compare patients without a documented SMuRF with those with ≥1 SMuRF and are adjusted for age (except the model for age) and sex.
b Difference in means; the adjusted difference in medians was −0.03 (−0.13 to 0.06; p = 0.473)—see Supplementary Table S3. The in-hospital death model uses Firth penalised logistic regression additionally adjusted for STEMI presentation, with profile penalised-likelihood CIs (53 events). Estimates after exclusion of recording-bound values are given in Supplementary Table S1. Abbreviations as in Table 3.
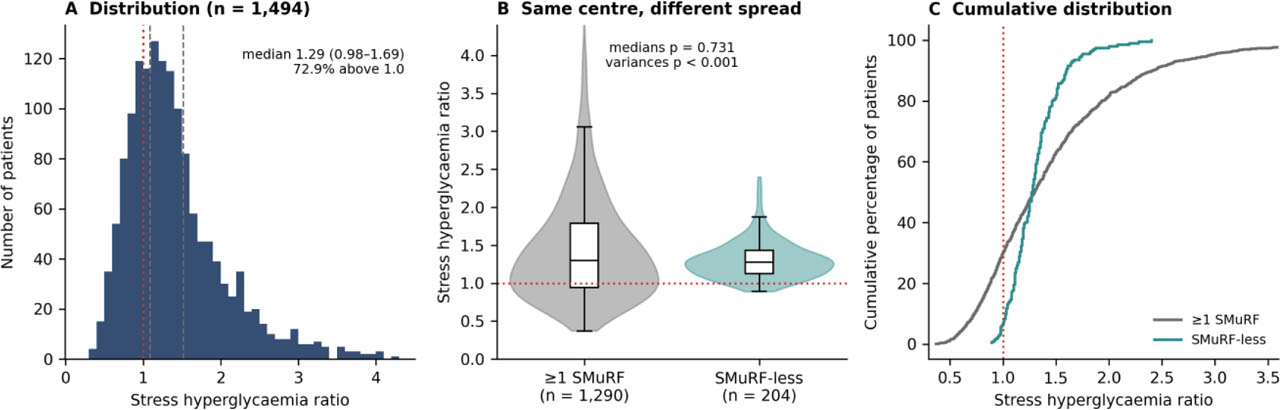
Figure 4-
Distribution of the SHR. (A) Distribution in the analytic cohort; the dotted line marks an SHR of 1.0 and the dashed lines the tertile boundaries. (B) SHR by SMuRF status (violin plots with box plots); the medians are similar (p = 0.731) but the variances differ (p < 0.001), so the means differ. (C) Cumulative distributions for the two groups, which cross close to the median: patients without a documented SMuRF are more likely to exceed an SHR of 1.0 and much less likely to have high values. SHR, stress hyperglycaemia ratio; SMuRFs, standard modifiable cardiovascular risk factors.
Table 5-
Characteristics of the analytic cohort by tertile of the SHR (n = 1494).
| Variable | Tertile 1 (≤1.09) n = 509 | Tertile 2 (1.10–1.52) n = 492 | Tertile 3 (≥1.53) n = 493 | p |
|---|---|---|---|---|
| Age (years) | 60 (53–66) | 60 (52–67) | 61 (53–67) | 0.542 |
| Male sex | 375 (73.7) | 366 (74.4) | 369 (74.8) | 0.912 |
| BMI (kg/m2) | 24.5 (21.2–28.3) | 24.5 (21.3–28.3) | 24.5 (21.2–28.3) | 0.981 |
| Systolic blood pressure (mmHg) | 140 (125–156) | 140 (124–155) | 141 (126–159) | 0.169 |
| Registry glucose (mg/dL) | 154 (125–191) | 173 (145–245) | 310 (216–454) | <0.001 |
| HbA1c (%) | 8.2 (7.0–10.1) | 6.2 (5.6–8.2) | 6.6 (5.2–8.6) | <0.001 |
| SHR | 0.88 (0.73–0.99) | 1.30 (1.19–1.39) | 1.99 (1.71–2.45) | <0.001 |
| eGFR (mL/min/1.73 m2) | 78 (54–98) | 75 (54–98) | 78 (51–98) | 0.958 |
| LDL cholesterol (mg/dL) | 120 (68–167) | 107 (71–153) | 117 (75–170) | 0.069 |
| Hypertension | 356 (69.9) | 242 (49.2) | 347 (70.4) | <0.001 |
| Diabetes mellitus | 365 (71.7) | 262 (53.3) | 330 (66.9) | <0.001 |
| Dyslipidaemia | 290 (57.0) | 228 (46.3) | 297 (60.2) | <0.001 |
| Current smoking | 216 (42.4) | 173 (35.2) | 218 (44.2) | 0.009 |
| No documented SMuRF | 36 (7.1) | 139 (28.3) | 29 (5.9) | <0.001 |
| Previous heart failure | 103 (20.2) | 69 (14.0) | 85 (17.2) | 0.034 |
| STEMI presentation | 279 (54.8) | 277 (56.3) | 272 (55.2) | 0.886 |
| Myocardial infarction (STEMI or NSTEMI) | 410 (80.6) | 401 (81.5) | 404 (81.9) | 0.845 |
| GRACE risk score | 138 (101–178) | 127 (90–168) | 143 (98–175) | 0.005 |
| Killip class III–IV | 112 (22.0) | 100 (20.3) | 107 (21.7) | 0.789 |
| Killip class II–IV | 219 (43.0) | 187 (38.0) | 196 (39.8) | 0.258 |
| LV ejection fraction (%) | 52 (48–56) | 52 (48–56) | 52 (48–56) | 0.410 |
| LV ejection fraction <40% | 108 (21.2) | 105 (21.3) | 108 (21.9) | 0.961 |
| Vessels treated, n | 2 (1–3) | 2 (1–3) | 2 (1–3) | 0.956 |
| LAD treated | 342 (67.2) | 327 (66.5) | 340 (69.0) | 0.689 |
| Multivessel PCI (≥2 vessels treated) | 330 (64.8) | 314 (63.8) | 325 (65.9) | 0.788 |
| In-hospital all-cause death | 23 (4.5) | 11 (2.2) | 12 (2.4) | 0.067 |
[i] BMI, body mass index; eFGR, estimated glomerular filtration rate; IQR, interquartile range; LAD, left anterior descending artery; LDL, low-density lipoprotein; LV, left ventricular; NSTEMI, non-ST-elevation myocardial infarction; PCI, percutaneous coronary intervention; SHR, stress hyperglycaemia ratio; SMuRFs, standard modifiable cardiovascular risk factors; STEMI, ST-elevation myocardial infarction.
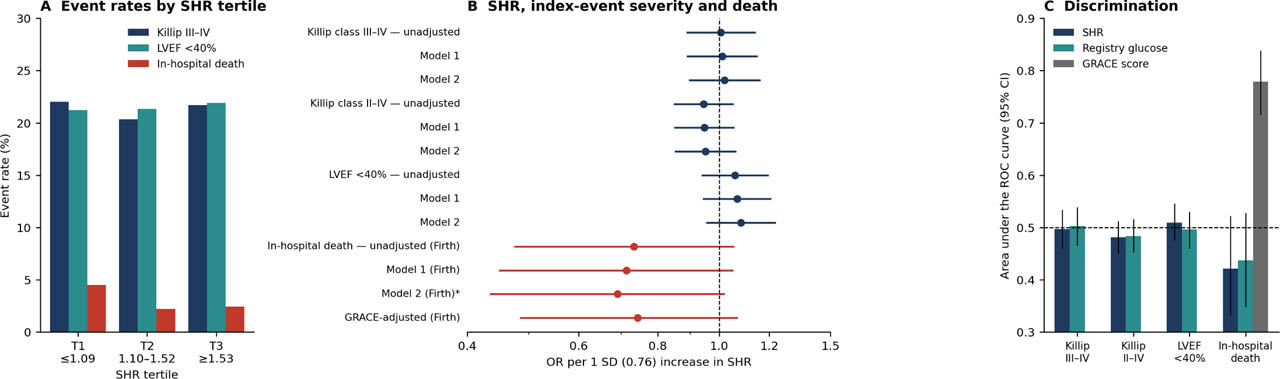
Figure 5-
SHR, markers of index-event severity and in-hospital death. (A) Event rates across SHR tertiles. (B) ORs per 1 SD increase in SHR: unadjusted, Model 1 and Model 2 (without the GRACE score) for each severity marker, and Firth-penalised unadjusted, Model 1, Model 2 (sensitivity) and GRACE-adjusted estimates for in-hospital death. (C) Area under the ROC curve with bootstrap 95% CIs for SHR and registry glucose; the GRACE score is shown only for in-hospital death, because Killip class is a component of the score. The dashed line marks chance discrimination. ORs, odds ratios; SD, standard deviation; SHR, stress hyperglycaemia ratio.
Table 6-
Association of the SHR with markers of index-event severity and in-hospital death (analytic cohort, n = 1494).
| Endpoint | Events/n | Model | OR per 1 SD of SHR (95% CI) | p |
|---|---|---|---|---|
| Killip class III–IV | 319/1494 | Unadjusted | 1.01 (0.89–1.14) | 0.918 |
| Model 1a | 1.01 (0.89–1.15) | 0.866 | ||
| Model 2b | 1.02 (0.90–1.16) | 0.757 | ||
| Model 2, boundary covariates excludedc | 1.01 (0.89–1.16) | 0.848 | ||
| Killip class II–IV | 602/1494 | Unadjusted | 0.95 (0.85–1.05) | 0.295 |
| Model 1a | 0.95 (0.85–1.05) | 0.317 | ||
| Model 2b | 0.95 (0.85–1.06) | 0.370 | ||
| Model 2, boundary covariates excludedc | 0.95 (0.85–1.06) | 0.379 | ||
| LV ejection fraction <40% | 321/1494 | Unadjusted | 1.06 (0.94–1.19) | 0.341 |
| Model 1a | 1.07 (0.95–1.20) | 0.292 | ||
| Model 2b | 1.08 (0.96–1.23) | 0.208 | ||
| Model 2, boundary covariates excludedc | 1.09 (0.96–1.24) | 0.199 | ||
| In-hospital all-cause death | 46/1494 | Unadjusted (Firth)d | 0.73 (0.48–1.05) | 0.098 |
| Model 1 (Firth)d | 0.71 (0.45–1.05) | 0.092 | ||
| Model 2 (Firth), sensitivityd,e | 0.69 (0.44–1.02) | 0.062 | ||
| GRACE-adjusted (Firth)d,f | 0.74 (0.49–1.07) | 0.114 |
CI, confidence interval; LV, left ventricular; OR, odds ratio; SD, standard deviation; SHR, stress hyperglycaemia ratio; VIF, variance inflation factor.
b Model 2: Model 1 plus hypertension, dyslipidaemia, current smoking, BMI, LDL cholesterol and previous heart failure. The GRACE score, included in the original Model 2, was removed because Killip class is one of its components. Maximum VIF 1.42.
d Firth penalised logistic regression with profile penalised-likelihood CIs and penalised likelihood-ratio p values.
Table 6-
(continued). Tertile analysis of the same endpoints
| Endpoint | Model | Tertile 1 (≤1.09) | Tertile 2 (1.10–1.52) | Tertile 3 (≥1.53) | p for trend |
|---|---|---|---|---|---|
| Killip class III–IV | Model 1 | 1 (reference) | 0.88 (0.65–1.20) | 0.97 (0.72–1.32) | 0.863 |
| Model 2 | 1 (reference) | 0.94 (0.68–1.29) | 1.01 (0.74–1.37) | 0.975 | |
| Killip class II–IV | Model 1 | 1 (reference) | 0.79 (0.61–1.02) | 0.87 (0.67–1.12) | 0.264 |
| Model 2 | 1 (reference) | 0.84 (0.65–1.10) | 0.89 (0.68–1.15) | 0.355 | |
| LV ejection fraction <40% | Model 1 | 1 (reference) | 0.98 (0.72–1.34) | 1.03 (0.76–1.40) | 0.835 |
| Model 2 | 1 (reference) | 1.10 (0.80–1.51) | 1.08 (0.79–1.48) | 0.623 | |
| In-hospital all-cause death (Firth) | Unadjusted | 1 (reference) | 0.49 (0.23–0.99) | 0.54 (0.26–1.06) | 0.055 |
| Model 1 | 1 (reference) | 0.41 (0.19–0.83) | 0.50 (0.24–0.99) | 0.032 | |
| Model 2 (sensitivity) | 1 (reference) | 0.40 (0.18–0.84) | 0.48 (0.23–0.96) | 0.026 |
Table 7-
Chronic and acute glycaemic measures by documented SMuRF status (analytic cohort, n = 1494).
| Glycaemic measure | ≥1 SMuRF (n = 1290) | No documented SMuRF (n = 204) | p |
|---|---|---|---|
| HbA1c (%) | 7.7 (6.1–9.5) | 5.9 (5.5–6.0) | <0.001 |
| Estimated average glucose (mg/dL) | 174 (128–226) | 123 (111–125) | <0.001 |
| Registry glucose (mg/dL) | 204 (151–310) | 150 (126–170) | <0.001 |
| SHR, median (IQR) | 1.30 (0.94–1.79) | 1.27 (1.13–1.43) | 0.731 |
| SHR (mean) | 1.48 | 1.30 | see footnote |
| SHR, SD | 0.81 | 0.25 | <0.001a |
| SHR >1.0 | 900/1290 (69.8) | 189/204 (92.6) | <0.001 |
| SHR >1.25 | 676/1290 (52.4) | 108/204 (52.9) | 0.946 |
| SHR >1.5 | 475/1290 (36.8) | 37/204 (18.1) | <0.001 |
| SHR >2.0 | 235/1290 (18.2) | 4/204 (2.0) | <0.001 |
IQR, interquartile range; SD, standard deviation; SHR, stress hyperglycaemia ratio; SMuRF, standard modifiable cardiovascular risk factor. Median (IQR) or n/N (%).
a Levene test for equality of variances. Age- and sex-adjusted differences (no documented SMuRF minus ≥1 SMuRF): mean −0.17 (−0.28 to −0.06; p = 0.003); median −0.03 (−0.13 to 0.06; p = 0.473). The lower mean reflects the absence of a long right tail in patients without a documented SMuRF rather than a shift of the whole distribution (Supplementary Table S3).
Supplementary Table S1 -
Adjusted differences between patients without and with a documented SMuRF, with and without records at the recording bounds of each variable.
| Variable | All records: difference (95% CI) | n | Boundary records excluded: difference (95% CI) | n |
|---|---|---|---|---|
| LDL cholesterol (mg/dL) | −38.25 (−47.55 to −28.94) | 1702 | −43.09 (−51.85 to −34.34) | 1604 |
| Total cholesterol (mg/dL) | −35.43 (−46.87 to −23.99) | 1702 | −40.02 (−50.84 to −29.20) | 1546 |
| Creatinine (mg/dL) | −0.38 (−0.67 to −0.10) | 1702 | −0.26 (−0.46 to −0.06) | 1636 |
| eGFR (mL/min/1.73 m2) | 3.69 (−0.53 to 7.92) | 1702 | 3.15 (−0.90 to 7.19) | 1648 |
| GRACE risk score | −18.66 (−25.46 to −11.87) | 1702 | −19.97 (−26.60 to −13.34) | 1626 |
| Heart rate (beats/min) | −4.89 (−9.12 to −0.66) | 1702 | −5.56 (−9.57 to −1.54) | 1643 |
| BMI (kg/m2) | −1.55 (−2.39 to −0.70) | 1702 | −1.78 (−2.60 to −0.97) | 1669 |
[i] BMI, body mass index; CI, confidence interval; LDL, low-density lipoprotein; SMuRFs, standard modifiable cardiovascular risk factors. Linear regression adjusted for age and sex. In the right-hand columns, records at the lower or upper recording bound of that variable (Table 1) were excluded.
Supplementary Table S2 -
SHR analyses under four approaches to HbA1c values at the recording bounds.
| Approach | n | Killip III–IV | Killip II–IV | LVEF <40% | In-hospital death (Firth) | SHR difference, no documented SMuRF versus ≥1 SMuRF |
|---|---|---|---|---|---|---|
| Exclusion (primary) | 1494 | 1.01 (0.89–1.15) | 0.95 (0.85–1.05) | 1.07 (0.95–1.20) | 0.71 (0.45–1.05) | −0.17 (−0.28 to −0.06) |
| Retention of recorded values | 1702 | 1.04 (0.93–1.16) | 0.96 (0.87–1.06) | 1.09 (0.98–1.21) | 0.80 (0.55–1.09) | −0.25 (−0.36 to −0.13) |
| Multiple imputation (treated as missing) | 1702 | 1.03 (0.91–1.16) | 0.97 (0.87–1.07) | 1.06 (0.94–1.19) | 0.69 (0.47–1.03) | −0.16 (−0.27 to −0.04) |
| Censored imputation | 1702 | 1.04 (0.94–1.15) | 0.96 (0.88–1.05) | 1.08 (0.98–1.19) | 0.85 (0.64–1.13) | −0.31 (−0.44 to −0.18) |
[i] BMI, body mass index; LDL, low-density lipoprotein; OR, odds ratio; SD, standard ratio; SHR, stress hyperglycaemia ratio; SMuRFs, standard modifiable cardiovascular risk factors; STEMI, ST-elevation myocardial infarction.
[ii] ORs per 0.76 units of SHR (1 SD in the analytic cohort), adjusted as in Model 1. The last column is the age- and sex-adjusted mean difference. Multiple imputation: HbA1c for the 208 boundary records imputed 20 times from a linear model (diabetes, registry glucose, age, sex, BMI, LDL cholesterol, hypertension, dyslipidaemia, current smoking, SMuRF status, STEMI) fitted in non-boundary records, with parameter uncertainty; censored imputation draws from the same model truncated to 3.0%–4.0% (lower bound) or 15.0%–20.0% (upper bound). Estimates combined by Rubin's rules (Wald intervals); the exclusion and retention mortality intervals are profile penalised-likelihood intervals.
Supplementary Table S3 -
Comparison of the SHR between patients without and with a documented SMuRF using different summary measures (analytic cohort, n = 1494)
| Measure | ≥1 SMuRF (n = 1290) | No documented SMuRF (n = 204) | Difference (95% CI) |
|---|---|---|---|
| Median (IQR) | 1.30 (0.94–1.79) | 1.27 (1.13–1.43) | Mann–Whitney p = 0.731 |
| Mean (SD) | 1.48 (0.81) | 1.30 (0.25) | Levene p < 0.001 |
| Unadjusted mean difference | −0.17 (−0.29 to −0.06); p = 0.002 | ||
| Adjusted mean difference | −0.17 (−0.28 to −0.06); p = 0.003 | ||
| Adjusted difference in medians | −0.03 (−0.13 to 0.06); p = 0.473 | ||
| Adjusted ratio of geometric means | 0.98 (0.91–1.04); p = 0.489 | ||
| Adjusted difference, 25th percentile | 0.18 (0.11–0.26); p < 0.001 | ||
| Adjusted difference, 75th percentile | −0.38 (−0.51 to −0.24); p < 0.001 | ||
| Adjusted difference, 90th percentile | −0.80 (−1.01 to −0.59); p < 0.001 | ||
| Adjusted mean difference, SHR ≤2.0 only (n = 1255) | 0.10 (0.04–0.15); p < 0.001 |
[i] CI, confidence interval; IQR, interquartile range; SD, standard deviation; SHR, stress hyperglycaemia ratio; SMuRFs, standard modifiable cardiovascular risk factors.
[ii] Differences are no documented SMuRF minus ≥1 SMuRF, adjusted for age and sex (linear regression for means and log-transformed SHR; quantile regression for percentiles). The groups have similar medians; the lower mean in patients without a documented SMuRF results from fewer high values (lower 75th percentiles and 90th percentiles), while their lower quartile is higher.