
Introduction
Hypertension, diabetes mellitus, hypercholesterolaemia and smoking—the standard modifiable cardiovascular risk factors (SMuRFs)—are the main targets of coronary prevention [1,2] and account for most of the population-attributable risk of myocardial infarction [3]. Nevertheless, a substantial proportion of patients present with acute coronary syndrome (ACS) without any of them. In SWEDEHEART, 14.9% of 62,048 patients with ST-elevation myocardial infarction (STEMI) had no SMuRF, and these patients had higher in-hospital and 30-day mortality than patients with at least one SMuRF. The excess was greatest in women and was largely explained by differences in guideline-directed therapy at discharge [1]. An Australian STEMI cohort had reported similar findings [2]. Later series report a prevalence of 8%–27% [2,4,5,6], and a meta-analysis of 1,285,722 patients again found higher short-term mortality in SMuRF-less patients [7]. The finding is not consistent: an Australian percutaneous coronary intervention (PCI) registry of 18,988 patients found no difference in 30-day outcomes and lower long-term mortality among SMuRF-less patients [8]. A dedicated clinical pathway for coronary disease without conventional risk factors has also been proposed [9].
Asian data come from a few series in Singapore, Iran and China [4,5,6,10]. To our knowledge, no Indonesian interventional cohort has been described. This matters because the SMuRF-less category depends on how well risk factors are ascertained, and documentation practice, lipid screening and smoking patterns differ between health systems.
A separate question concerns acute rather than chronic metabolic disturbance. Glucose measured at presentation predicts death after myocardial infarction in patients with and without diabetes [11], but a single glucose value cannot distinguish an acute stress response from chronic hyperglycaemia. Roberts and colleagues addressed this by dividing admission glucose by the estimated average glucose derived from HbA1c, giving the stress hyperglycaemia ratio (SHR) [12,13]. Higher SHR has been associated with in-hospital death and major adverse cardiovascular events in coronary artery disease [14,15]; in a meta-analysis of 32 studies, the pooled relative risk of all-cause mortality for the highest SHR category was 1.67 (95% confidence interval [CI] 1.46–1.91) [16].
The two constructs are related: patients without a documented SMuRF have, by definition, no recorded diabetes, and SHR may identify an acute metabolic response that the SMuRF framework does not capture. Because SHR is a ratio of two laboratory values, it is also sensitive to recording artefacts; for example, an HbA1c value recorded at the lower reporting limit inflates the ratio without any physiological change [17]. We used an Indonesian PCI registry to (i) estimate the prevalence and clinical profile of ACS without a documented SMuRF, (ii) audit the registry for recording-bound artefacts before modelling, (iii) describe the distribution of SHR and its association with index-event severity and in-hospital death and (iv) compare SHR between patients with and without a documented SMuRF.
Methods
1. Study design, setting and population
We retrospectively analysed an institutional PCI registry maintained prospectively at a tertiary referral centre in East Java, Indonesia. The registry includes every patient undergoing invasive coronary management; data are entered by trained clinical staff at the time of the procedure. The study period was January 2021–July 2026. Records were eligible when the presentation was STEMI, non-STEMI (NSTEMI) or unstable angina, as assigned by the attending cardiologist using the European Society of Cardiology criteria in force at the time [18]. Unstable angina was defined as rest angina, new-onset or crescendo angina with or without transient ischaemic ECG changes, without a rise of high-sensitivity cardiac troponin above the 99th percentile. Records with a chronic coronary syndrome indication were excluded. When a patient had more than one ACS admission, only the first was kept. The analysis file comprised 1702 first ACS admissions from 4372 registry records (Figure 1). The report follows the STROBE checklist [19].
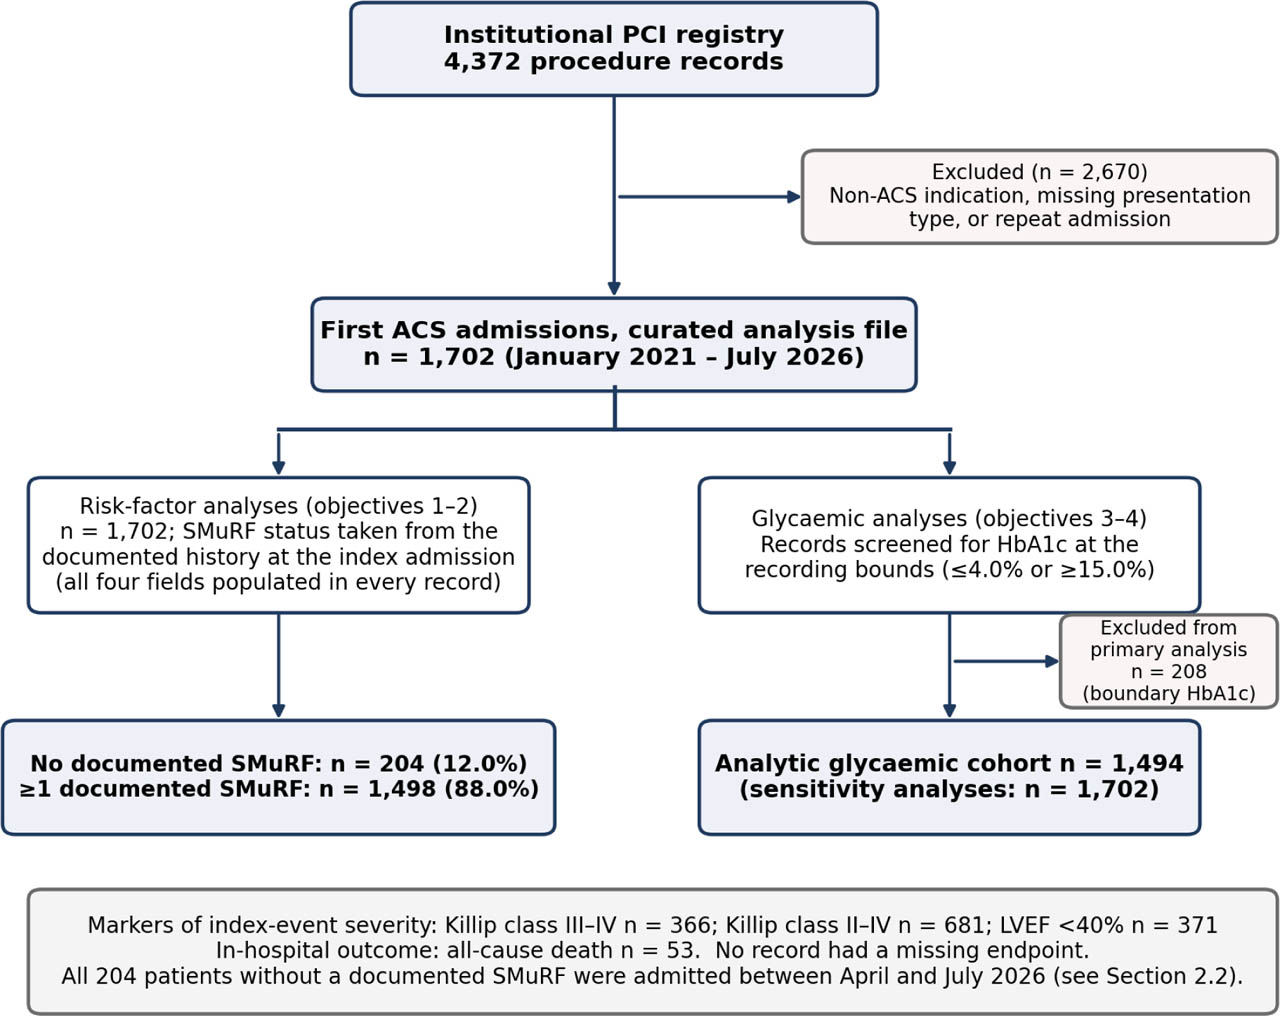
Figure 1-
Study flow. Derivation of the analysis cohort from the institutional PCI registry and allocation to the analytical objectives. SMuRF status was taken from the documented history at the index admission; all four-history fields were populated in every record. All 204 patients without a documented SMuRF were admitted between April 2026 and July 2026. The glycaemic analyses use the analytic cohort defined after the recording-bound audit. ACS, acute coronary syndrome; PCI, percutaneous coronary intervention; SMuRFs, standard modifiable cardiovascular risk factors.
All registry fields used in this analysis were complete in all 1702 records. The exception was the three discharge-medication fields, which were missing only for the 53 patients who died in hospital (1649 of 1702 records, 96.9%).
2. Definition and ascertainment of SMuRF status
We used the SWEDEHEART definitions [1]: hypertension, diabetes mellitus, hypercholesterolaemia (recorded in the registry as dyslipidaemia) and current smoking. Each was taken from the history fields documented at the index admission. Patients in whom all four were recorded as absent are described as having no documented SMuRF. We use ‘SMuRF-less’ only as a shorthand for this documented-history category; it does not establish that the risk factors were truly absent, particularly in patients who had had little previous preventive assessment. Patients with at least one recorded SMuRF are described as SMuRF-positive.
The history fields were completed by patient/family interview, referral letter, previous medical records, and current medication. The registry does not record whether patients had undergone blood-pressure, glucose or lipid screening before the index event, nor pre-admission medication.
All 204 patients without a documented SMuRF were admitted between 1 April 2026 and 31 July 2026. None of the 1473 patients admitted between January 2021 and March 2026 met the definition, whereas 204 of the 229 patients (89.1%) admitted from April 2026 did. This occurs due to a change in how risk-factor history fields were completed, a period of systematic inclusion of all ACS patients and retrospective back-entry of earlier records. Because SMuRF status and calendar period are completely aligned, the prevalence estimate and every comparison between groups may reflect differences in recording practice between periods as well as true clinical differences. Period could not be adjusted for statistically.
Because a documented-history definition depends on the intensity of pre-admission preventive care, five pre-specified alternative definitions were examined: hypercholesterolaemia broadened to history or measured low-density lipoprotein (LDL) cholesterol ≥130 mg/dL; diabetes broadened to history or HbA1c ≥6.5%; hypertension broadened to history or admission systolic blood pressure ≥140 mmHg; ever-smoking in place of current smoking; and all four broadenings together. Admission blood pressure during ACS is not evidence of chronic hypertension; this definition was used only to test how sensitive the estimate is to under-ascertainment, not to diagnose hypertension.
3. Glucose, HbA1c and the SHR
SHR was calculated as the registry glucose value divided by estimated average glucose, where estimated average glucose (mg/dL) = 28.7 × HbA1c (%) −46.7 [13]. An SHR above 1.0 indicates that the measured glucose exceeds the patient's chronic glycaemic level. SHR was analysed per one standard deviation (SD) and in tertiles of the analytic cohort.
The registry glucose field is labelled ‘fasting’. We could not verify these details for individual records. We therefore refer to this variable as ‘registry glucose’ rather than admission glucose. Among patients without recorded diabetes (n = 689), the median registry glucose was 153 (125–186) mg/dL and 61.4% had values ≥140 mg/dL, which suggests that many samples were not taken in a steady overnight-fasting state; however, the timing of individual samples relative to admission and PCI cannot be established.
4. Endpoints
The in-hospital outcome was all-cause death during the index admission. Killip class III–IV, Killip class II–IV and LVEF <40% were analysed as markers of index-event severity, not as downstream outcomes, because they are measured at or shortly after presentation, close in time to the glucose sample. Killip class was recorded at first assessment in the emergency department before PCI. LVEF was measured by transthoracic echocardiography using the biplane Simpson method, performed after PCI, at a median 6 hr after admission. For patients with more than one echocardiogram, the first study was used. No endpoint was missing.
5. Data-quality audit and handling of recording-bound values
Before any modelling we audited every continuous variable for heaping at its extreme recorded values. For each variable, we compared the number of records at exactly the minimum and at exactly the maximum value with the mean number at the five distinct values immediately inside each bound. In a distribution without clipping, the extreme value should be less common than its neighbours. A marked excess suggests that values below or above the reporting range, or unavailable values, were recorded at the bound [17]. Values at a bound may still be genuine measurements at an assay-reporting limit; we therefore treated them as uncertain rather than as errors.
HbA1c. The primary glycaemic analyses excluded records with HbA1c at either bound (≤4.0% or ≥15.0%; n = 208), giving an analytic cohort of 1494 patients. Because exclusion may cause selection bias, the main SHR models were repeated (1) retaining the recorded values, (2) treating boundary values as missing, with multiple imputation (20 imputations; predictors in Supplementary Table S2) and (3) treating them as censored, imputing from the same model restricted to 3.0%–4.0% or 15.0%–20.0%. Imputed estimates were combined with Rubin's rules.
Other variables. Heaping was also present in total cholesterol, LDL cholesterol, creatinine (and therefore estimated glomerular filtration rate [eGFR]), GRACE score, heart rate and body-mass index (BMI) (Table 1). For each of these variables we repeated the adjusted SMuRF-group comparisons after excluding records at that variable's bounds. For the SHR models, we repeated Model 2 after excluding records with a boundary value in any of its continuous covariates (LDL cholesterol, eGFR/creatinine or BMI; n = 180 excluded from the analytic cohort). GRACE score was no longer used as a covariate (Section Statistical analysis). Non-glycaemic analyses, including the prevalence and phenotype analyses, used all 1702 records.
Table 1-
Data-quality audit: number of records at the lower and upper recording bounds of each continuous variable (n = 1702).
| Variable | Lower bound | n (%) at bound | Mean of 5 adjacent values | Upper bound | n (%) at bound | Mean of 5 adjacent values |
|---|---|---|---|---|---|---|
| HbA1c (%) | 4 | 182 (10.7) | 14.0 | 15 | 26 (1.5) | 2.0 |
| Total cholesterol (mg/dL) | 60 | 150 (8.8) | 3.2 | 450 | 6 (0.4) | 1.0 |
| LDL cholesterol (mg/dL) | 20 | 94 (5.5) | 3.2 | 350 | 4 (0.2) | 1.2 |
| Creatinine (mg/dL) | 0.3 | 45 (2.6) | 7.6 | 15 | 21 (1.2) | 1.0 |
| eGFR (mL/min/1.73 m2) | 3 | 31 (1.8) | 1.2 | 150 | 23 (1.4) | 1.0 |
| GRACE score | 40 | 73 (4.3) | 4.2 | 320 | 3 (0.2) | 1.0 |
| Heart rate (beats/min) | 30 | 54 (3.2) | 7.6 | 180 | 5 (0.3) | 1.4 |
| BMI (kg/m2) | 14 | 32 (1.9) | 2.2 | 47.7 | 1 (0.1) | 1.0 |
| Registry glucose (mg/dL) | 71 | 1 (0.1) | 1.2 | 800 | 13 (0.8) | 1.0 |
| Systolic blood pressure (mmHg) | 70 | 1 (0.1) | 1.2 | 237 | 1 (0.1) | 2.0 |
| LV ejection fraction (%) | 20 | 1 (0.1) | 5.8 | 74 | 1 (0.1) | 4.0 |
For each variable, the number of records at exactly the minimum and maximum observed value is compared with the mean number at each of the five distinct values immediately inside that bound. HbA1c, total cholesterol, LDL cholesterol, creatinine (and derived eGFR), GRACE score, heart rate and BMI show marked excess at the lower bound; registry glucose, systolic blood pressure and LVEF do not. Records with HbA1c at either bound (n = 208) were excluded from the primary glycaemic analyses and handled by three alternative approaches in sensitivity analyses (Supplementary Table S2); records at the bounds of the other affected variables were examined in Supplementary Table S1 and Table 6. Of the boundary values, 94/98 (LDL), 143/156 (total cholesterol), 64/66 (creatinine) and 73/76 (GRACE) occurred in SMuRF-positive patients.
6. Statistical analysis
Proportions are given with Wilson 95% confidence intervals (CIs). Continuous variables are presented as median (interquartile range [IQR]) and compared with the Mann–Whitney U test (two groups) or Kruskal–Wallis test (three groups). Categorical variables are presented as n (%) and compared with the chi-squared test or, when expected counts were small, Fisher's exact test. Equality of variance was tested with the Levene test. eGFR was calculated with the 2021 CKD-EPI creatinine equation [20].
We estimated differences between patients with and without a documented SMuRF using linear or logistic regression, adjusted for age and sex. In the tables, we show variables that form part of the SMuRF definition, or are directly linked to it (blood pressure, lipids, HbA1c, and glucose), separately from variables not part of the classification, because differences in the former are expected by construction. To reconcile the median and mean comparisons of SHR, we also estimated adjusted differences in percentiles by quantile regression.
SHR was entered into logistic regression for each binary endpoint, per one SD and by tertile, in three nested models: unadjusted; Model 1, adjusted for age, sex, STEMI presentation, diabetes and eGFR; and Model 2, additionally adjusted for hypertension, dyslipidaemia, current smoking, BMI, LDL cholesterol and previous heart failure. In the original submission, Model 2 also included the GRACE score. We removed it because Killip class is a component of the GRACE score, so its inclusion in models with a Killip endpoint is circular, and because age, heart rate, systolic pressure and creatinine—also GRACE components—were either entered separately or affected by recording-bound heaping. The Model 2 covariates were chosen as pre-admission patient characteristics that could confound the association between SHR and severity, and none is measured from the index-event haemodynamics. Collinearity was checked with variance inflation factors.
Because there were only 46 deaths in the analytic cohort, all mortality models used Firth penalised likelihood with profile penalised-likelihood CIs and penalised likelihood-ratio tests [21]. Model 1 had about 7.7 events per estimated parameter; Model 2 had about 3.8, which is below conventional thresholds. We therefore regard Model 1 as the primary adjusted mortality model and report Model 2 only as a sensitivity analysis. As a second, parsimonious sensitivity analysis, we adjusted SHR for the GRACE score alone, which is appropriate for mortality because death is not a GRACE component. The trend across tertiles was tested by entering tertile as a single ordinal term (coded 1, 2, 3) in the same model as the tertile odds ratios (ORs); for mortality, the p value is from the penalised likelihood-ratio test. As a post hoc check of non-linearity for mortality, we added a quadratic SHR term and examined SHR <1.0 as a binary exposure.
Interaction between SHR and diabetes, and between SHR and SMuRF status, was tested with a multiplicative term. The added value of SHR over absolute glucose was examined by mutual adjustment and by the area under the receiver operating characteristic curve (AUC), with 95% CIs from 1000 bootstrap samples. The GRACE score was used as a benchmark only for in-hospital death; it was not used as a comparator for the Killip endpoints, because Killip class contributes directly to the score.
Tests were two-sided with a significance level of 0.05. Secondary analyses are exploratory; no adjustment for multiplicity was made, and those p values should be read descriptively. All analyses were performed in Python 3.12 (pandas, statsmodels 0.15, scipy, scikit-learn); the Firth routine was implemented directly and checked against unpenalised maximum likelihood in non-sparse models. All tables and figures were produced by a single script from a single dataset.
7. Relationship to a companion analysis of the same registry
A companion analysis of the same registry [22] examined two clinical phenotypes of ACS (smoking-driven and metabolic) in 1582 patients. The two reports address different questions. The companion analysis does not examine SMuRF-less status, SHR, the recording-bound audit or the association of glycaemic measures with index-event severity and the present report does not examine the smoking-driven and metabolic phenotypes. The cohorts differ because the present analysis keeps only the first ACS admission per patient and requires complete documentation of all four SMuRFs. No outcome, exposure or effect estimate is reported in both papers. The companion manuscript has been disclosed to the journal.
8. Ethics
The study used de-identified registry data collected during routine care. It was approved by the Health Research Ethics Committee, Dr. Saiful Anwar General Hospital, East Java, Indonesia (approval number 400/246/K.3/102.7/2026, issued in August 2026), which waived the requirement for individual informed consent. The study was conducted in accordance with the Declaration of Helsinki.
Results
1. Cohort
The cohort comprised 1702 first ACS admissions (Figure 1). Median age was 60 (52–66) years and 1266 patients (74.4%) were men. The presentation was STEMI in 941 (55.3%), NSTEMI in 441 (25.9%) and unstable angina in 320 (18.8%). Femoral access was used in 85.3%. In-hospital death occurred in 53 patients (3.1%); Killip class III–IV was recorded in 21.5% and LVEF <40% in 21.8%. The median number of vessels treated was 2 (1–3): 1 vessel in 600 patients (35.3%), 2 in 477 (28.0%), 3 in 369 (21.7%) and 4 or 5 in 256 (15.0%). Multivessel PCI (2 or more vessels treated) was performed in 1102 patients (64.7%). The registry's separate ‘multivessel’ field (70.4%) disagreed with the vessel count in 356 records and probably captures angiographic multivessel disease in some; we therefore use the derived definition.
2. Data-quality audit
Eight variables showed clear heaping at the lower recording bound (Table 1, Figure 2). The most severe was HbA1c: 182 records (10.7%) had exactly 4.0%, compared with a mean of 14.0 records at each of the 5 values immediately above it, and a further 26 had exactly 15.0%. Total cholesterol was recorded as exactly 60 mg/dL in 150 records (adjacent-value mean 3.2), LDL cholesterol as 20 mg/dL in 94 (3.2), GRACE score as 40 in 73 (4.2), heart rate as 30 beats/min in 54 (7.6), creatinine as 0.3 mg/dL in 45 (7.6) and BMI as 14 kg/m2 in 32 (2.2); eGFR, derived from creatinine, showed the corresponding excess at both bounds. Registry glucose, systolic blood pressure and LVEF showed no such excess.
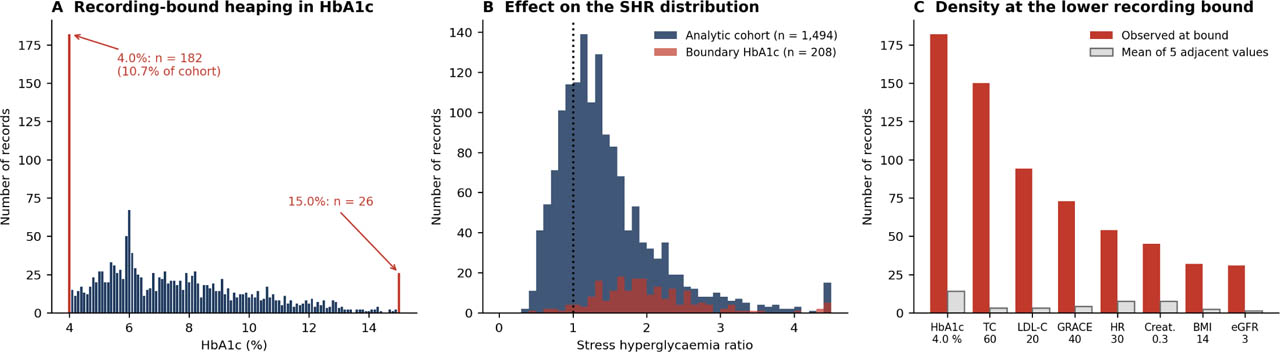
Figure 2-
Data-quality audit. (A) Distribution of recorded HbA1c, with values at the lower (4.0%) and upper (15.0%) recording bounds highlighted. (B) Distribution of the SHR in the analytic cohort and in the excluded boundary-HbA1c records, showing the inflation produced by a truncated denominator. (C) Number of records at the lower recording bound of eight variables compared with the mean number at the five adjacent values. BMI, body mass index; eFGR, estimated glomerular filtration rate; SHR, stress hyperglycaemia ratio; SMuRF, standard modifiable cardiovascular risk factor.
An HbA1c of 4.0% corresponds to an estimated average glucose of 68.1 mg/dL, so any glucose value above that gives an SHR above 1.0. The median SHR was 1.90 (1.53–2.35) in the 208 boundary records and 1.29 (0.98–1.69) in the others. Only 16.5% of patients with HbA1c of 4.0% had documented diabetes, whereas all 26 with 15.0% did. Apart from diabetes (26.9% vs 64.1%, p < 0.001), the boundary records were similar to the retained records in age (mean 58.1 years vs 59.5 years, p = 0.054), sex (75.0% vs 74.3% men), STEMI presentation (54.3% vs 55.4%), Killip class III–IV (22.6% vs 21.4%), LVEF <40% (24.0% vs 21.5%) and in-hospital death (3.4% vs 3.1%). None of the boundary records were from a patient without a documented SMuRF; 206 of the 208 were from the period before April 2026, when no such patient was recorded (Section Definition and ascertainment of SMuRF status).
3. Prevalence of ACS without a documented SMuRF
Overall, 204 of 1702 patients (12.0%; 95% CI 10.5–13.6) had no documented SMuRF. One SMuRF was recorded in 253 patients (14.9%), 2 in 464 (27.3%), 3 in 543 (31.9%) and 4 in 238 (14.0%). This overall figure should be read together with the capture period: the proportion was 0% (0/1473) before April 2026 and 89.1% (204/229) from April 2026 to July 2026.
The proportion increased with age, from 4.2% (6/143) below 45 years to 23.2% (23/99) at 75 years or older (p for trend < 0.001; Figure 3A). After adjustment for sex and presentation type, the odds of having no documented SMuRF increased by 39% per decade of age (OR 1.39, 95% CI 1.20–1.62; p < 0.001). The proportion was numerically higher in women (14.0% vs 11.3%), but not significantly after adjustment (OR for male sex 0.78, 0.57–1.08; p = 0.141). It was 15.9% in unstable angina, 11.8% in NSTEMI and 10.7% in STEMI (p = 0.046).
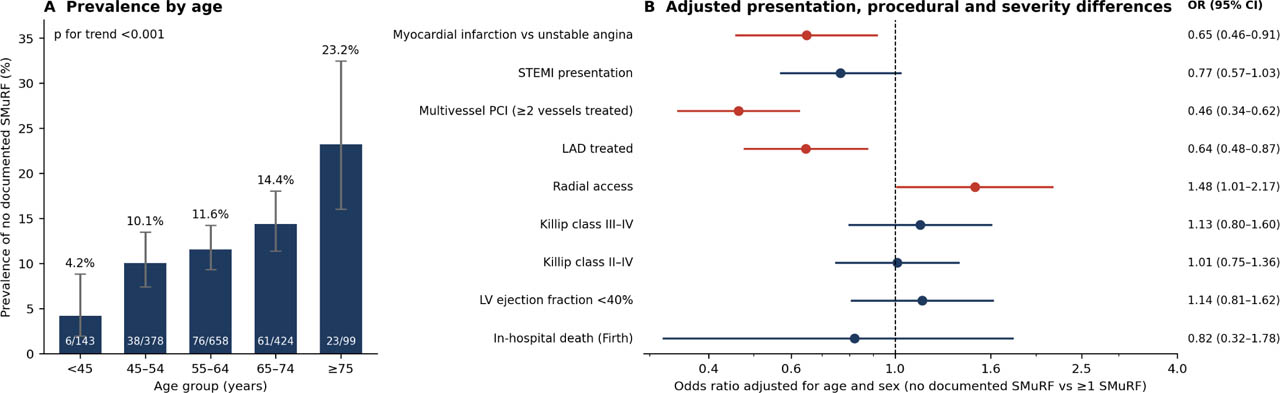
Figure 3-
ACS without a documented SMuRF. (A) Proportion by age group with Wilson 95% CIs; the number of patients without a documented SMuRF and the group size are shown in each bar. (B) ORs comparing patients without and with a documented SMuRF, adjusted for age and sex (the in-hospital death model is Firth-penalised and additionally adjusted for STEMI). Red markers denote intervals excluding 1. Multivessel PCI is defined as two or more vessels treated. ACS, acute coronary syndrome; CI, confidence intervals; LAD, left anterior descending artery; OR, odds ratio; PCI, percutaneous coronary intervention; SMuRFs, standard modifiable cardiovascular risk factors; STEMI, ST-elevation myocardial infarction.
Estimates under the alternative definitions are shown in Table 2. Adding measured LDL cholesterol ≥130 mg/dL reduced the estimate to 10.1%. Adding HbA1c ≥6.5% did not change it, because all patients without documented diabetes had HbA1c below 6.5%. Adding admission systolic pressure ≥140 mmHg reduced it to 9.4%. Replacing current smoking with ever-smoking reduced it to 3.8%, reflecting the high lifetime smoking exposure in this mainly male cohort (73.9% ever-smokers). With all four broadenings, the estimate was 2.6%.
Table 2-
Proportion of patients without a documented SMuRF under the primary and five pre-specified alternative definitions (n = 1702).
| Definition | n/N | Proportion, % (95% CI) |
|---|---|---|
| Primary definition (no documented history of any of the four SMuRFs) | 204/1702 | 12.0 (10.5–13.6) |
| Hypercholesterolaemia broadened to history or LDL-C ≥130 mg/dL | 172/1702 | 10.1 (8.8–11.6) |
| Diabetes broadened to history or HbA1c ≥6.5% | 204/1702 | 12.0 (10.5–13.6) |
| Hypertension broadened to history or admission SBP ≥140 mmHga | 160/1702 | 9.4 (8.1–10.9) |
| Ever-smoking substituted for current smoking | 64/1702 | 3.8 (3.0–4.8) |
| All four broadenings applied together | 45/1702 | 2.6 (2.0–3.5) |
4. Clinical profile of patients without a documented SMuRF
Baseline characteristics are shown in Table 3 and adjusted differences in Table 4 and Figure 3B. As expected from the definition, patients without a documented SMuRF had lower systolic blood pressure (adjusted difference −20.2 mmHg, −23.6 to −16.7), LDL cholesterol (−38.2 mg/dL, −47.6 to −28.9), total cholesterol (−35.4 mg/dL, −46.9 to −24.0) and HbA1c (−2.23%, −2.57 to −1.90). These differences largely follow from the classification and do not by themselves show a distinct biological phenotype.
Table 3-
Baseline characteristics, presentation, markers of index-event severity and in-hospital death of patients with ACS, by documented SMuRF status.
| Variable | n | Overall | ≥1 SMuRF | No documented SMuRF | p |
|---|---|---|---|---|---|
| Demographics and medical history (not part of the SMuRF definition) | |||||
| Age (years) | 1702 | 60 (52–66) | 60 (52–66) | 62 (55–69) | <0.001 |
| Male sex | 1702 | 1266 (74.4) | 1123 (75.0) | 143 (70.1) | 0.159 |
| BMI (kg/m2) | 1702 | 24.5 (21.2–28.3) | 24.9 (21.0–28.8) | 23.4 (21.7–25.6) | <0.001 |
| Ever smoking | 1702 | 1258 (73.9) | 1118 (74.6) | 140 (68.6) | 0.081 |
| Family history of premature CVD | 1702 | 242 (14.2) | 209 (14.0) | 33 (16.2) | 0.455 |
| Previous myocardial infarction | 1702 | 43 (2.5) | 38 (2.5) | 5 (2.5) | 1.000 |
| Previous PCI | 1702 | 181 (10.6) | 156 (10.4) | 25 (12.3) | 0.497 |
| Previous heart failure | 1702 | 294 (17.3) | 253 (16.9) | 41 (20.1) | 0.299 |
| Cerebrovascular disease | 1702 | 34 (2.0) | 33 (2.2) | 1 (0.5) | 0.114 |
| Chronic kidney disease | 1702 | 31 (1.8) | 28 (1.9) | 3 (1.5) | 1.000 |
| Documented SMuRFs (defining variables) | |||||
| Hypertension | 1702 | 1093 (64.2) | 1093 (73.0) | 0 (0.0) | <0.001 |
| Diabetes mellitus | 1702 | 1013 (59.5) | 1013 (67.6) | 0 (0.0) | <0.001 |
| Dyslipidaemia | 1702 | 946 (55.6) | 946 (63.2) | 0 (0.0) | <0.001 |
| Current smoking | 1702 | 710 (41.7) | 710 (47.4) | 0 (0.0) | <0.001 |
| Measurements linked to the SMuRF definition (differences expected by construction) | |||||
| Systolic blood pressure (mmHg) | 1702 | 140 (125–158) | 143 (128–160) | 125 (112–137) | <0.001 |
| Diastolic blood pressure (mmHg) | 1702 | 89 (81–99) | 90 (83–100) | 76 (68–84) | <0.001 |
| Total cholesterol (mg/dL) | 1702 | 162 (110–218) | 168 (112–224) | 142 (106–173) | <0.001 |
| LDL cholesterol (mg/dL) | 1702 | 116 (71–165) | 124 (76–171) | 80 (60–110) | <0.001 |
| HbA1c (%)a | 1494 | 7.2 (5.8–9.1) | 7.7 (6.1–9.5) | 5.9 (5.5–6.0) | <0.001 |
| Registry glucose (mg/dL)a | 1494 | 187 (145–289) | 204 (151–310) | 150 (126–170) | <0.001 |
| Other measurements | |||||
| SHRa | 1494 | 1.29 (0.98–1.69) | 1.30 (0.94–1.79) | 1.27 (1.13–1.43) | 0.731 |
| Heart rate (beats/min) | 1702 | 82 (63–100) | 82 (63–102) | 80 (66–93) | 0.067 |
| Creatinine (mg/dL) | 1702 | 1.1 (0.8–1.4) | 1.1 (0.8–1.4) | 1.0 (0.8–1.3) | 0.577 |
| eGFR (mL/min/1.73 m2) | 1702 | 78 (54–99) | 78 (54–99) | 75 (53–96) | 0.467 |
| GRACE risk score | 1702 | 134 (95–173) | 136 (96–176) | 126 (95–156) | 0.035 |
| Presentation and markers of index-event severity | |||||
| STEMI presentation | 1702 | 941 (55.3) | 840 (56.1) | 101 (49.5) | 0.090 |
| Myocardial infarction (STEMI or NSTEMI) | 1702 | 1382 (81.2) | 1229 (82.0) | 153 (75.0) | 0.020 |
| Killip class III–IV | 1702 | 366 (21.5) | 318 (21.2) | 48 (23.5) | 0.509 |
| Killip class II–IV | 1702 | 681 (40.0) | 599 (40.0) | 82 (40.2) | 1.000 |
| LV ejection fraction (%) | 1702 | 52 (48–56) | 52 (48–56) | 52 (48–56) | 0.978 |
| LV ejection fraction <40% | 1702 | 371 (21.8) | 322 (21.5) | 49 (24.0) | 0.466 |
| Procedure | |||||
| Vessels treated, n | 1702 | 2 (1–3) | 2 (1–3) | 1 (1–3) | 0.002 |
| LAD treated | 1702 | 1144 (67.2) | 1025 (68.4) | 119 (58.3) | 0.005 |
| Left main treated | 1702 | 82 (4.8) | 72 (4.8) | 10 (4.9) | 1.000 |
| Multivessel PCI (≥2 vessels treated)b | 1702 | 1102 (64.7) | 1004 (67.0) | 98 (48.0) | <0.001 |
| Registry ‘multivessel’ fieldb | 1702 | 1198 (70.4) | 1079 (72.0) | 119 (58.3) | <0.001 |
| Radial access | 1702 | 250 (14.7) | 211 (14.1) | 39 (19.1) | 0.072 |
| Discharge medication and in-hospital outcome | |||||
| Statin at dischargec | 1649 | 1647 (99.9) | 1449 (99.9) | 198 (100.0) | 1.000 |
| P2Y12 inhibitor at dischargec | 1649 | 1641 (99.5) | 1443 (99.4) | 198 (100.0) | 0.607 |
| Aspirin at dischargec | 1649 | 1629 (98.8) | 1432 (98.7) | 197 (99.5) | 0.499 |
| In-hospital all-cause death | 1702 | 53 (3.1) | 47 (3.1) | 6 (2.9) | 1.000 |
ACS, acute coronary syndrome; CVD, cardiovascular disease; eGFR, estimated glomerular filtration rate; IQR, interquartile range; LAD, left anterior descending artery; LDL, low-density lipoprotein; LV, left ventricular; NSTEMI, non-ST-elevation myocardial infarction, PCI, percutaneous coronary intervention; SMuRF, standard modifiable cardiovascular risk factor; STEMI, ST-elevation myocardial infarction.
Continuous variables are median (IQR); categorical variables are n (%). The n column gives the number of records contributing to that row.
a Calculated in the analytic cohort of 1494 patients (≥1 SMuRF n = 1290; no documented SMuRF n = 204) after exclusion of boundary-recorded HbA1c; all other rows use all 1702 records (≥1 SMuRF n = 1498; no documented SMuRF n = 204).
Table 4-
Adjusted differences between patients without and with a documented SMuRF.
| Characteristic | Effect measure | Estimate (95% CI) | p | n |
|---|---|---|---|---|
| Measurements linked to the SMuRF definition (differences expected by construction) | ||||
| Systolic blood pressure (mmHg) | Adjusted mean difference | −20.18 (−23.62 to −16.74) | <0.001 | 1702 |
| Diastolic blood pressure (mmHg) | Adjusted mean difference | −15.69 (−17.65 to −13.74) | <0.001 | 1702 |
| Total cholesterol (mg/dL) | Adjusted mean difference | −35.43 (−46.87 to −23.99) | <0.001 | 1702 |
| LDL cholesterol (mg/dL) | Adjusted mean difference | −38.25 (−47.55 to −28.94) | <0.001 | 1702 |
| HbA1c (%)a | Adjusted mean difference | −2.23 (−2.57 to −1.90) | <0.001 | 1494 |
| Registry glucose (mg/dL)a | Adjusted mean difference | −98.55 (−118.63 to −78.47) | <0.001 | 1494 |
| Variables not part of the SMuRF definition | ||||
| Age (years) | Adjusted mean difference | +3.29 (1.81–4.78) | <0.001 | 1702 |
| BMI (kg/m2) | Adjusted mean difference | −1.55 (−2.39 to −0.70) | <0.001 | 1702 |
| Heart rate (beats/min) | Adjusted mean difference | −4.89 (−9.12 to −0.66) | 0.023 | 1702 |
| Creatinine (mg/dL) | Adjusted mean difference | −0.38 (−0.67 to −0.10) | 0.009 | 1702 |
| eGFR (mL/min/1.73 m2) | Adjusted mean difference | +3.69 (−0.53 to 7.92) | 0.087 | 1702 |
| GRACE risk score | Adjusted mean difference | −18.66 (−25.46 to −11.87) | <0.001 | 1702 |
| SHR (mean)a,b | Adjusted mean difference | −0.17 (−0.28 to −0.06) | 0.003 | 1494 |
| LV ejection fraction (%) | Adjusted mean difference | −0.31 (−1.93 to 1.30) | 0.705 | 1702 |
| Vessels treated, n | Adjusted mean difference | −0.21 (−0.38 to −0.04) | 0.017 | 1702 |
| STEMI presentation | aOR | 0.77 (0.57–1.03) | 0.075 | 1702 |
| Myocardial infarction versus unstable angina | aOR | 0.65 (0.46–0.91) | 0.014 | 1702 |
| Killip class III–IV | aOR | 1.13 (0.80–1.60) | 0.489 | 1702 |
| Killip class II–IV | aOR | 1.01 (0.75–1.36) | 0.946 | 1702 |
| LV ejection fraction <40% | aOR | 1.14 (0.81–1.62) | 0.450 | 1702 |
| LAD treated | aOR | 0.64 (0.48–0.87) | 0.004 | 1702 |
| Left main treated | aOR | 1.12 (0.57–2.22) | 0.745 | 1702 |
| Multivessel PCI (≥2 vessels treated) | aOR | 0.46 (0.34–0.62) | <0.001 | 1702 |
| Radial access | aOR | 1.48 (1.01–2.17) | 0.044 | 1702 |
| In-hospital all-cause death | aOR (Firth) | 0.82 (0.32–1.78) | 0.637 | 1702 |
aOR, adjusted odds ratio; eFGR, estimated glomerular filtration rate; LAD, left anterior descending artery; LDL, low-density lipoprotein; LV, left ventricular; PCI, percutaneous coronary intervention; SHR, stress hyperglycaemia ratio; SMuRFs, standard modifiable cardiovascular risk factors; STEMI, ST-elevation myocardial infarction.
All estimates compare patients without a documented SMuRF with those with ≥1 SMuRF and are adjusted for age (except the model for age) and sex.
b Difference in means; the adjusted difference in medians was −0.03 (−0.13 to 0.06; p = 0.473)—see Supplementary Table S3. The in-hospital death model uses Firth penalised logistic regression additionally adjusted for STEMI presentation, with profile penalised-likelihood CIs (53 events). Estimates after exclusion of recording-bound values are given in Supplementary Table S1. Abbreviations as in Table 3.
Among variables that are not part of the classification, patients without a documented SMuRF were older (+3.3 years, 1.8–4.8), had a lower BMI (−1.5 kg/m2, −2.4 to −0.7), a lower heart rate (−4.9 beats/min, −9.1 to −0.7) and a lower GRACE score (−18.7 points, −25.5 to −11.9). Fewer vessels were treated (−0.21, −0.38 to −0.04), and the left anterior descending artery was treated less often (adjusted OR [aOR] 0.64, 0.48–0.87). Multivessel PCI was less frequent (0.46, 0.34–0.62). Presentation was more often with unstable angina than with myocardial infarction (OR for myocardial infarction 0.65, 0.46–0.91), and radial access was used more often (1.48, 1.01–2.17).
Excluding records at the recording bounds of each affected variable did not materially change these comparisons (for example, LDL cholesterol −43.1 mg/dL, −51.8 to −34.3; GRACE score −20.0, −26.6 to −13.3; Supplementary Table S1). Boundary values occurred almost only in SMuRF-positive patients (e.g., 94 of 98 boundary LDL values).
Markers of index-event severity did not differ significantly. Killip class III–IV was recorded in 23.5% of patients without and 21.2% of patients with a documented SMuRF (aOR 1.13, 0.80–1.60; p = 0.489), Killip class II–IV in 40.2% and 40.0% (1.01, 0.75–1.36; p = 0.946), and LVEF <40% in 24.0% and 21.5% (1.14, 0.81–1.62; p = 0.450). Mean LVEF was similar (adjusted difference −0.3% points, −1.9 to 1.3). In-hospital death occurred in 6 of 204 (2.9%) and 47 of 1498 (3.1%) patients (Firth-aOR 0.82, 0.32–1.78; p = 0.637). With 53 deaths, this comparison cannot exclude a moderate difference in either direction, and the absence of a detected difference should not be read as equivalence.
Distribution of the SHR
In the analytic cohort (n = 1494), median SHR was 1.29 (0.98–1.69) (mean 1.45, SD 0.76). SHR was above 1.0 in 1089 patients (72.9%), above 1.5 in 34.3% and above 2.0 in 16.0% (Figure 4A). The tertile boundaries were 1.09 and 1.52 (tertile 1 ≤ 1.09, n = 509; tertile 2 1.10–1.52, n = 492; tertile 3 ≥ 1.53, n = 493). SHR correlated with registry glucose (Spearman ρ 0.61) and inversely with HbA1c (ρ − 0.31). Mean SHR was similar in patients with and without diabetes (1.45 ± 0.77 vs 1.46 ± 0.73; p = 0.081). Characteristics by tertile are shown in Table 5. Patients in tertile 1 more often had diabetes (71.7% vs 60.1% in tertiles 2–3) and had a higher median HbA1c (8.2% vs 6.3%).
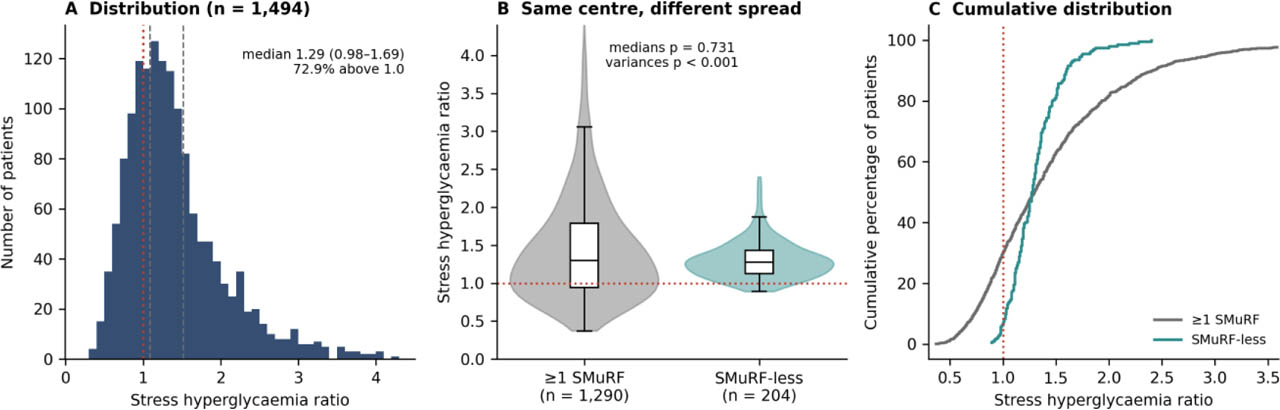
Figure 4-
Distribution of the SHR. (A) Distribution in the analytic cohort; the dotted line marks an SHR of 1.0 and the dashed lines the tertile boundaries. (B) SHR by SMuRF status (violin plots with box plots); the medians are similar (p = 0.731) but the variances differ (p < 0.001), so the means differ. (C) Cumulative distributions for the two groups, which cross close to the median: patients without a documented SMuRF are more likely to exceed an SHR of 1.0 and much less likely to have high values. SHR, stress hyperglycaemia ratio; SMuRFs, standard modifiable cardiovascular risk factors.
Table 5-
Characteristics of the analytic cohort by tertile of the SHR (n = 1494).
| Variable | Tertile 1 (≤1.09) n = 509 | Tertile 2 (1.10–1.52) n = 492 | Tertile 3 (≥1.53) n = 493 | p |
|---|---|---|---|---|
| Age (years) | 60 (53–66) | 60 (52–67) | 61 (53–67) | 0.542 |
| Male sex | 375 (73.7) | 366 (74.4) | 369 (74.8) | 0.912 |
| BMI (kg/m2) | 24.5 (21.2–28.3) | 24.5 (21.3–28.3) | 24.5 (21.2–28.3) | 0.981 |
| Systolic blood pressure (mmHg) | 140 (125–156) | 140 (124–155) | 141 (126–159) | 0.169 |
| Registry glucose (mg/dL) | 154 (125–191) | 173 (145–245) | 310 (216–454) | <0.001 |
| HbA1c (%) | 8.2 (7.0–10.1) | 6.2 (5.6–8.2) | 6.6 (5.2–8.6) | <0.001 |
| SHR | 0.88 (0.73–0.99) | 1.30 (1.19–1.39) | 1.99 (1.71–2.45) | <0.001 |
| eGFR (mL/min/1.73 m2) | 78 (54–98) | 75 (54–98) | 78 (51–98) | 0.958 |
| LDL cholesterol (mg/dL) | 120 (68–167) | 107 (71–153) | 117 (75–170) | 0.069 |
| Hypertension | 356 (69.9) | 242 (49.2) | 347 (70.4) | <0.001 |
| Diabetes mellitus | 365 (71.7) | 262 (53.3) | 330 (66.9) | <0.001 |
| Dyslipidaemia | 290 (57.0) | 228 (46.3) | 297 (60.2) | <0.001 |
| Current smoking | 216 (42.4) | 173 (35.2) | 218 (44.2) | 0.009 |
| No documented SMuRF | 36 (7.1) | 139 (28.3) | 29 (5.9) | <0.001 |
| Previous heart failure | 103 (20.2) | 69 (14.0) | 85 (17.2) | 0.034 |
| STEMI presentation | 279 (54.8) | 277 (56.3) | 272 (55.2) | 0.886 |
| Myocardial infarction (STEMI or NSTEMI) | 410 (80.6) | 401 (81.5) | 404 (81.9) | 0.845 |
| GRACE risk score | 138 (101–178) | 127 (90–168) | 143 (98–175) | 0.005 |
| Killip class III–IV | 112 (22.0) | 100 (20.3) | 107 (21.7) | 0.789 |
| Killip class II–IV | 219 (43.0) | 187 (38.0) | 196 (39.8) | 0.258 |
| LV ejection fraction (%) | 52 (48–56) | 52 (48–56) | 52 (48–56) | 0.410 |
| LV ejection fraction <40% | 108 (21.2) | 105 (21.3) | 108 (21.9) | 0.961 |
| Vessels treated, n | 2 (1–3) | 2 (1–3) | 2 (1–3) | 0.956 |
| LAD treated | 342 (67.2) | 327 (66.5) | 340 (69.0) | 0.689 |
| Multivessel PCI (≥2 vessels treated) | 330 (64.8) | 314 (63.8) | 325 (65.9) | 0.788 |
| In-hospital all-cause death | 23 (4.5) | 11 (2.2) | 12 (2.4) | 0.067 |
[i] BMI, body mass index; eFGR, estimated glomerular filtration rate; IQR, interquartile range; LAD, left anterior descending artery; LDL, low-density lipoprotein; LV, left ventricular; NSTEMI, non-ST-elevation myocardial infarction; PCI, percutaneous coronary intervention; SHR, stress hyperglycaemia ratio; SMuRFs, standard modifiable cardiovascular risk factors; STEMI, ST-elevation myocardial infarction.
Median (IQR) or n (%). p values from the Kruskal–Wallis test (continuous) or chi-squared test (categorical). Tertiles are sample tertiles of the registry SHR (recorded to two decimals). Abbreviations as in Table 3.
5. SHR, index-event severity and in-hospital death
Event rates across ascending SHR tertiles were 22.0%, 20.3% and 21.7% for Killip class III–IV; 43.0%, 38.0% and 39.8% for Killip class II–IV; 21.2%, 21.3% and 21.9% for LVEF <40%; and 4.5%, 2.2% and 2.4% for in-hospital death (Figure 5A).
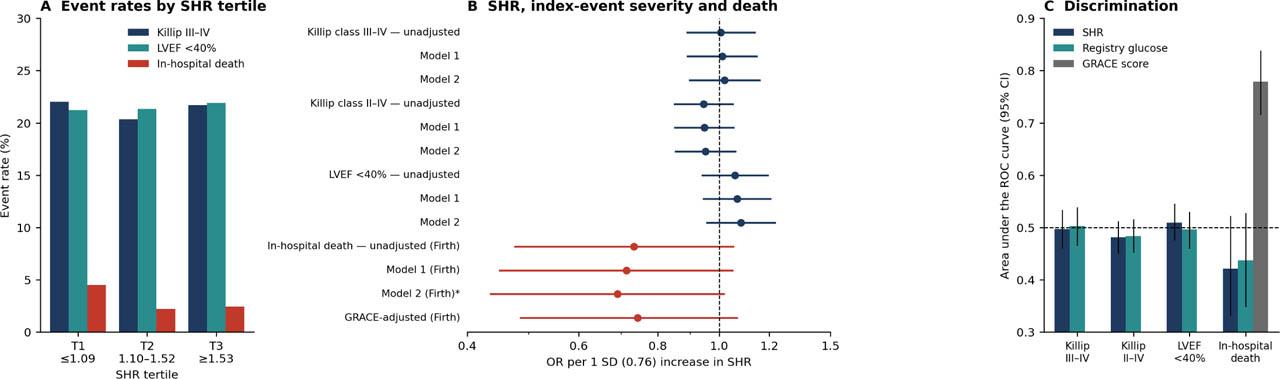
Figure 5-
SHR, markers of index-event severity and in-hospital death. (A) Event rates across SHR tertiles. (B) ORs per 1 SD increase in SHR: unadjusted, Model 1 and Model 2 (without the GRACE score) for each severity marker, and Firth-penalised unadjusted, Model 1, Model 2 (sensitivity) and GRACE-adjusted estimates for in-hospital death. (C) Area under the ROC curve with bootstrap 95% CIs for SHR and registry glucose; the GRACE score is shown only for in-hospital death, because Killip class is a component of the score. The dashed line marks chance discrimination. ORs, odds ratios; SD, standard deviation; SHR, stress hyperglycaemia ratio.
SHR was not associated with any marker of index-event severity (Table 6, Figure 5B). Per SD increase in SHR, the unadjusted OR was 1.01 (0.89–1.14) for Killip class III–IV, 0.95 (0.85–1.05) for Killip class II–IV and 1.06 (0.94–1.19) for LVEF <40%. The revised Model 2, without the GRACE score, gave 1.02 (0.90–1.16), 0.95 (0.85–1.06) and 1.08 (0.96–1.23), respectively (all p > 0.20). All VIFs in Model 2 were below 1.5. Excluding records with boundary covariate values (n = 1314) gave the same results. In tertile analyses no tertile OR differed from 1 and no trend was significant for Killip class III–IV (p = 0.863), Killip class II–IV (p = 0.264) or LVEF <40% (p = 0.835).
Table 6-
Association of the SHR with markers of index-event severity and in-hospital death (analytic cohort, n = 1494).
| Endpoint | Events/n | Model | OR per 1 SD of SHR (95% CI) | p |
|---|---|---|---|---|
| Killip class III–IV | 319/1494 | Unadjusted | 1.01 (0.89–1.14) | 0.918 |
| Model 1a | 1.01 (0.89–1.15) | 0.866 | ||
| Model 2b | 1.02 (0.90–1.16) | 0.757 | ||
| Model 2, boundary covariates excludedc | 1.01 (0.89–1.16) | 0.848 | ||
| Killip class II–IV | 602/1494 | Unadjusted | 0.95 (0.85–1.05) | 0.295 |
| Model 1a | 0.95 (0.85–1.05) | 0.317 | ||
| Model 2b | 0.95 (0.85–1.06) | 0.370 | ||
| Model 2, boundary covariates excludedc | 0.95 (0.85–1.06) | 0.379 | ||
| LV ejection fraction <40% | 321/1494 | Unadjusted | 1.06 (0.94–1.19) | 0.341 |
| Model 1a | 1.07 (0.95–1.20) | 0.292 | ||
| Model 2b | 1.08 (0.96–1.23) | 0.208 | ||
| Model 2, boundary covariates excludedc | 1.09 (0.96–1.24) | 0.199 | ||
| In-hospital all-cause death | 46/1494 | Unadjusted (Firth)d | 0.73 (0.48–1.05) | 0.098 |
| Model 1 (Firth)d | 0.71 (0.45–1.05) | 0.092 | ||
| Model 2 (Firth), sensitivityd,e | 0.69 (0.44–1.02) | 0.062 | ||
| GRACE-adjusted (Firth)d,f | 0.74 (0.49–1.07) | 0.114 |
CI, confidence interval; LV, left ventricular; OR, odds ratio; SD, standard deviation; SHR, stress hyperglycaemia ratio; VIF, variance inflation factor.
b Model 2: Model 1 plus hypertension, dyslipidaemia, current smoking, BMI, LDL cholesterol and previous heart failure. The GRACE score, included in the original Model 2, was removed because Killip class is one of its components. Maximum VIF 1.42.
d Firth penalised logistic regression with profile penalised-likelihood CIs and penalised likelihood-ratio p values.
Table 6-
(continued). Tertile analysis of the same endpoints
| Endpoint | Model | Tertile 1 (≤1.09) | Tertile 2 (1.10–1.52) | Tertile 3 (≥1.53) | p for trend |
|---|---|---|---|---|---|
| Killip class III–IV | Model 1 | 1 (reference) | 0.88 (0.65–1.20) | 0.97 (0.72–1.32) | 0.863 |
| Model 2 | 1 (reference) | 0.94 (0.68–1.29) | 1.01 (0.74–1.37) | 0.975 | |
| Killip class II–IV | Model 1 | 1 (reference) | 0.79 (0.61–1.02) | 0.87 (0.67–1.12) | 0.264 |
| Model 2 | 1 (reference) | 0.84 (0.65–1.10) | 0.89 (0.68–1.15) | 0.355 | |
| LV ejection fraction <40% | Model 1 | 1 (reference) | 0.98 (0.72–1.34) | 1.03 (0.76–1.40) | 0.835 |
| Model 2 | 1 (reference) | 1.10 (0.80–1.51) | 1.08 (0.79–1.48) | 0.623 | |
| In-hospital all-cause death (Firth) | Unadjusted | 1 (reference) | 0.49 (0.23–0.99) | 0.54 (0.26–1.06) | 0.055 |
| Model 1 | 1 (reference) | 0.41 (0.19–0.83) | 0.50 (0.24–0.99) | 0.032 | |
| Model 2 (sensitivity) | 1 (reference) | 0.40 (0.18–0.84) | 0.48 (0.23–0.96) | 0.026 |
ORs versus tertile 1. p for trend: tertile entered as a single ordinal term (1, 2, 3) in the same model (Wald test for logistic models; penalised likelihood-ratio test for Firth models). In-hospital deaths: 23/509 (4.5%), 11/492 (2.2%) and 12/493 (2.4%). The mortality tertile estimates in the original submission were reported incorrectly; the values shown are corrected. These estimates rest on 46 deaths and are exploratory. Models as in Table 6.
For in-hospital death, the continuous estimates were inverse and not significant: OR per SD 0.73 (0.48–1.05) unadjusted, 0.71 (0.45–1.05) in Model 1, 0.69 (0.44–1.02) in Model 2 (sensitivity analysis; about 3.8 events per parameter) and 0.74 (0.49–1.07) after adjustment for the GRACE score. In the tertile analysis, however, mortality was highest in tertile 1. Compared with tertile 1, the Model 1 OR was 0.41 (0.19–0.83) for tertile 2 and 0.50 (0.24–0.99) for tertile 3 (p for trend 0.032). Unadjusted, the trend was not significant (p = 0.055). In post hoc analyses, SHR <1.0 was associated with higher mortality (18 of 394 [4.6%] vs 28 of 1100 [2.5%]; Model 1 OR 2.25, 1.20–4.14), whereas a quadratic term was not significant (p = 0.17). These findings rest on 46 deaths and are exploratory. The mortality tertile ORs in the original submission were reported incorrectly and have been corrected.
Mutual adjustment did not favour either glycaemic measure: for Killip class III–IV, the OR was 0.96 (0.81–1.15) per SD of SHR and 1.01 (0.99–1.02) per 10 mg/dL of registry glucose; for LVEF <40%, 1.11 (0.94–1.32) and 1.00 (0.98–1.01). Discrimination was close to chance for both measures: AUC 0.48–0.51 for SHR and 0.48–0.50 for glucose for the three severity markers (Figure 5C). For in-hospital death the AUC was 0.42 (0.33–0.52) for SHR and 0.44 (0.35–0.53) for glucose, compared with 0.78 (0.72–0.84) for the GRACE score. Interaction between SHR and diabetes was not significant for any severity marker (p = 0.278, 0.475 and 0.467), nor was interaction with SMuRF status (p = 0.875, 0.549 and 0.686).
The four approaches to boundary HbA1c values gave similar results (Supplementary Table S2): per SD of SHR in Model 1, the OR for Killip class III–IV ranged from 1.01 to 1.04, for LVEF <40% from 1.06 to 1.09 and for in-hospital death from 0.69 to 0.85, all with CIs including 1.
6. SHR in patients with and without a documented SMuRF
In the analytic cohort, the 204 patients without a documented SMuRF had lower HbA1c (median 5.9% [5.5–6.0] vs 7.7% [6.1–9.5]; p < 0.001) and lower registry glucose (150 [126–170] vs 204 [151–310] mg/dL; p < 0.001) (Table 7).
Table 7-
Chronic and acute glycaemic measures by documented SMuRF status (analytic cohort, n = 1494).
| Glycaemic measure | ≥1 SMuRF (n = 1290) | No documented SMuRF (n = 204) | p |
|---|---|---|---|
| HbA1c (%) | 7.7 (6.1–9.5) | 5.9 (5.5–6.0) | <0.001 |
| Estimated average glucose (mg/dL) | 174 (128–226) | 123 (111–125) | <0.001 |
| Registry glucose (mg/dL) | 204 (151–310) | 150 (126–170) | <0.001 |
| SHR, median (IQR) | 1.30 (0.94–1.79) | 1.27 (1.13–1.43) | 0.731 |
| SHR (mean) | 1.48 | 1.30 | see footnote |
| SHR, SD | 0.81 | 0.25 | <0.001a |
| SHR >1.0 | 900/1290 (69.8) | 189/204 (92.6) | <0.001 |
| SHR >1.25 | 676/1290 (52.4) | 108/204 (52.9) | 0.946 |
| SHR >1.5 | 475/1290 (36.8) | 37/204 (18.1) | <0.001 |
| SHR >2.0 | 235/1290 (18.2) | 4/204 (2.0) | <0.001 |
IQR, interquartile range; SD, standard deviation; SHR, stress hyperglycaemia ratio; SMuRF, standard modifiable cardiovascular risk factor. Median (IQR) or n/N (%).
a Levene test for equality of variances. Age- and sex-adjusted differences (no documented SMuRF minus ≥1 SMuRF): mean −0.17 (−0.28 to −0.06; p = 0.003); median −0.03 (−0.13 to 0.06; p = 0.473). The lower mean reflects the absence of a long right tail in patients without a documented SMuRF rather than a shift of the whole distribution (Supplementary Table S3).
The two groups had similar median SHR (1.27 [1.13–1.43] vs 1.30 [0.94–1.79]; Mann–Whitney p = 0.731), but different distributions (Figure 4B, Supplementary Table S3). The SD was 0.25 in patients without and 0.81 in patients with a documented SMuRF (Levene p < 0.001), and the mean was lower (1.30 vs 1.48; age- and sex-adjusted difference −0.17, −0.28 to −0.06; p = 0.003). The adjusted difference in medians was −0.03 (−0.13 to 0.06; p = 0.473). SHR was higher at the 25th percentile (+0.18, 0.11–0.26) and lower at the 90th percentile (−0.80, −1.01 to −0.59) in patients without a documented SMuRF, so the lower mean reflects the long right tail in SMuRF-positive patients rather than a shift of the whole distribution. An SHR above 1.0 was more common in patients without a documented SMuRF (92.6% vs 69.8%; p < 0.001), but values above 1.5 (18.1% vs 36.8%) and above 2.0 (2.0% vs 18.2%) were less common.
Among the 405 SMuRF-positive patients whose HbA1c was below 6.5%, median SHR was 1.55 (1.24–2.11), higher than in patients without a documented SMuRF (1.27; p < 0.001). Within the group without a documented SMuRF, SHR was not associated with Killip class III–IV (aOR per SD 0.98, 0.35–2.74) or LVEF <40% (1.26, 0.47–3.35), but these estimates are imprecise. With the 208 boundary records retained, the adjusted mean difference in SHR between groups would have been −0.25 (−0.36 to −0.13) rather than −0.17 (−0.28 to −0.06), a difference caused by boundary HbA1c values in the SMuRF-positive group.
Discussion
In this Indonesian PCI registry of 1702 first ACS admissions, 12.0% of patients had no documented SMuRF. They were older and leaner, had a lower GRACE score and less extensive coronary intervention, and—as expected from the definition—lower blood pressure, lipid and glycaemic values. We found no significant difference in Killip class, LVEF or in-hospital death. SHR calculated from the registry glucose value was not associated with any marker of index-event severity. For in-hospital death, the continuous estimate was inverse and non-significant, and an exploratory tertile analysis suggested higher mortality in patients with the lowest SHR.
7. Prevalence and its interpretation
Our estimate lies within the published range: 14.9% in SWEDEHEART [1], 14.4% in an Australian PCI registry [8], 8.6% in two Singaporean cohorts [4,5] and 26.2% in a United States series [23]. However, two features limit its interpretation. First, the estimate depends strongly on the definition: it fell to 3.8% whenever-smoking replaced current smoking and to 2.6% when all four broadenings were applied (Table 2). In a population with high lifetime smoking exposure, much of what the SMuRF-less category captures is former rather than current smoking. We suggest that SMuRF-less prevalence be reported together with at least one broadened definition. Second, and more importantly, all patients without a documented SMuRF were admitted in the last 4 months of the study period, when they formed the large majority of admissions. This pattern is not biologically plausible and indicates that SMuRF status in this registry is closely linked to how, and when, records were captured. The overall 12.0% is therefore not a reliable estimate of the population prevalence, and the group comparisons may partly reflect differences in recording practice between periods.
The absence of a documented risk factor is also not the same as its confirmed absence. Patients with little previous contact with preventive care may have undiagnosed hypertension, diabetes or dyslipidaemia. In our data, adding measured LDL cholesterol or admission blood pressure reduced the estimate only modestly, and no patient without documented diabetes had an HbA1c ≥6.5%, but these measurements were taken during the acute event and cannot confirm chronic status. The age gradient we observed resembles series in which SMuRF-less patients were of similar or greater age [8] rather than younger [2]; in our setting it may reflect the high prevalence of current smoking among younger patients.
8. Clinical profile and index-event severity
Lower blood pressure, lipid and glycaemic values in a group defined by the absence of hypertension, dyslipidaemia and diabetes are expected and do not show an independent phenotype. The more informative findings concern variables outside the definition: older age, lower BMI and GRACE score, fewer vessels treated and more unstable angina. These findings are consistent with a lower atherosclerotic burden, but they could also reflect the different capture period. Killip class, LVEF and in-hospital death did not differ significantly. This differs from SWEDEHEART [1] and the global meta-analysis [7] and is closer to the Australian PCI registry [8]. Three explanations are possible. First, with 53 deaths our CI (0.32–1.78) excludes the roughly twofold excess seen in SWEDEHEART but not a smaller one. Second, our cohort includes only patients who reached an invasive centre and underwent PCI, which excludes patients with out-of-hospital arrest or very severe presentations. Third, the SWEDEHEART excess was most evident at 30 days, whereas our registry has no follow-up after discharge. In an earlier analysis of this registry [22], patients without SMuRFs appeared more likely to have LVEF <40%; in the present, complete dataset with age and sex adjustment, this association was not found (OR 1.14, 0.81–1.62).
9. The SHR
We did not detect an association between SHR and the markers of index-event severity, and this result was consistent across models, tertiles, discrimination analyses and the four approaches to boundary HbA1c values. The absence of a detected association does not show that SHR has no prognostic value. Several features of our data could explain the difference from the positive literature [14,15,16].
First, the timing of the glucose sample is uncertain. The SHR concept assumes a glucose value that reflects the acute response to the index event. Our glucose field is labelled fasting, and some samples may have been drawn after PCI, fluids, fasting, insulin or haemodynamic stabilisation, all of which would move the ratio towards 1 and bias associations towards the null. This uncertainty concerns the main exposure and could by itself explain our findings. Second, our endpoints are mainly markers of the severity of the index event, recorded close in time to the glucose sample, whereas the positive literature is based largely on mortality and adverse events over 30 days to several years. Third, with 46 deaths in the analytic cohort, the power for mortality was limited.
The inverse pattern for mortality should be interpreted cautiously. Patients in the lowest tertile more often had diabetes and had higher HbA1c, so a low SHR here mainly identifies patients whose glucose value was below their chronic glycaemic level. This may reflect poorly controlled diabetes, residual confounding or glucose sampled after treatment, rather than a protective effect of higher SHR. U- or J-shaped associations between SHR and mortality have been described, but our data, with few events and uncertain sampling time, cannot establish one.
The results also show that SHR is sensitive to how it is constructed. Because the denominator comes from a single laboratory value, recording 10.7% of HbA1c values at the reporting floor inflated the ratio without any physiological change. Registry studies using SHR, or any derived ratio, should report the frequency of input values at their recording bounds and test how their handling affects the results [17].
10. SHR in patients with and without a documented SMuRF
Patients without a documented SMuRF had lower chronic glycaemia by definition, and their SHR distribution was narrow: most had an SHR slightly above 1.0, and very few had a high value. Their median SHR was similar to that of SMuRF-positive patients, but their mean SHR was lower because extreme values were largely confined to SMuRF-positive patients. The two comparisons are therefore consistent. Among patients with HbA1c below 6.5%, those with at least one SMuRF had a higher median SHR (1.55 vs 1.27), suggesting that the classical risk factors may be associated with a larger acute glycaemic response even when chronic glycaemia is normal. Because of the capture-period issue and the uncertain glucose timing, this should be regarded as hypothesis-generating.
11. Limitations
This was a single-centre retrospective analysis of patients selected for invasive management, and patients who died before catheterisation were not included. The most important limitation is that all patients without a documented SMuRF were recorded in one 4-month period, which makes SMuRF status inseparable from the recording period; this limits the prevalence estimate and all between-group comparisons. SMuRF status was based on documented history, and information on previous screening and pre-admission medication was not available. The timing and fasting status of the glucose sample could not be verified, and the timing of Killip assessment and echocardiography relative to PCI was not uniformly recorded as described in Section Endpoints. Several continuous variables showed heaping at recording bounds; sensitivity analyses did not change our conclusions, but source verification was not possible and was limited to a sample. The registry multivessel field was internally inconsistent, and angiographic disease extent beyond the treated vessels was not available. Follow-up after discharge was not available, and in-hospital mortality was low (3.1%), limiting power. Unmeasured confounders include inflammatory markers, lipoprotein(a) and socioeconomic status.
Conclusions
In this Indonesian tertiary PCI registry, 12.0% of patients with ACS had no documented SMuRF. This estimate depended strongly on the definition (3.8% with ever-smoking) and on the period in which records were captured, and it should not be taken as a population prevalence. These patients had a lower-risk clinical and procedural profile, and we found no significant difference in Killip class, LVEF or in-hospital death. SHR calculated from the glucose value available in this registry was not associated with the markers of index-event severity; for in-hospital death, estimates were inverse and imprecise. These data do not support general conclusions about the prognostic value of SHR in ACS. Registry studies using derived ratios such as SHR should audit their input variables for recording-bound artefacts, and SMuRF-less prevalence should be reported alongside at least one broadened definition.
Notes
[23] Ethics approval and consent to participate
Approved by the Health Research Ethics Committee, Dr. Saiful Anwar General Hospital, East Java, Indonesia (approval number 400/246/K.3/102.7/2026, issued in August 2026); the requirement for individual informed consent was waived.
[24] Contributed by Authors' contributions
SA conceived the study, curated the registry data, performed the statistical analysis and drafted the manuscript; MSR supervised the work and critically revised the manuscript; WK contributed to data curation and critical revision. All authors read and approved the final version.
[25] Availability of data and materials
The corresponding author will make the de-identified dataset and the complete analysis code, including the data-quality audit, sensitivity analyses and the Firth implementation, available on reasonable request, subject to institutional data-governance approval.
Supplementary Table S1 -
Adjusted differences between patients without and with a documented SMuRF, with and without records at the recording bounds of each variable.
| Variable | All records: difference (95% CI) | n | Boundary records excluded: difference (95% CI) | n |
|---|---|---|---|---|
| LDL cholesterol (mg/dL) | −38.25 (−47.55 to −28.94) | 1702 | −43.09 (−51.85 to −34.34) | 1604 |
| Total cholesterol (mg/dL) | −35.43 (−46.87 to −23.99) | 1702 | −40.02 (−50.84 to −29.20) | 1546 |
| Creatinine (mg/dL) | −0.38 (−0.67 to −0.10) | 1702 | −0.26 (−0.46 to −0.06) | 1636 |
| eGFR (mL/min/1.73 m2) | 3.69 (−0.53 to 7.92) | 1702 | 3.15 (−0.90 to 7.19) | 1648 |
| GRACE risk score | −18.66 (−25.46 to −11.87) | 1702 | −19.97 (−26.60 to −13.34) | 1626 |
| Heart rate (beats/min) | −4.89 (−9.12 to −0.66) | 1702 | −5.56 (−9.57 to −1.54) | 1643 |
| BMI (kg/m2) | −1.55 (−2.39 to −0.70) | 1702 | −1.78 (−2.60 to −0.97) | 1669 |
[i] BMI, body mass index; CI, confidence interval; LDL, low-density lipoprotein; SMuRFs, standard modifiable cardiovascular risk factors. Linear regression adjusted for age and sex. In the right-hand columns, records at the lower or upper recording bound of that variable (Table 1) were excluded.
Supplementary Table S2 -
SHR analyses under four approaches to HbA1c values at the recording bounds.
| Approach | n | Killip III–IV | Killip II–IV | LVEF <40% | In-hospital death (Firth) | SHR difference, no documented SMuRF versus ≥1 SMuRF |
|---|---|---|---|---|---|---|
| Exclusion (primary) | 1494 | 1.01 (0.89–1.15) | 0.95 (0.85–1.05) | 1.07 (0.95–1.20) | 0.71 (0.45–1.05) | −0.17 (−0.28 to −0.06) |
| Retention of recorded values | 1702 | 1.04 (0.93–1.16) | 0.96 (0.87–1.06) | 1.09 (0.98–1.21) | 0.80 (0.55–1.09) | −0.25 (−0.36 to −0.13) |
| Multiple imputation (treated as missing) | 1702 | 1.03 (0.91–1.16) | 0.97 (0.87–1.07) | 1.06 (0.94–1.19) | 0.69 (0.47–1.03) | −0.16 (−0.27 to −0.04) |
| Censored imputation | 1702 | 1.04 (0.94–1.15) | 0.96 (0.88–1.05) | 1.08 (0.98–1.19) | 0.85 (0.64–1.13) | −0.31 (−0.44 to −0.18) |
[i] BMI, body mass index; LDL, low-density lipoprotein; OR, odds ratio; SD, standard ratio; SHR, stress hyperglycaemia ratio; SMuRFs, standard modifiable cardiovascular risk factors; STEMI, ST-elevation myocardial infarction.
[ii] ORs per 0.76 units of SHR (1 SD in the analytic cohort), adjusted as in Model 1. The last column is the age- and sex-adjusted mean difference. Multiple imputation: HbA1c for the 208 boundary records imputed 20 times from a linear model (diabetes, registry glucose, age, sex, BMI, LDL cholesterol, hypertension, dyslipidaemia, current smoking, SMuRF status, STEMI) fitted in non-boundary records, with parameter uncertainty; censored imputation draws from the same model truncated to 3.0%–4.0% (lower bound) or 15.0%–20.0% (upper bound). Estimates combined by Rubin's rules (Wald intervals); the exclusion and retention mortality intervals are profile penalised-likelihood intervals.
Supplementary Table S3 -
Comparison of the SHR between patients without and with a documented SMuRF using different summary measures (analytic cohort, n = 1494)
| Measure | ≥1 SMuRF (n = 1290) | No documented SMuRF (n = 204) | Difference (95% CI) |
|---|---|---|---|
| Median (IQR) | 1.30 (0.94–1.79) | 1.27 (1.13–1.43) | Mann–Whitney p = 0.731 |
| Mean (SD) | 1.48 (0.81) | 1.30 (0.25) | Levene p < 0.001 |
| Unadjusted mean difference | −0.17 (−0.29 to −0.06); p = 0.002 | ||
| Adjusted mean difference | −0.17 (−0.28 to −0.06); p = 0.003 | ||
| Adjusted difference in medians | −0.03 (−0.13 to 0.06); p = 0.473 | ||
| Adjusted ratio of geometric means | 0.98 (0.91–1.04); p = 0.489 | ||
| Adjusted difference, 25th percentile | 0.18 (0.11–0.26); p < 0.001 | ||
| Adjusted difference, 75th percentile | −0.38 (−0.51 to −0.24); p < 0.001 | ||
| Adjusted difference, 90th percentile | −0.80 (−1.01 to −0.59); p < 0.001 | ||
| Adjusted mean difference, SHR ≤2.0 only (n = 1255) | 0.10 (0.04–0.15); p < 0.001 |
[i] CI, confidence interval; IQR, interquartile range; SD, standard deviation; SHR, stress hyperglycaemia ratio; SMuRFs, standard modifiable cardiovascular risk factors.
[ii] Differences are no documented SMuRF minus ≥1 SMuRF, adjusted for age and sex (linear regression for means and log-transformed SHR; quantile regression for percentiles). The groups have similar medians; the lower mean in patients without a documented SMuRF results from fewer high values (lower 75th percentiles and 90th percentiles), while their lower quartile is higher.