
Figure 1-
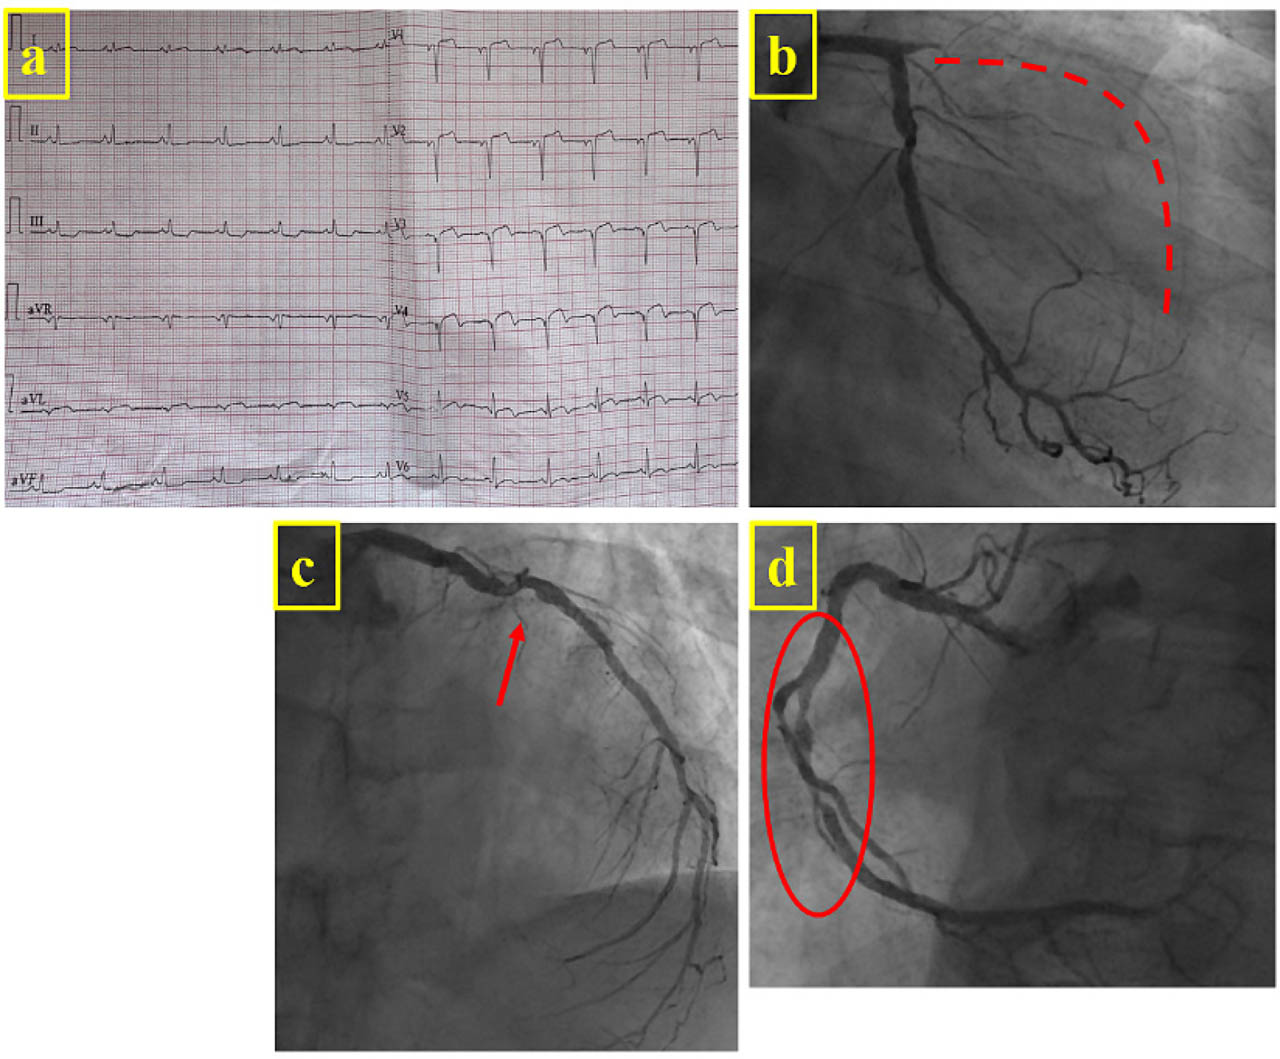
(A) ECG at admission showing sinus rhythm with pathological Q waves and ST-segment elevation in the anterolateral leads. Coronary angiography showing (B) total occlusion of the left anterior descending artery with TIMI 0 flow (dotted line), (C) a moderate left circumflex lesion (arrow) and (D) two significant mid-right coronary artery lesions (circle).
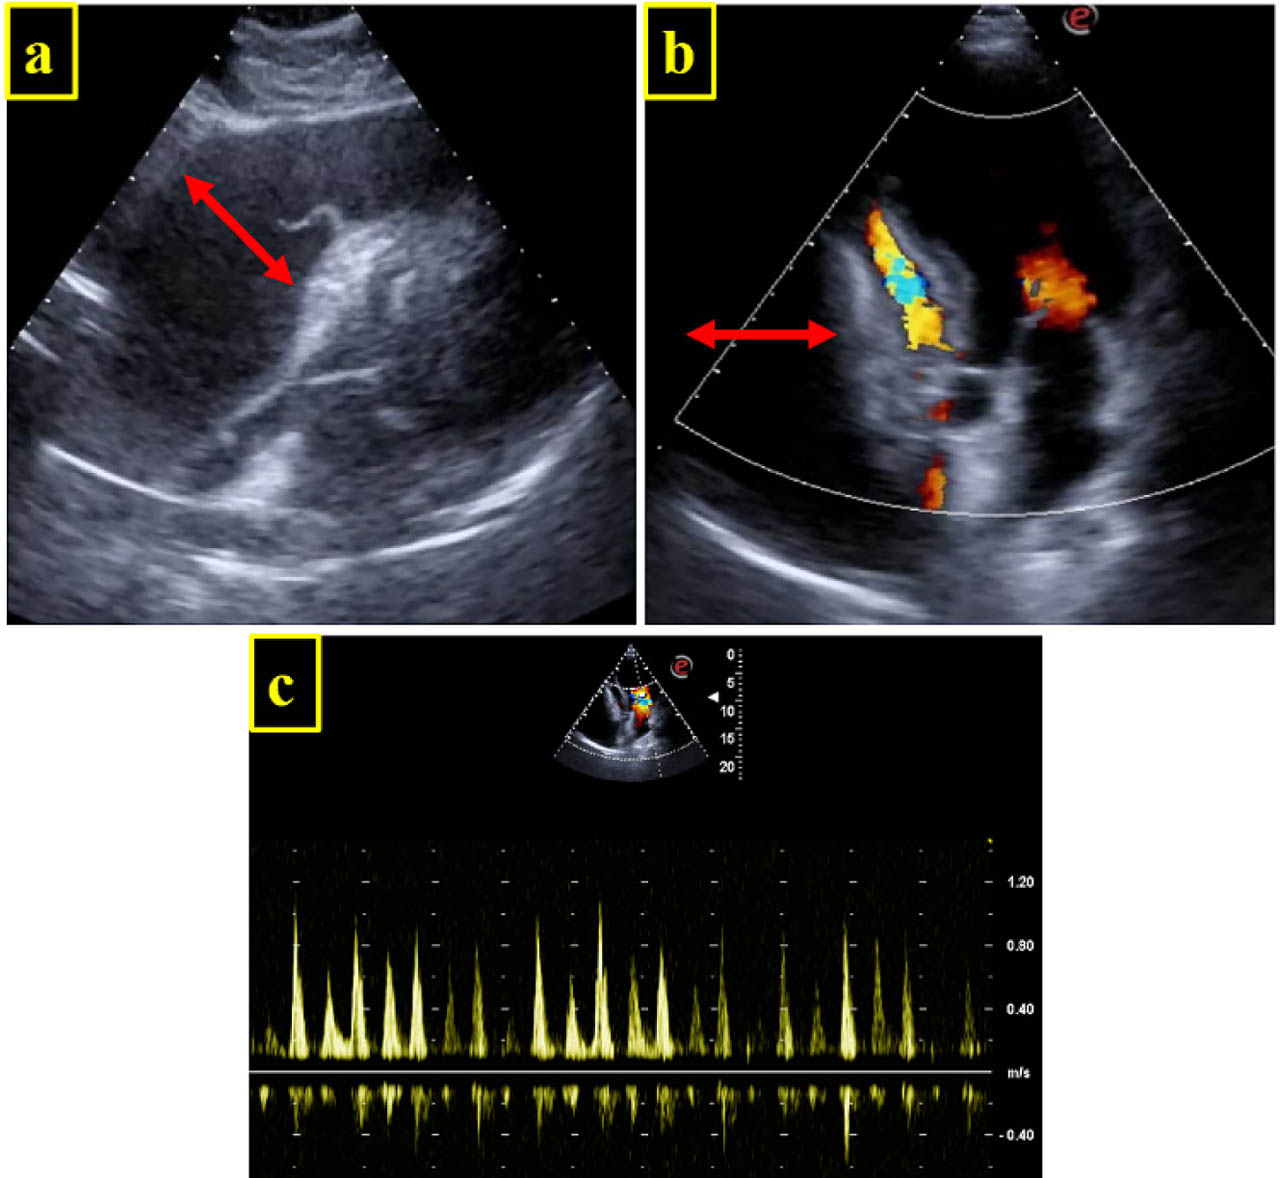
Figure 2-
2D TTE. Large PE (arrow) with signs of cardiac tamponade. Diastolic collapse of the right heart chambers on subcostal long-axis view (A) and apical 4C view with colour Doppler (B). (C) Significant respiratory variation in mitral inflow velocities. PE, pericardial effusion; TTE, transthoracic echocardiography.
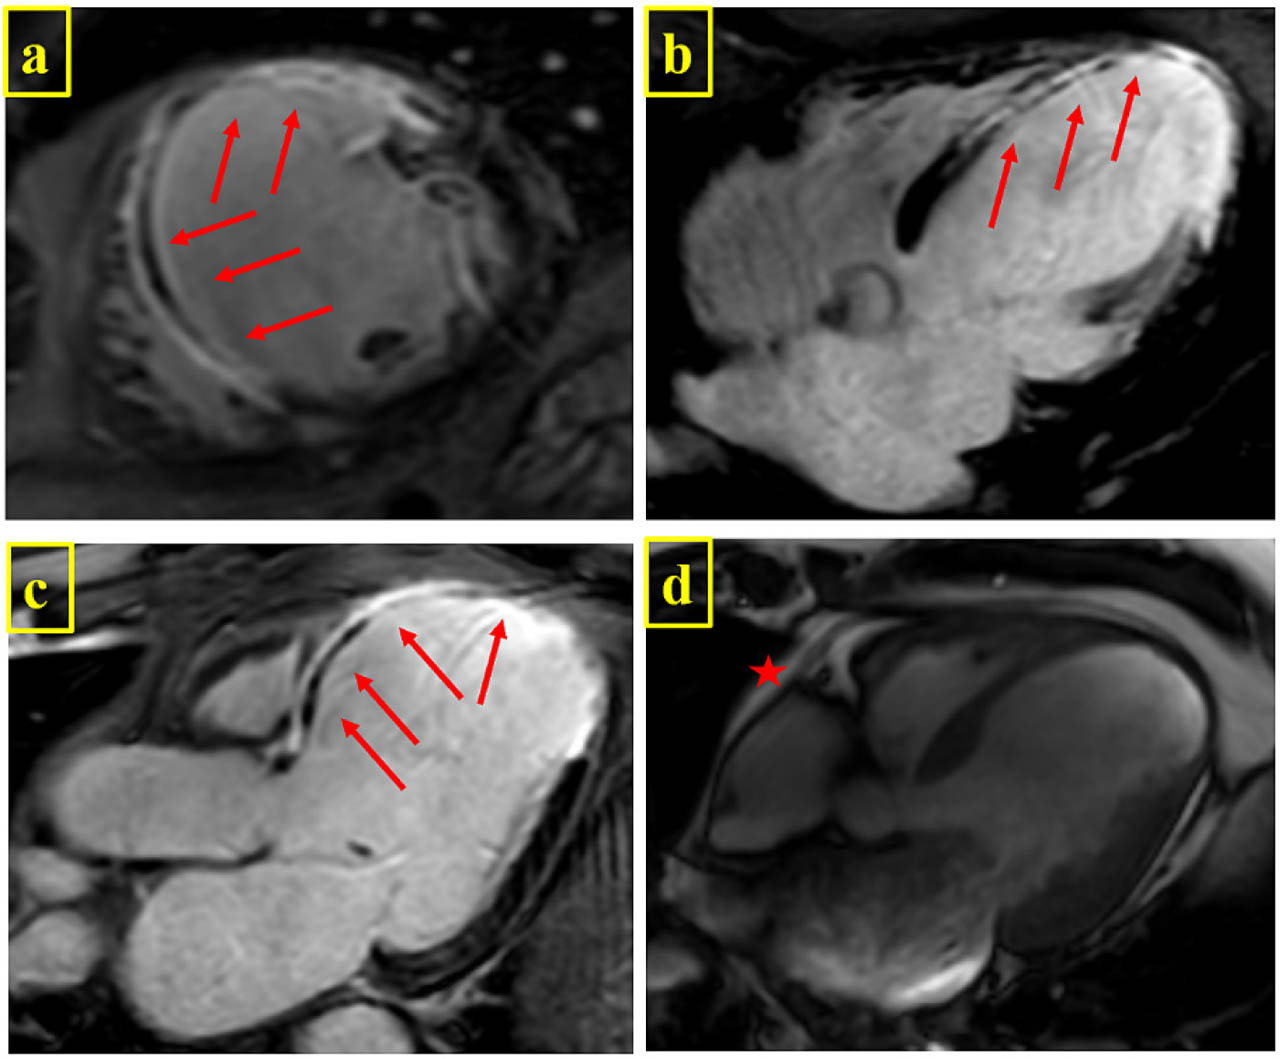
Figure 3-
Contrast-enhanced cardiac magnetic resonance imaging (A) short axis, (B) four-chamber and (C) three-chamber long-axis views showing transmural late gadolinium enhancement at the level of the anterior wall and mid-apical anteroseptal and inferoseptal wall (arrow). (D) A small PE is present (star), with no contrast enhancement. PE, pericardial effusion.