
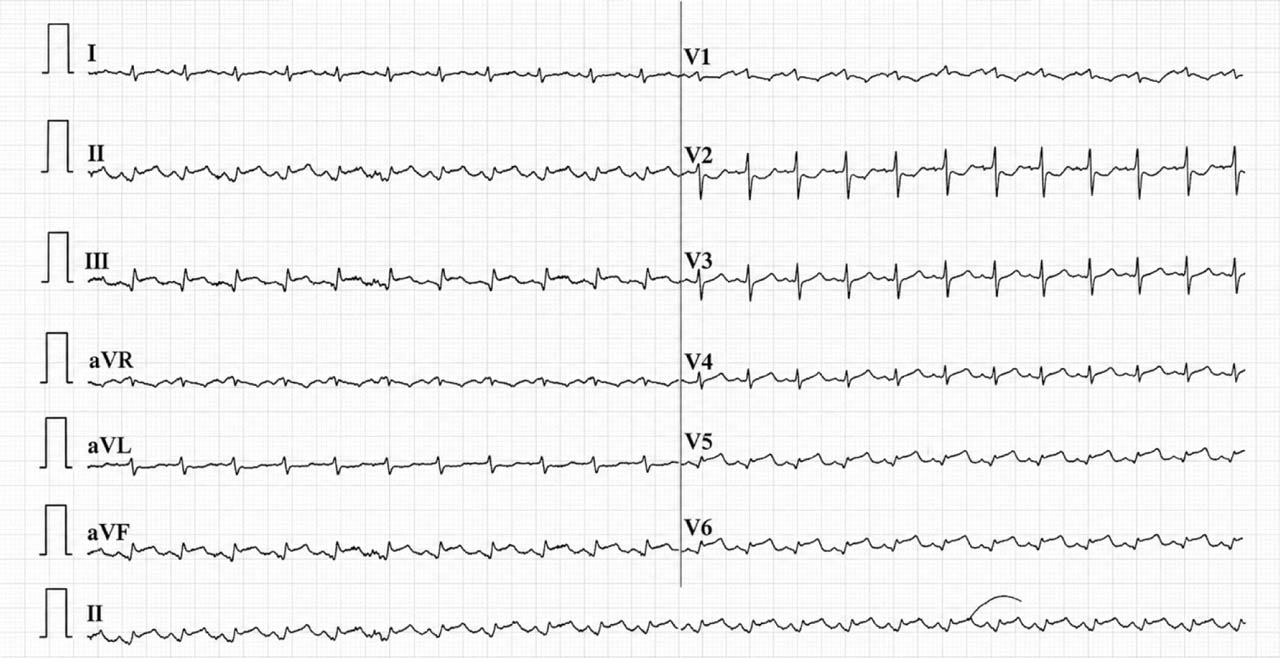
Figure 1-
Admission 12-lead electrocardiogram showing ST-segment elevation in inferior (II, III, aVF) and lateral (V5–V6) leads, with and S wave in lead I and R/S = 1 in V2.
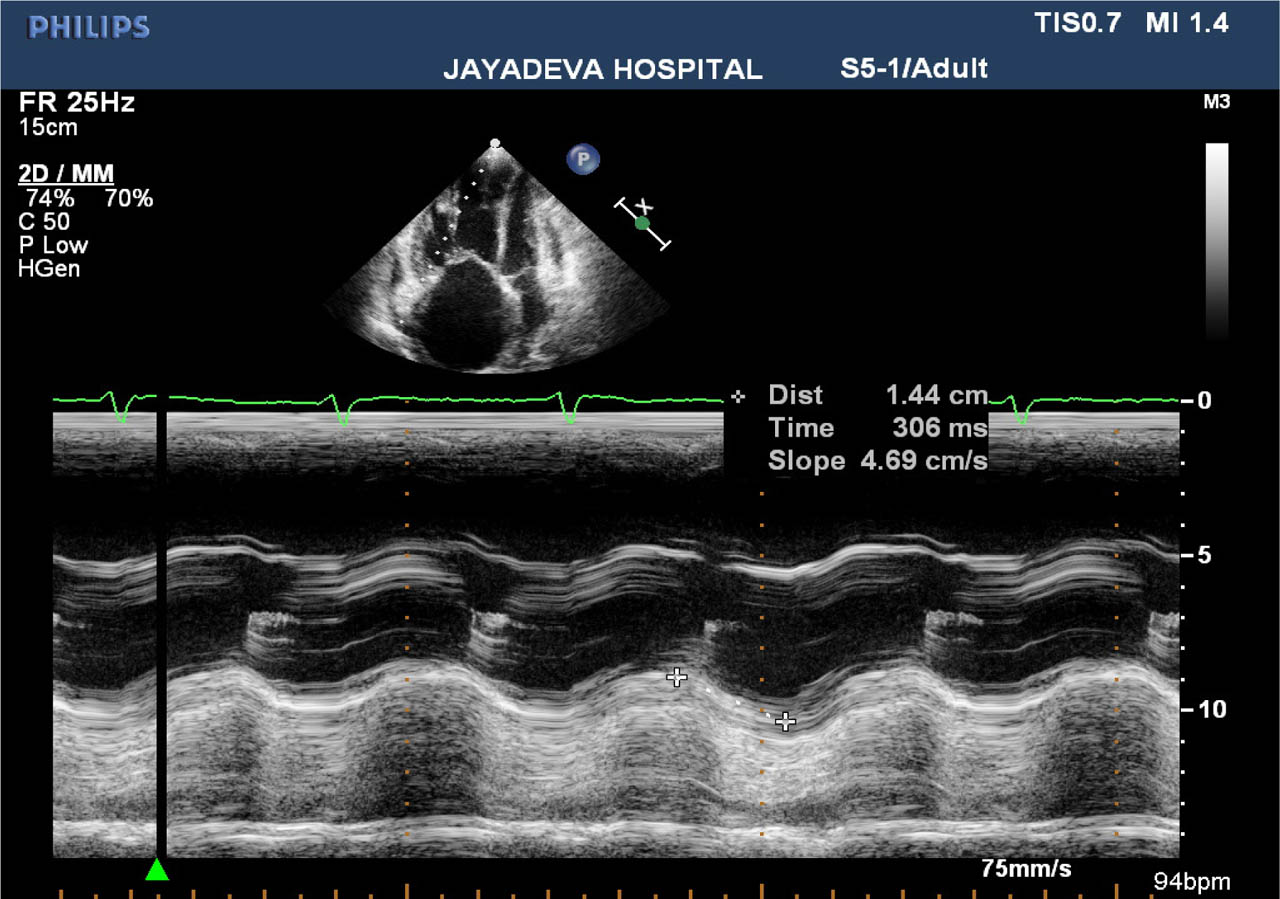
Figure 2-
Transthoracic echocardiography demonstrating dilated right-sided chambers, reduced TAPSE and elevated tricuspid regurgitation gradient suggestive of acute RV pressure overload. RV, right ventricular; TAPSE, tricuspid annular plane systolic excursion.
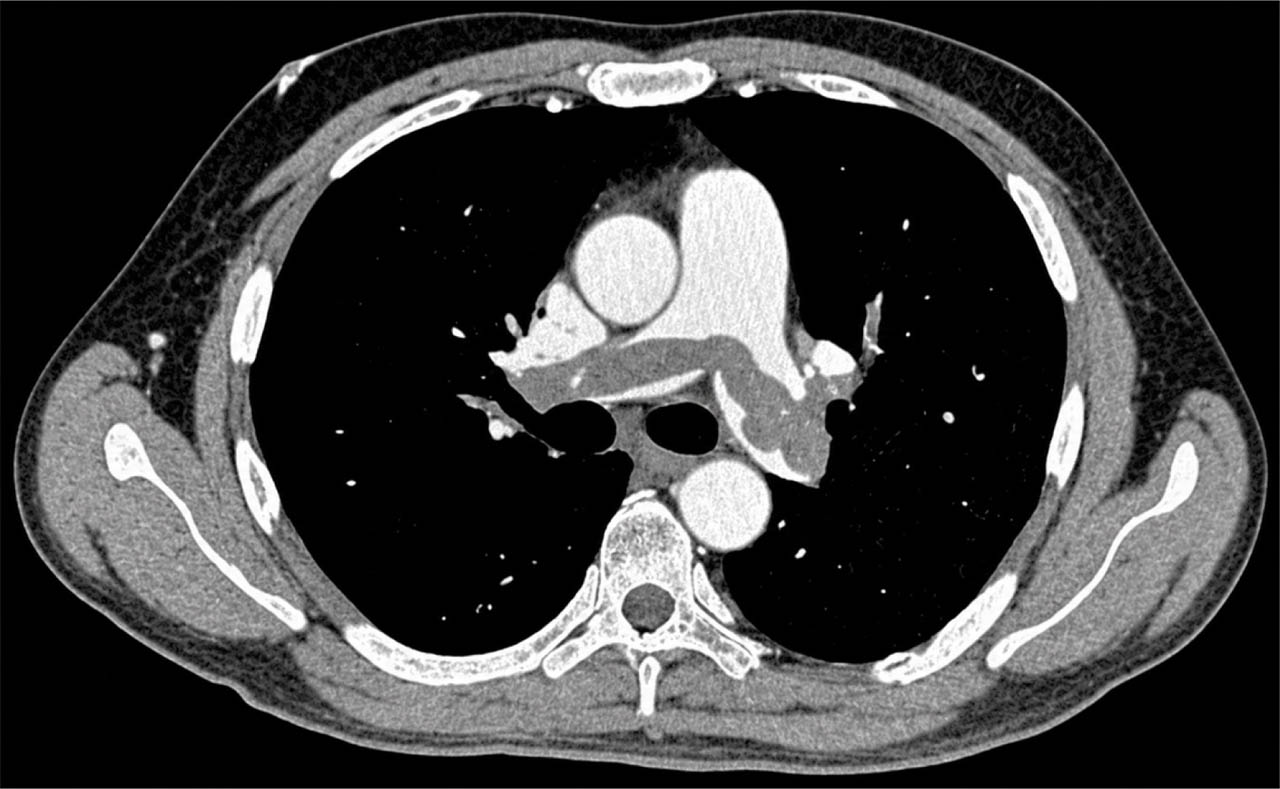
Figure 3-
CTPA showing large filling defects within the main pulmonary artery and right pulmonary artery consistent with acute pulmonary embolism. CTPA, computed tomography pulmonary angiography.
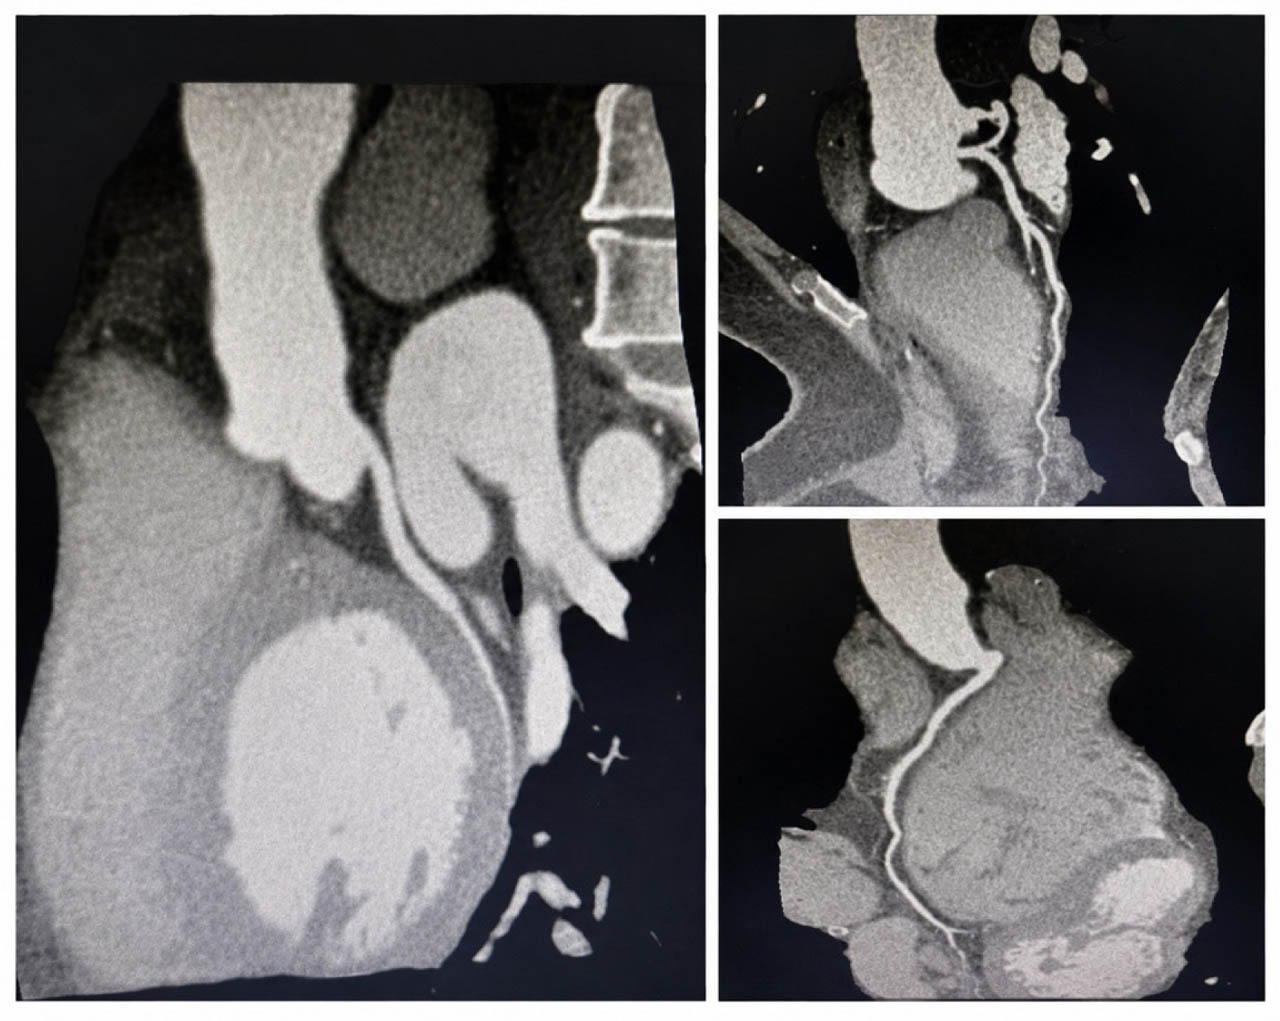
Figure 4-
CT-CAG demonstrating normal coronary arteries without obstructive lesions. CT-CAG, computed tomography coronary angiography.