
Table 1
Number of hospitals included in the analysis, number of hospitals reporting DRG data, and number of hospitals reporting one-year readmission frequencies.
| Year | 2017 | 2018 | 2019 | 2020 | 2021 | 2022 |
|---|---|---|---|---|---|---|
| Total number of hospitals in Romania* | 535 | 524 | 532 | 541 | 543 | 544 |
| Number of hospitals reporting DRG data | 505 | 508 | 517 | 514 | 526 | 528 |
| Number of hospitals reporting HF readmission frequencies | 356 | 352 | 357 | 345 | 348 | 363 |
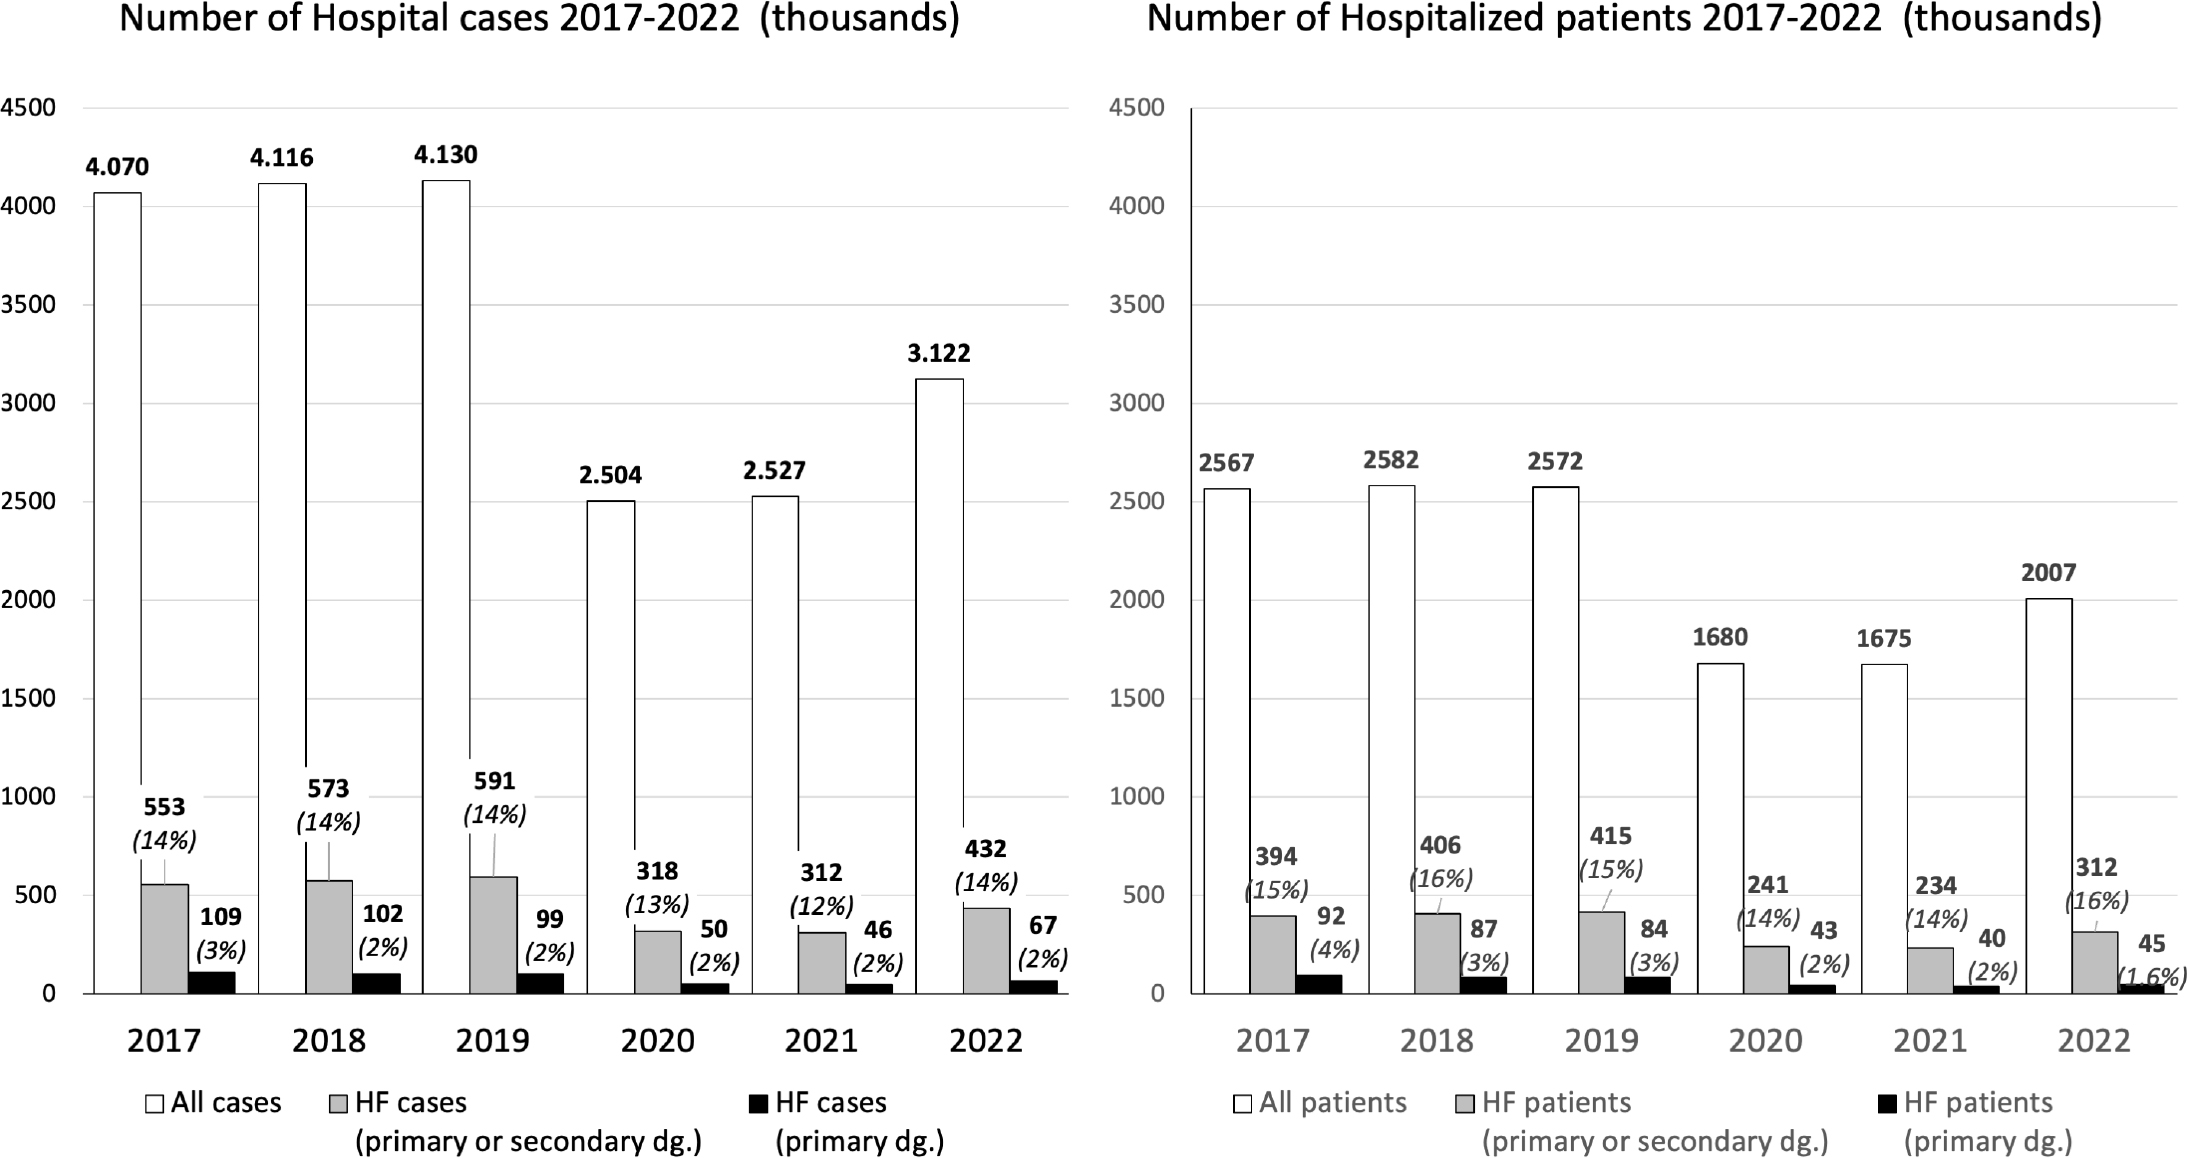
Figure 1
A. Hospital cases, all cases, and HF* cases, time period 2017–2022 (thousands); B. Unique patients, all patients, and HF* patients, time period 2017–2022 (thousands).
*ICD-10 code for Heart Failure diagnosis I50.0, I50.1, I50.9, I11.0.
Proportions represent percentages out of all cases or all patients.
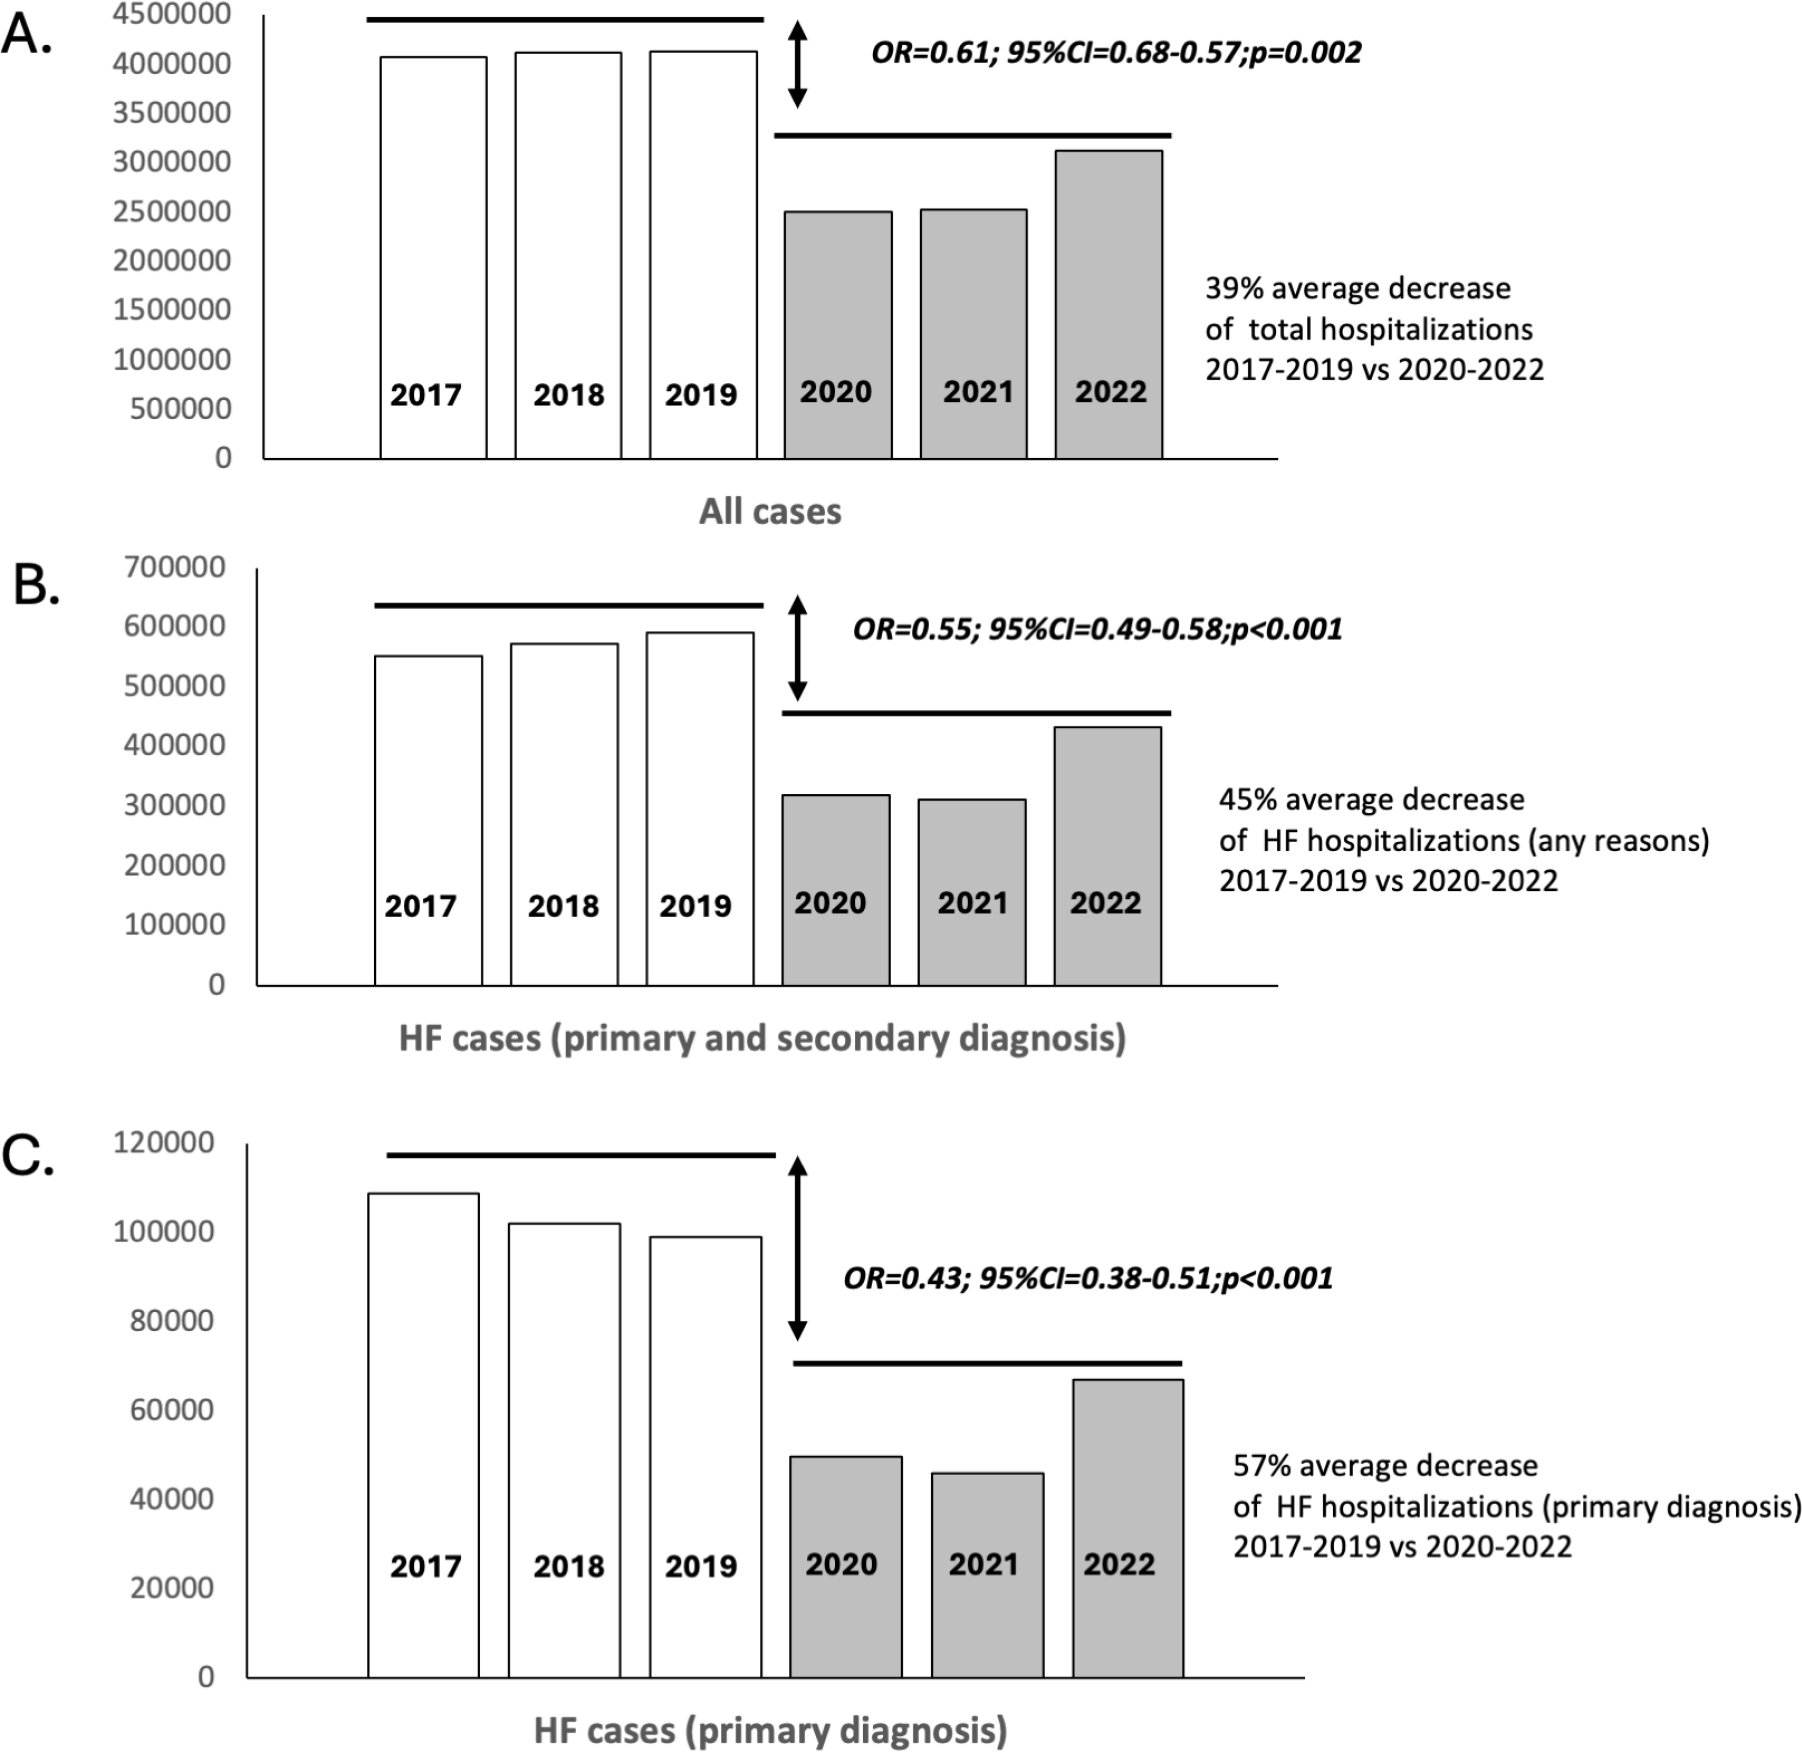
Figure 2
A. Comparison between 2017–2019 vs. 2020 for total hospitalizations; B. HF hospitalization (any cause); C. HF hospitalizations with HF as primary diagnosis.
“For each panel (A, B, and C) in Figure 2, odds ratios (ORs) were calculated to compare hospitalization volumes during the pre-pandemic period (2017–2019) with those during the pandemic period (2020–2022). ORs <1 indicate a reduction in hospitalizations during 2020–2022 compared with the 2017–2019 reference period.”
Abbreviations: OR=odd ratio; CI =confidence interval
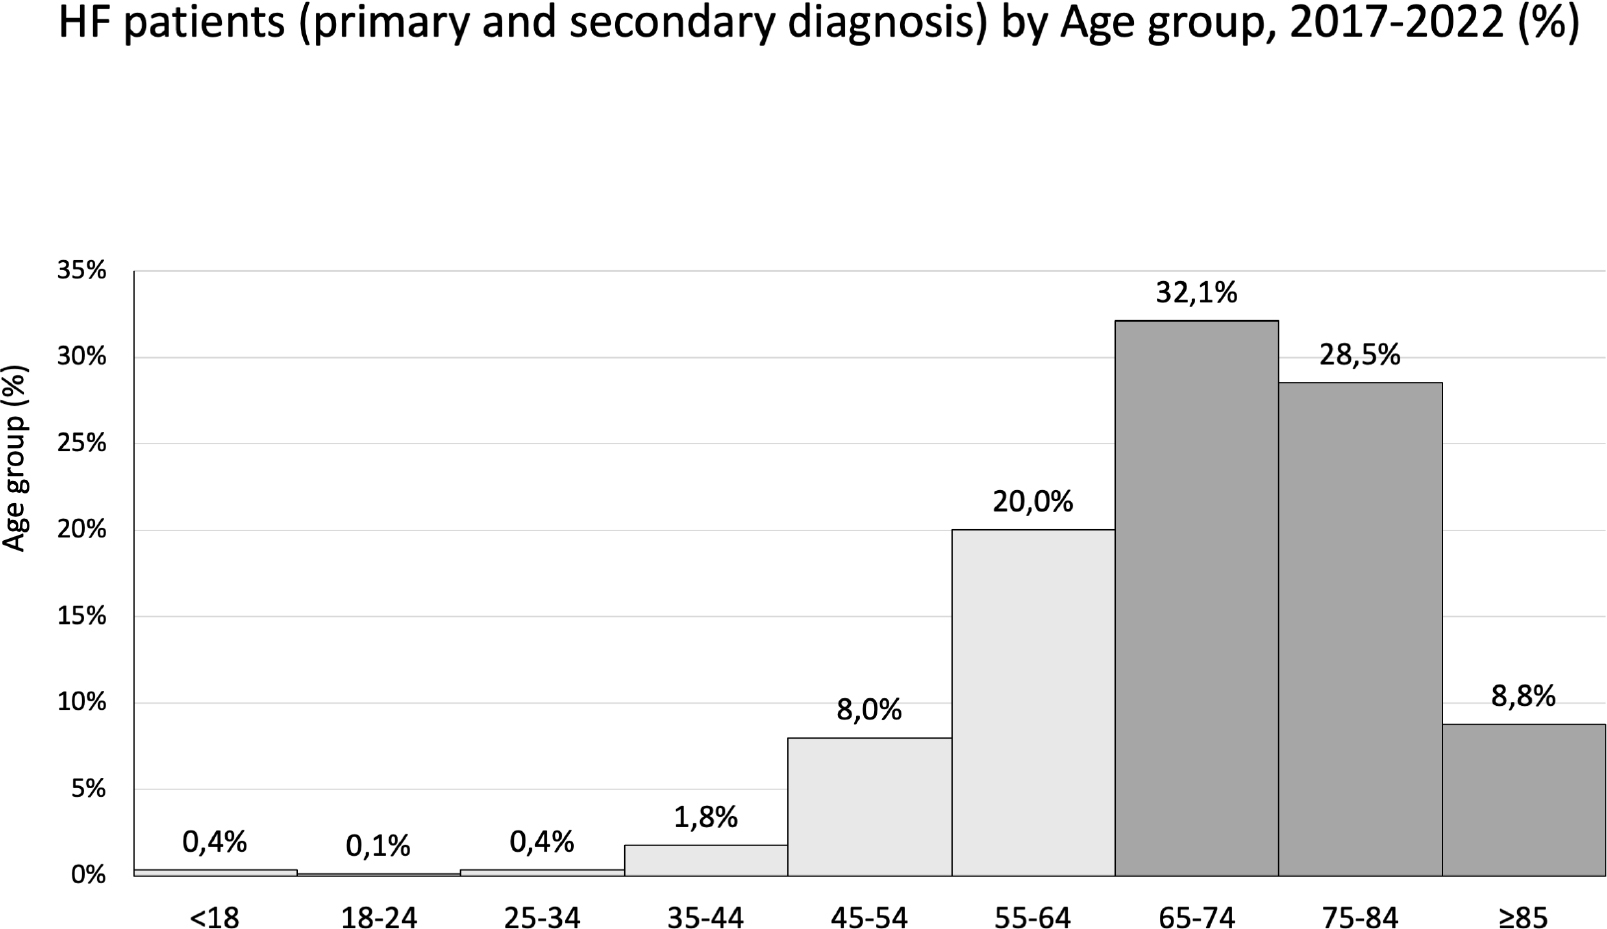
Figure 3
HF patients by age group, period 2017–2022.
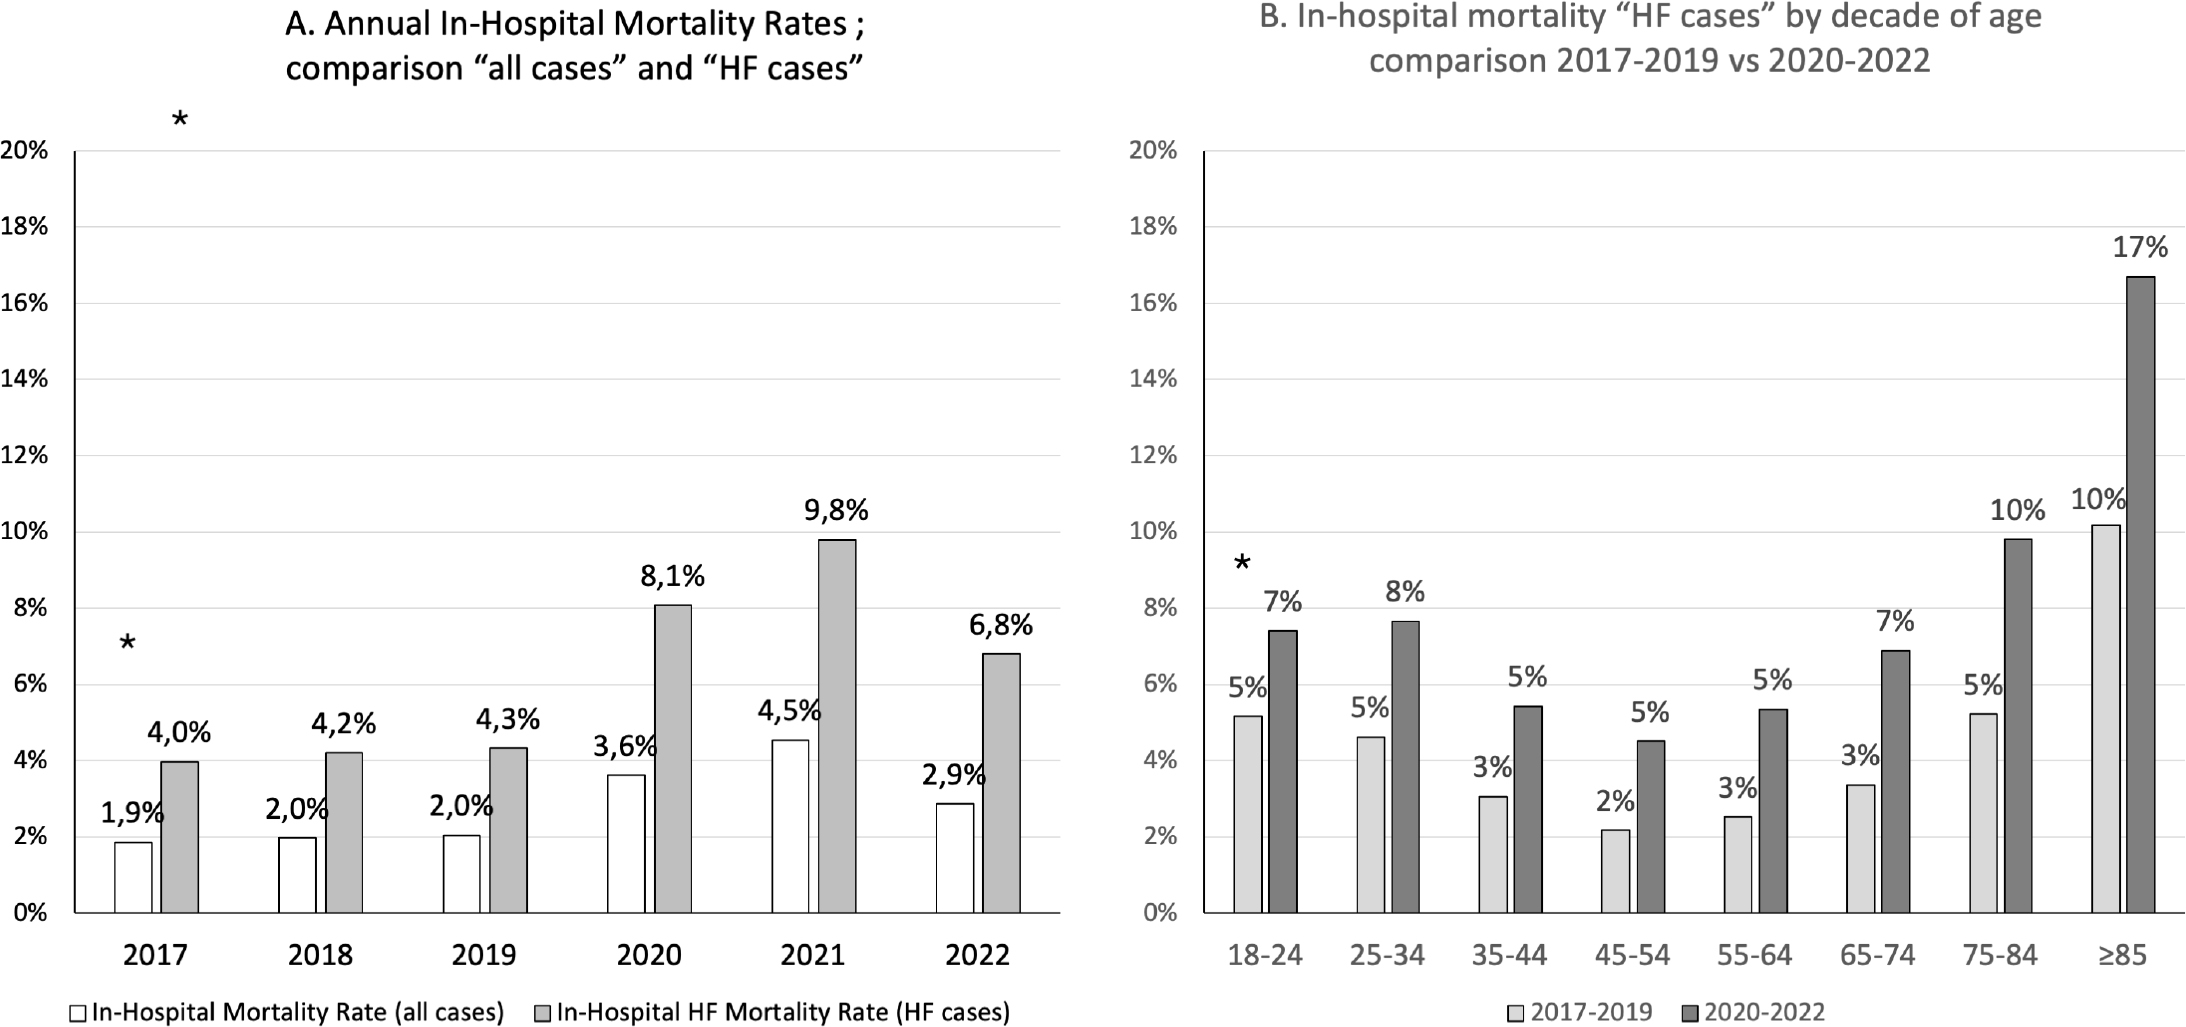
Figure 4
A. Annual in-hospital mortality rates; comparison of “all cases” vs. “HF cases” (p<0.001 for each year); B. In-hospital mortality HF cases by decade of age; comparison of 2017–2019 vs. 2020–2022 (p<0.001 for age category >25 years).
*p=0.06
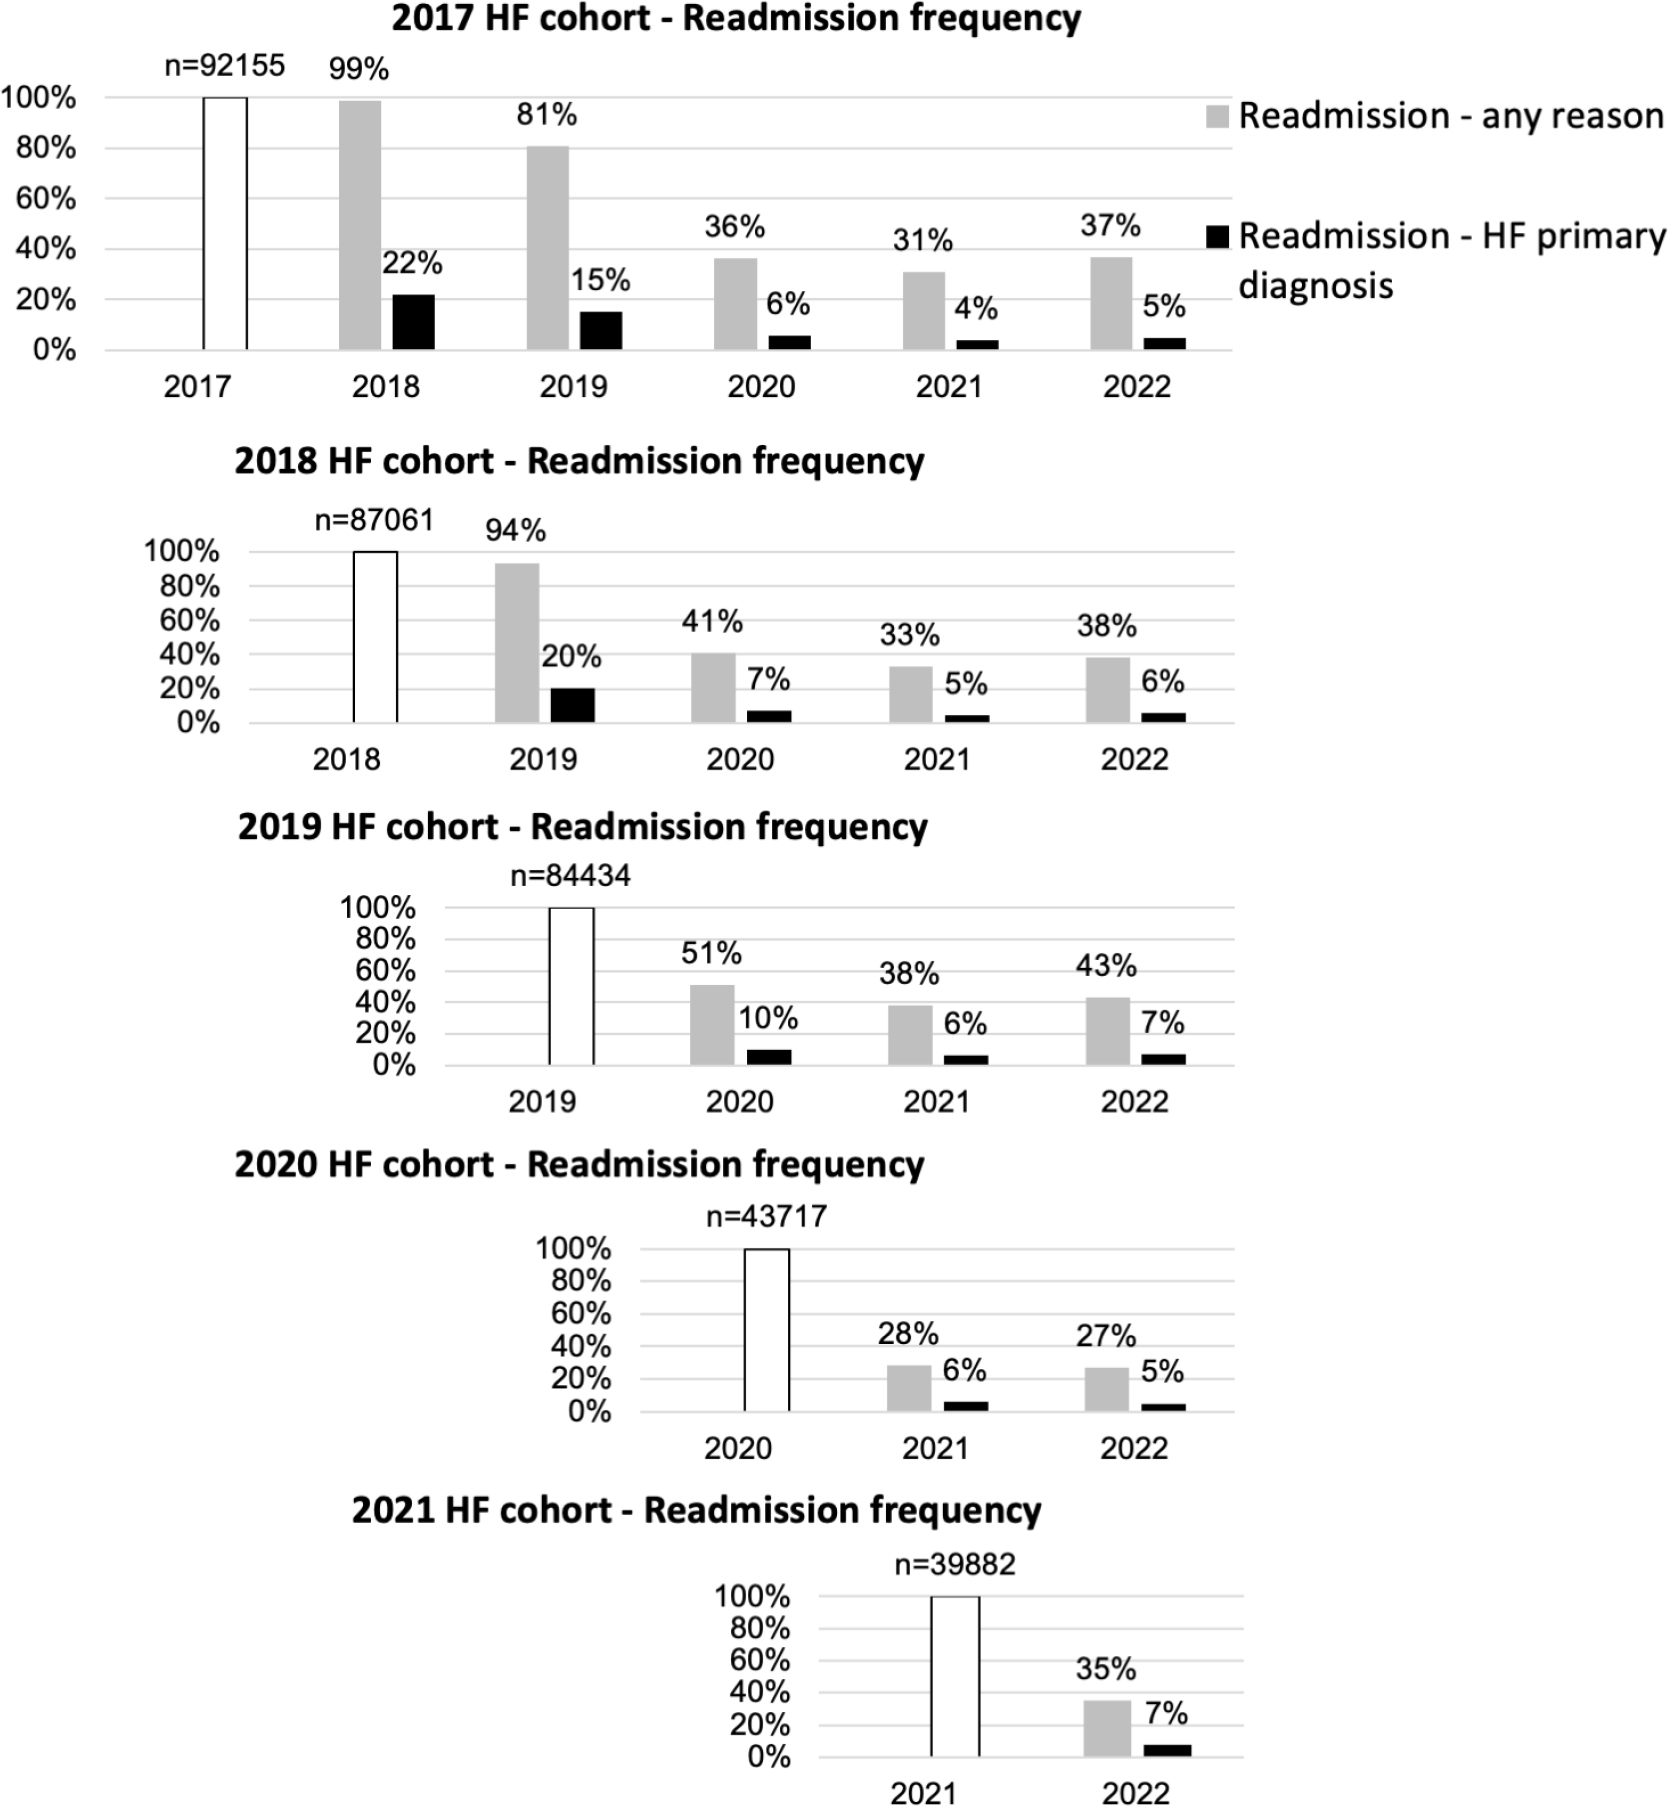
Figure 5
Frequency of readmissions for each annual cohort of patients admitted with a primary diagnosis of HF for 2017–2021; HF readmission frequency for any reason; and for HF primary diagnosis.