
Acute ST-segment elevation myocardial infarction (STEMI) is a major cardiovascular emergency caused by abrupt coronary artery occlusion, leading to ischemia and irreversible myocardial injury if untreated [1–3]. Rapid diagnosis and timely reperfusion are essential to limit infarct size, preserve left ventricular (LV) function, and reduce subsequent heart failure and mortality [4–6]. Primary percutaneous coronary intervention (PCI) is the preferred reperfusion strategy, providing superior outcomes compared with pharmacological reperfusion when performed promptly [7–9]. Despite advances in interventional techniques, antithrombotic therapy, and secondary prevention, many patients continue to experience adverse cardiovascular events [10,11], highlighting the need for accurate post-infarction risk stratification.
Left ventricular ejection fraction (LVEF) remains the cornerstone for prognostic assessment, given its strong association with mortality and heart failure [12,13]. Global longitudinal strain (GLS) offers incremental prognostic value by detecting subtle myocardial dysfunction, even in patients with preserved LVEF [14,15]. Both measures, however, are influenced by loading conditions.
Myocardial work (MW), which integrates strain with non-invasive LV pressure estimates, provides a more physiologically comprehensive assessment of myocardial performance and may overcome limitations of conventional systolic indices [16–19]. This study aimed to evaluate whether MW parameters, particularly global work efficiency (GWE), independently and incrementally predict major adverse events (MAE) in STEMI patients undergoing primary PCI.
Over two years, 225 consecutive STEMI patients admitted to our tertiary center in Timișoara, Romania, were prospectively enrolled in the study. All underwent primary PCI within 12 hours of symptom onset, followed by comprehensive transthoracic echocardiography (TTE). Exclusion criteria included significant valvular disease; fixed or dynamic left ventricular outflow tract obstruction; atrial fibrillation or marked R–R variability; permanent pacemaker; life expectancy < 1 year due to comorbidities; or poor echocardiographic quality. The final cohort comprised 215 patients.
Patients received guideline-directed therapy [20] and were followed through a structured outpatient program. MAE was defined as a composite of unplanned cardiovascular hospitalization, malignant ventricular arrhythmias, stroke, and/or all-cause mortality. Demographics, clinical parameters, cardiovascular risk factors, and laboratory data — including lipid profile, creatinine, glucose, hemogram, erythrocyte sedimentation rate, and peak cardiac biomarkers — were systematically recorded. The study was approved by institutional and university ethics committees (approval no. 10163/05.12.2023 and 07/31.01.2024), with informed consent obtained from all participants.
TTE was performed according to guideline recommendations [21] using a Vivid 9 system (GE Healthcare) within 4 days of admission (interquartile range [IQR] 3–5). Imaging was obtained at rest in the left lateral decubitus position with electrocardiogram gating, and brachial systolic blood pressure was measured immediately before echocardiographic acquisition with the patient at rest; these values were then used to estimate LV pressure for MW calculations. Pulsed-wave tissue Doppler imaging measured septal and lateral mitral annular velocities (S’, E’, and A’) over five cardiac cycles, averaged for analysis. Speckle-tracking echocardiography in standard apical views was used to derive GLS, excluding poorly tracked segments. Mechanical dispersion (MD) was calculated as the standard deviation of time to peak longitudinal strain across 17 LV segments, providing a measure of regional mechanical heterogeneity. MD was analyzed as an exploratory secondary parameter.
Pressure-strain loops integrated GLS with brachial systolic pressure. Valve timings were determined from continuous-wave Doppler and visually confirmed. Derived indices included global work index (GWI), global constructive work (GCW), global wasted work (GWW), and global work efficiency (GWE = GCW / [GCW + GWW]) [16,22,23]. Analyses were performed independently by two blinded observers.
Data distribution was assessed via Shapiro-Wilk test. Categorical variables were reported as counts and percentages; continuous variables as mean ± SD or median (IQR). Comparisons used Chi-square/Fisher’s exact or t-test/Mann-Whitney U, as appropriate. Univariable and multivariable Cox regression identified MAE predictors, with the covariate number limited to ≥ 10 events per variable to avoid overfitting. Multicollinearity was evaluated via variance inflation factors (VIF). Sequential models assessed the incremental prognostic value of GWE, comparing baseline clinical data (age, Killip class, estimated glomerular filtration rate [eGFR]), LVEF, and GWE using -2 log-likelihood, likelihood ratio X2, and Akaike Information Criterion (AIC). Intra-observer variability (assessed by repeat measurements performed by the same observer at two different time points and interobserver reproducibility (evaluated by comparing measurements obtained by two independent observers in the same patients) were quantified using intraclass correlation coefficients (ICCs) with 95% confidence intervals. A two-sided p < 0.05 indicated significance.
The study population consisted of 215 patients (78.1% male) with a mean age of 61 ± 10 years. At the time of hospital admission, mean heart rate was 80 ± 16 bpm, systolic blood pressure 139 ± 22 mmHg, and diastolic blood pressure 86 ± 14 mmHg. The median BMI was 27.1 kg/m2 (IQR 24.2–30.9).
Laboratory analyses revealed a mean peak creatine-kinase isoform MB (CK-MB) level of 289.6 ± 211 U/L and a median peak troponin I concentration of 3,351 ng/L (IQR 314–21,506). Mean estimated glomerular filtration rate (eGFR) rate was 74.1 ± 21.2 mL/min/1.73 m2.
Cardiovascular risk factors were highly prevalent: 73% of patients were current or former smokers, 97.2% had dyslipidemia, 21.9% had diabetes mellitus, and 71.6% had hypertension. A history of coronary artery disease and a positive cardiovascular family history were each present in 6.5% of patients, while chronic kidney disease was documented in 10.2%. At presentation, 82.3% of patients were classified as Killip Class I, 14% as Class II, 1.4% as Class III, and 2.3% as Class IV.
Pre-hospital thrombolytic therapy was administered in 26% of cases. Coronary angiography showed single-, two-, and three-vessel disease in 41.9%, 34.4%, and 23.7% of the patients, respectively.
At discharge, nearly all patients received dual antiplatelet therapy and statins. Additional treatments included beta-blockers (78.6%), mineralocorticoid receptor antagonists (79.1%), angiotensin-converting enzyme inhibitors (58.1%), nitrates (42.8%), loop diuretics (74%), sodium-glucose cotransporter-2 inhibitors (20.5%), and angiotensin receptor–neprilysin inhibitors (3.3%). Only 0.5% of patients received angiotensin receptor blockers.
During a median follow-up of 7 months (IQR 5–15), 40 patients experienced MAE, including all-cause mortality (n = 5), unplanned cardiovascular hospitalization for heart failure or acute coronary syndrome (n = 30), ventricular arrhythmias (n = 3), and stroke (n = 2). Baseline characteristics of the study population are summarized in Table 1.
Baseline clinical characteristics of the study cohort, both overall and according to the occurrence of major adverse events.
| Variable | All (n = 215) | No events (n = 175) | MAE (n= 40) | P value |
|---|---|---|---|---|
| Age, years | 61 ± 10 | 59 ± 10 | 59 ± 13 | 0.791 |
| Man, n (%) | 168 (78.1) | 133 (76) | 35 (87.5) | 0.122 |
| Heart rate, bpm | 80 ± 16 | 79 ± 15 | 78 ± 16 | 0.714 |
| SBP, mmHg | 139 ± 22 | 143 ± 23 | 140 ± 23 | 0.451 |
| DBP, mmHg | 86 ± 14 | 87 ± 15 | 87 ± 16 | 0.801 |
| BMI, kg/m2 | 27.10 (24.22–30.86) | 27.68 (24.5–31.8) | 27.23 (24.0–31.0) | 0.877 |
| BSA, m2 | 1.91 (1.79–2.13) | 1.97 (1.82–2.16) | 1.96 (1.74–2.11) | 0.855 |
| Peak CK-MB, U/L | 289.60 ± 211 | 244.14 ± 189.66 | 353.28 ± 291.45 | 0.004 |
| Peak Troponin I, ng/L | 3,351 (314–21,506) | 1,866 (218–18,773) | 13,404 (1434–38,967) | 0.057 |
| eGFR, ml/min/1.73 m2 | 74.08 ± 21.22 | 79.89 ± 20.23 | 80.28 ± 24.47 | 0.917 |
| Total Cholesterol, mg/dL | 192 ±49 | 192 ± 43 | 190 ± 52 | 0.811 |
| LDLc, mg/dL | 121 ± 49 | 120 ± 32 | 117 ± 39 | 0.632 |
| Triglycerides, mg/dL | 108 (86–156) | 121 (93–168) | 123 (85–146) | 0.806 |
| Hemoglobin, g/dL | 14.80 ± 1.64 | 14.69 ± 1.47 | 14.58 ± 1.53 | 0.656 |
| Creatinine, mg/dL | 1.08 (0.92–1.30) | 1.09 (0.96–1.24) | 1.16 (0.85–1.28) | 0.669 |
| Glycemia, mg/dL | 132 (113–176) | 132 (113–167) | 128 (110–160) | 0.186 |
| Leucocytes, 103 / μL | 12.03 (10.24–14.95) | 12.03 (9.93–14.41) | 11.97 (9.78–15.94) | 0.448 |
| Neutrophiles, 103 / μL | 9.56 (7.40–11.28) | 8.75 (7.11–11.28) | 9.19 (6.99–13.16) | 0.436 |
| ESR, mm/h | 10 (6-20) | 10 (6-22) | 12 (10-29) | 0.667 |
| Smoking, n (%) | 157 (73) | 129 (73.7) | 28 (70.0) | 0.633 |
| Dyslipidemia, n (%) | 209 (97.2) | 171 (97.7) | 38 (95) | 0.347 |
| Previous CAD, n (%) | 14 (6.5) | 12 (6.9) | 2 (5.0) | 1.000 |
| Cardiac inheritance, n (%) | 14 (6.5) | 13 (7.4) | 1 (2.5) | 0.476 |
| Diabetes, n (%) | 47 (21.9) | 39 (22.3) | 8 (20.0) | 0.752 |
| Hypertension, n (%) | 154 (71.6) | 130 (74.3) | 24 (60.0) | 0.071 |
| Killip Class I, n (%) | 177 (82.3) | 149 (85.1) | 28 (70) | 0.024 |
| Killip Class II, n (%) | 30 (14) | 21 (12) | 9 (22.5) | 0.084 |
| Killip Class III, n (%) | 3 (1.4) | 1 (0.6) | 2 (0.5) | 0.090 |
| Killip Class IV, n (%) | 5 (2.3) | 4 (2.3) | 1 (2.5) | 1.000 |
| CKD, n (%) | 22 (10.2) | 16 (9.1) | 6 (15.0) | 0.259 |
| Thrombolysis, n (%) | 56 (26.0) | 45 (25.7) | 11 (27.5) | 0.816 |
| Single-vessel disease, n (%) | 90 (41.9) | 81 (46.3) | 9 (22.5) | 0.006 |
| Two-vessel disease, n (%) | 74 (34.4) | 59 (33.7) | 15 (37.5) | 0.649 |
| Three-vessel disease, n (%) | 51 (23.7) | 35 (20.0) | 16 (40.0) | 0.007 |
| Anterior STEMI, n (%) | 91 (42.3) | 75 (42.9) | 16 (40.0) | 0.741 |
| Treatment at discharge | ||||
| Aspirin, n (%) | 212 (98.6) | 173 (98.9) | 39 (97.5) | 0.462 |
| P2Y12i, n (%) | 215 (100) | |||
| Betablocker, n (%) | 169 (78.6) | 140 (80.0) | 29 (72.5) | 0.297 |
| Nitrate, n (%) | 92 (42.8) | 69 (39.4) | 23 (57.5) | 0.037 |
| ACE inhibitor, n (%) | 125 (58.1) | 109 (62.3) | 16 (40.0) | 0.010 |
| ARBs, n (%) | 1 (0.5) | 1 (0.6) | 0 (0.0) | 1.000 |
| MRAs, n (%) | 170 (79.1) | 136 (77.7) | 34 (85.0) | 0.307 |
| Furosemide, n (%) | 159 (74.0) | 123 (70.3) | 36 (90.0) | 0.010 |
| SGLT2i, n (%) | 44 (20.5) | 37 (21.1) | 7 (17.5) | 0.606 |
| ARNI, n (%) | 7 (3.3) | 5 (2.9) | 2 (5.0) | 0.617 |
| Statins, n (%) | 215 (100) |
Values are expressed as mean ± standard deviation or median (interquartile range). MAE, major adverse events; SBP, systolic blood pressure; DBP, diastolic blood pressure; BMI, body mass index; BSA, body surface area; CK-MB, creatine-kinase isoform MB; eGFR, estimated glomerular filtration rate; LDLc, low-density lipoprotein cholesterol; ESR, erythrocyte sedimentation rate; CAD, coronary artery disease; CKD, chronic kidney disease; ACE, angiotensin-converting enzyme; ARBs, angiotensin II receptor blockers; MRAs, mineral-corticoid receptor antagonists; SGLT2i, sodium-glucose co-transporter 2 inhibitor; ARNI, angiotensin receptor-neprilysin inhibitors.
When stratified by the occurrence of MAE, significant differences were observed in selected clinical and laboratory parameters. Patients who experienced MAE had significantly higher peak CK-MB levels (353.3 ± 291.5 vs. 244.1 ± 189.7 U/L, p = 0.004) and a trend toward higher peak troponin I concentrations (median 13,404 [IQR 1,434–38,967] vs 1,866 ng/L [IQR 218–18,773], p = 0.057).
Regarding clinical presentation and coronary anatomy, fewer patients with MAE were classified as Killip Class I at admission (70% vs 85.1%, p = 0.024). Single-vessel coronary artery disease was less frequent in patients who developed MAE (22.5% vs 46.3%, p = 0.006), whereas three-vessel disease was more prevalent (40% vs 20.0%, p = 0.007). Anterior STEMI was present in 16 patients (40.0%) in the MAE group and 75 patients (42.9%) in the event-free group, with no statistically significant difference between groups (p= 0.741), indicating a balanced distribution of infarct location. These findings suggest that, in this cohort, infarct location alone did not significantly influence the risk of MAE, and that adverse outcomes were more closely related to infarct severity, extent of coronary artery disease, and early hemodynamic status, rather than anatomical localization.
Comprehensive echocardiographic evaluation was performed in all patients (Table 2). Compared with event-free patients, those who developed MAE exhibited a trend toward higher LV end-diastolic volume and lower LVEF, GLS, GWI, and GCW; however, these differences did not reach statistical significance. In contrast, GWE was significantly reduced in patients with MAE (83 ± 8% vs. 86 ± 7%, p = 0.022). Figure 1 illustrates MW analysis in a representative patient with anterior STEMI, demonstrating reduced GWI, GCW, and GWE, increased GWW, and impaired GLS (Figure 1).
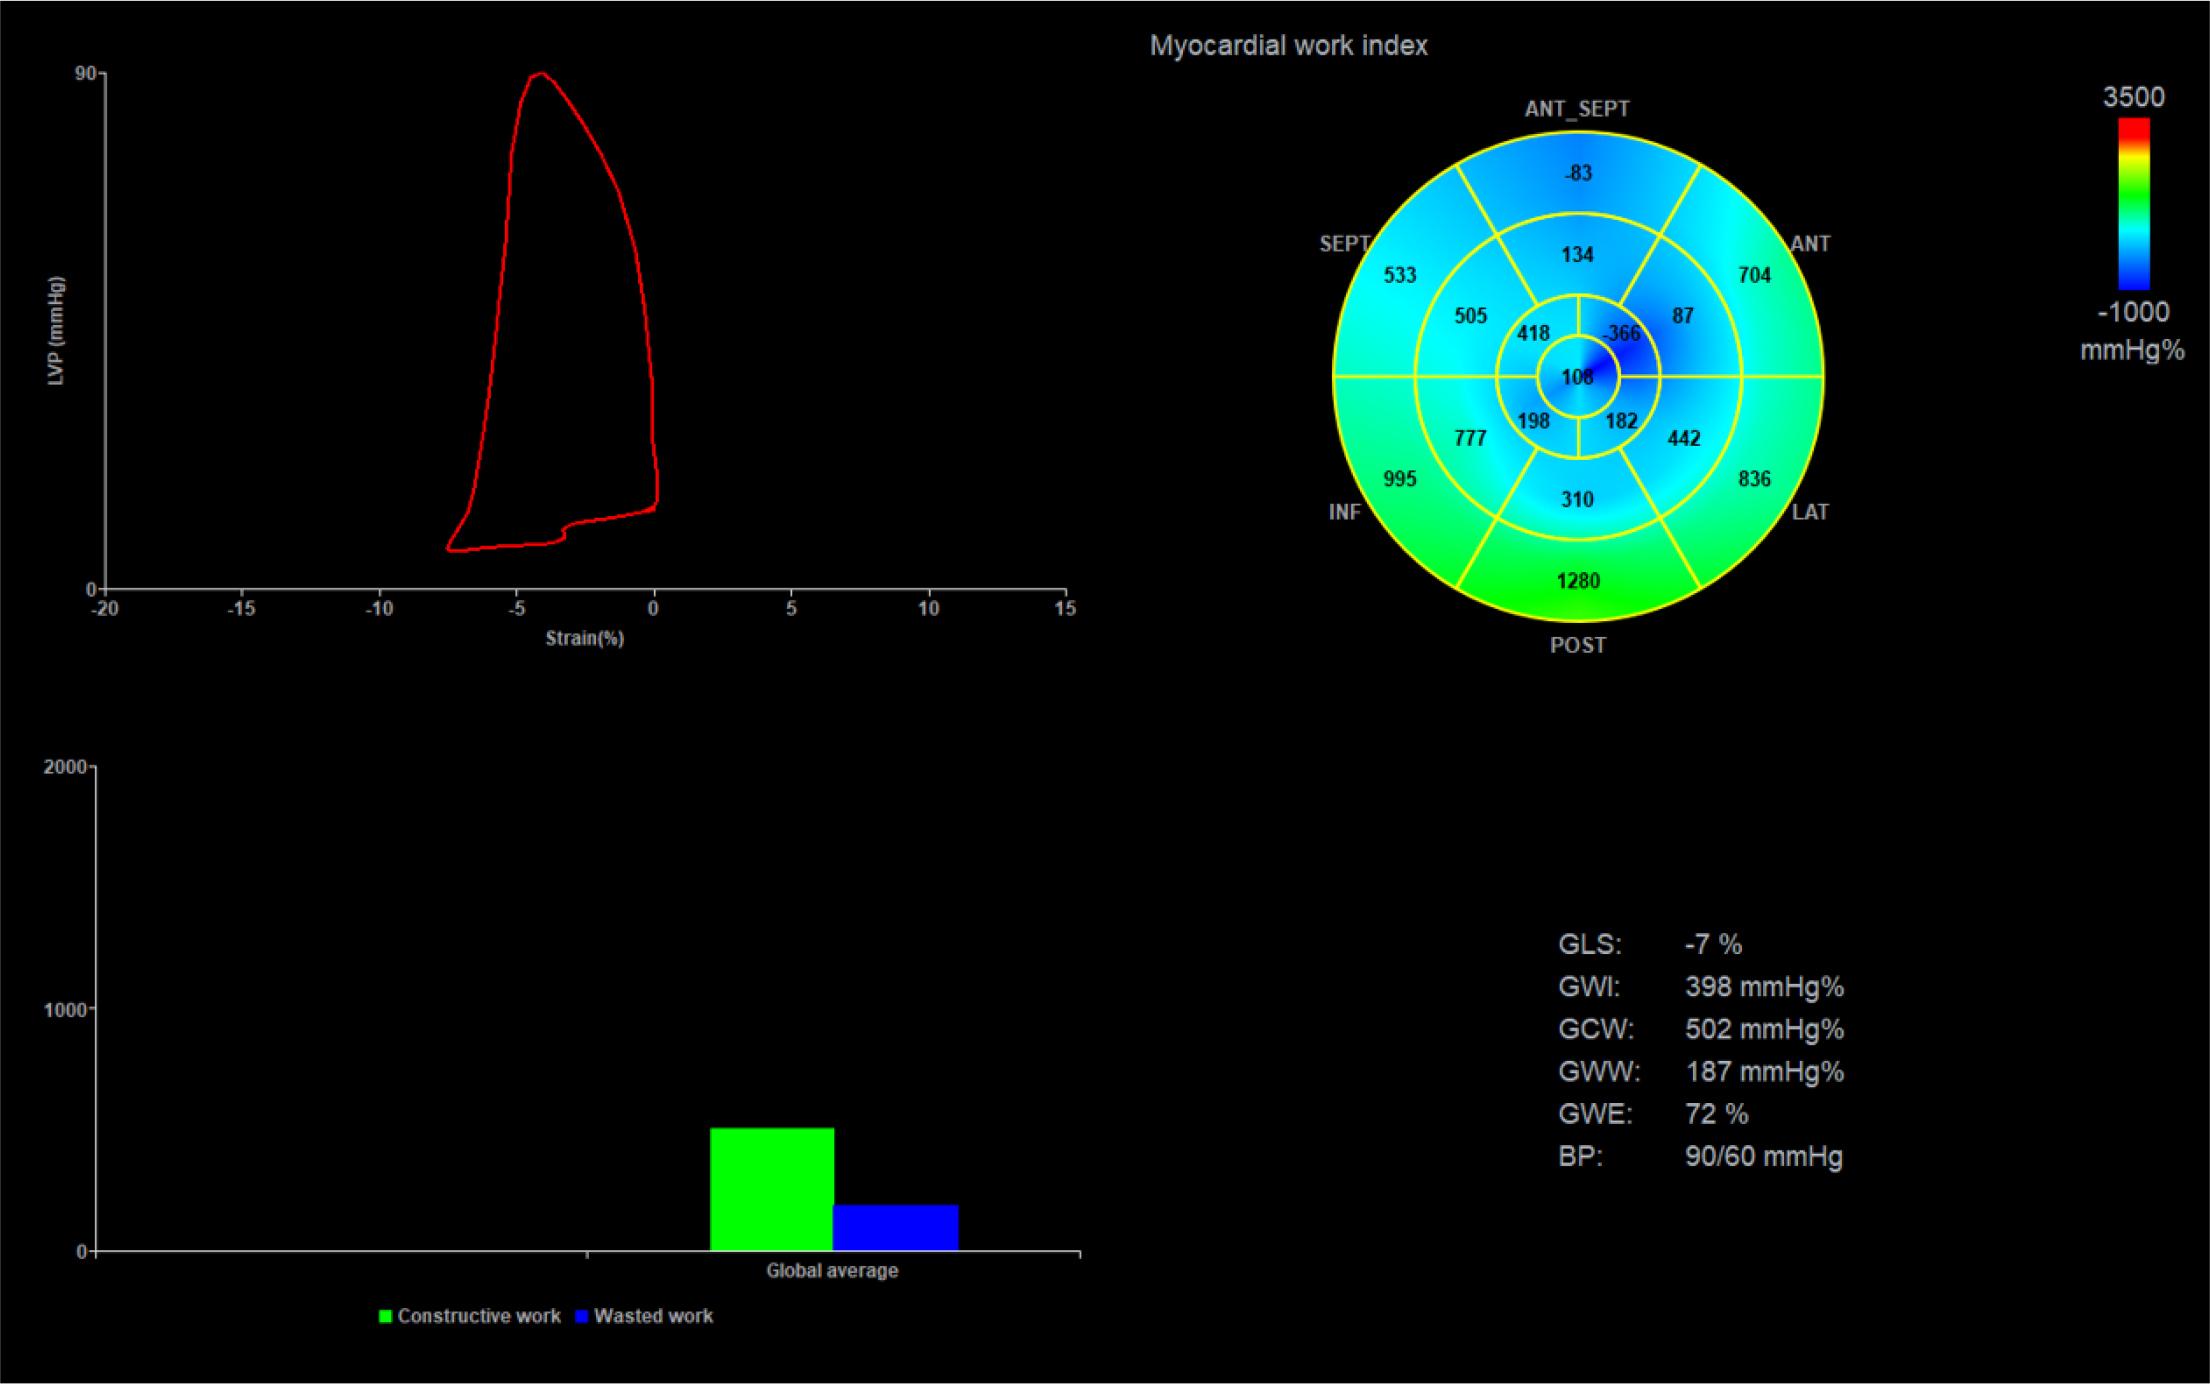
Myocardial work analysis in a patient with acute anterior myocardial infarction, showing reduced myocardial work indices (GWI, GCW, GWE), elevated GWW and impairment of GLS. Abbreviations: GLS, global longitudinal strain; GWI, global work index; GCW, global constructive work; GWE, global work efficiency; BP, blood pressure.
Transthoracic echocardiography results.
| Echocardiographic parameters | All (n = 215) | No events (n = 175) | MAE (n = 40) | P value |
|---|---|---|---|---|
| LVEDV, ml | 107 ± 26 | 108 ± 27 | 113 ± 30 | 0.276 |
| LVESV, ml | 65 (45–75) | 62 (52–73) | 60 (45–74) | 0.568 |
| LA diameter, mm | 40 ± 5.5 | 39 ± 4.9 | 40 ± 4.7 | 0.827 |
| LAVi, mL/m2 | 55.78 ± 19.86 | 29.55 ± 9.89 | 29.94 ± 10.10 | 0.785 |
| RV diameter, mm | 26 ± 3.0 | 25 ± 3.4 | 26 ± 3.9 | 0.212 |
| PASP, mmHg | 22 (21–31) | 21 (21–28) | 23 (18–30) | 0.324 |
| TAPSE, mm | 20 ± 2.8 | 26 ± 1.7 | 20 ± 3.8 | 0.466 |
| IVST, cm | 1.17 ± 0.15 | 1.20 ± 0.19 | 1.13 ± 0.15 | 0.370 |
| PWT, cm | 1.12 ± 0.12 | 1.14 ± 0.15 | 1.11 ± 0.17 | 0.279 |
| AV Pmax, m/s | 4.8 (4.0–7.0) | 5.2 (4.0–7.0) | 5.2 (4.0–6.1) | 0.236 |
| E wave, m/s | 0.64 ± 0.20 | 0.63 ± 0.19 | 0.64 ± 0.18 | 0.742 |
| A wave, m/s | 0.78 ± 0.18 | 0.76 ± 0.17 | 0.73 ± 0.19 | 0.467 |
| Mean E’, m/s | 0.06 ± 0.01 | 0.06 ± 0.01 | 0.06 ± 0.01 | 0.786 |
| E/E’ ratio | 10.57 (8.30–12.57) | 9.33 (7.69–12.15) | 10.61 (8.31–15.30) | 0.633 |
| Mean S’, m/s | 0.07 ± 0.01 | 0.07 ± 0.01 | 0.07 ± 0.01 | 0.125 |
| LVEF, % | 41 ± 6 | 43 ± 6 | 42 ± 6 | 0.708 |
| GLS, % | -12.21 ± 3.51 | -12.77 ± 3.3 | -11.75 ± 3.44 | 0.081 |
| MD, ms | 67.60 (54.40–83.33) | 67.80 (54.06–83.33) | 66.95 (51.25–83.57) | 0.123 |
| GWI, mmHg% | 1105 ±479 | 1210 ± 433 | 1077 ± 474 | 0.086 |
| GCW, mmHg% | 1293±493 | 1392 ± 437 | 1258 ± 448 | 0.084 |
| GWW, mmHg% | 139 (95–187) | 147 (90–187) | 126 (96–200) | 0.355 |
| GWE, % | 86 ± 8 | 86 ± 7 | 83 ± 8 | 0.022 |
Values are expressed as mean ± standard deviation or median (interquartile range). LVEDV, left ventricular end-diastolic volume; LVESV, left ventricular end-systolic volume; LA, left atrium; LAVi, left atrial volume index; RV, right ventricle; PASP, estimated pulmonary artery systolic pressure; TAPSE, tricuspid annular plane systolic excursion; IVST, end-diastolic interventricular septal thickness; PWT, end-diastolic posterior wall thickness; AV Pmax, aortic valve peak pressure gradient; E, peak early diastolic mitral flow velocity; A, late transmitral flow velocity; E’, mean peak early diastolic mitral annulus velocity; S’, mean peak systolic mitral annulus velocity; LVEF, left ventricular ejection fraction; GLS, global longitudinal strain; MD, mechanical dispersion; GWI, global work index; GCW, global constructive work; GWW, global wasted work; GWE, global work efficiency
In univariable Cox regression analysis, factors significantly associated with MAE included peak CK–MB levels (hazard ratio [HR] 1.001, 95% confidence interval [CI] 1.000–1.003; p = 0.008), hypertension (HR 0.499, 95% CI 0.265–0.941; p = 0.03), global work index (GWI; HR 0.999, 95% CI 0.998–1.000; p = 0.04), global constructive work (GCW; HR 0.999, 95% CI 0.998–1.000; p = 0.03), and global work efficiency (GWE; HR 0.811, 95% CI 0.688–0.955; p = 0.01). GLS and MD showed borderline associations with outcomes (GLS, p = 0.06; MD, p = 0.05).
In multivariable analysis adjusted for clinically relevant covariates, GWE remained independently associated with MAE. Specifically, each 5% decrease in GWE was associated with a 16.5% increase in the risk of adverse events (HR 0.835, 95% CI 0.693–0.985; p = 0.033) (Table3).
Cox regression analysis to evaluate the risk of major adverse events during follow-up.
| Univariable | Multivariable | ||||||
|---|---|---|---|---|---|---|---|
| Parameter | Unit interpretation | HR1 | 95% CI2 | P | HR | 95% CI | P |
| Age | per 1-year increase | 1.010 | 0.982–1.038 | 0.486 | 1.025 | 0.995–1.057 | 0.101 |
| Sex | Male/female | 0.493 | 0.193–1.258 | 0.139 | |||
| Peak CK-MB3 | per 100 U/L increase | 1.159 | 1.039–1.293 | 0.008 | 1.126 | 0.998–1.270 | 0.054 |
| Creatinine | per 1 mg/dL increase | 1.409 | 0.640–3.106 | 0.395 | |||
| Hypertension | Yes/No | 0.499 | 0.265–0.941 | 0.032 | 0.426 | 0.216–0.842 | 0.014 |
| LVEF4 | per 1% increase | 0.985 | 0.940–1.033 | 0.536 | |||
| GLS5 | per 1% increase | 1.096 | 0.996–1.207 | 0.060 | |||
| MD6 | per 10 ms increase | 1.115 | 1.000–1.242 | 0.050 | |||
| GWI7 | per 100 mmHg% increase | 0.922 | 0.854–0.996 | 0.040 | |||
| GCW8 | per 100 mmHg% increase | 0.922 | 0.854–0.996 | 0.039 | |||
| GWW9 | per 10 mmHg% increase | 1.018 | 0.992–1.045 | 0.177 | |||
| GWE10 | per 5% increase | 0.811 | 0.688–0.955 | 0.012 | 0.835 | 0.693–0.985 | 0.033 |
| LVEDV11 | per 1 mL increase | 1.007 | 0.996–1.018 | 0.188 | |||
| LAVi12 | per 1 mL/m2 increase | 1.004 | 0.974–1.035 | 0.792 | |||
| E/E’13 | per 1-unit increase | 1.024 | 0.959–1.092 | 0.480 | |||
HR: hazard radio
CI: confidence interval
Peak CK-MB: peak value of creatine-kinase isoform MB
LVEF: left ventricular ejection fraction
GLS: global longitudinal strain
MD: mechanical dispersion
GWI: global work index
GCW: global constructive work
GWW: global wasted work
GWE: global work efficiency
LVEDV: left ventricular end-diastolic volume
LAVi: left atrial volume index
E/E’: ratio of peak early diastolic mitral flow velocity and mean peak early diastolic mitral annulus velocity
The incremental prognostic value of GWE was assessed using likelihood ratio testing of nested Cox proportional hazards models. Covariates were selected based on clinical relevance and prior evidence, with their number restricted to minimize overfitting relative to the number of observed events. Multicollinearity was evaluated using VIF, with all values < 5, indicating acceptable independence among predictors. LVEF was included as the conventional echocardiographic measure of systolic function. GLS was not added due to its strong correlation with GWE (r = 0.762, p < 0.001), which could introduce multicollinearity and overfitting.
The baseline clinical model — including age, Killip class, and eGFR — yielded a –2 log-likelihood (–2LL) value of 390.809. The addition of LVEF resulted in a negligible reduction in –2LL(390.771), corresponding to a non-significant improvement in model fit (likelihood ratio X2 = 0.03, df = 1, p = 0.85). In contrast, inclusion of GWE led to a substantial decrease in –2LL to 385.870, reflecting a significant enhancement in model performance (likelihood ratio X2 = 4.90, df = 1, p = 0.02). These findings demonstrate that GWE provides independent and incremental prognostic information beyond conventional clinical and echocardiographic parameters (Figure 2).
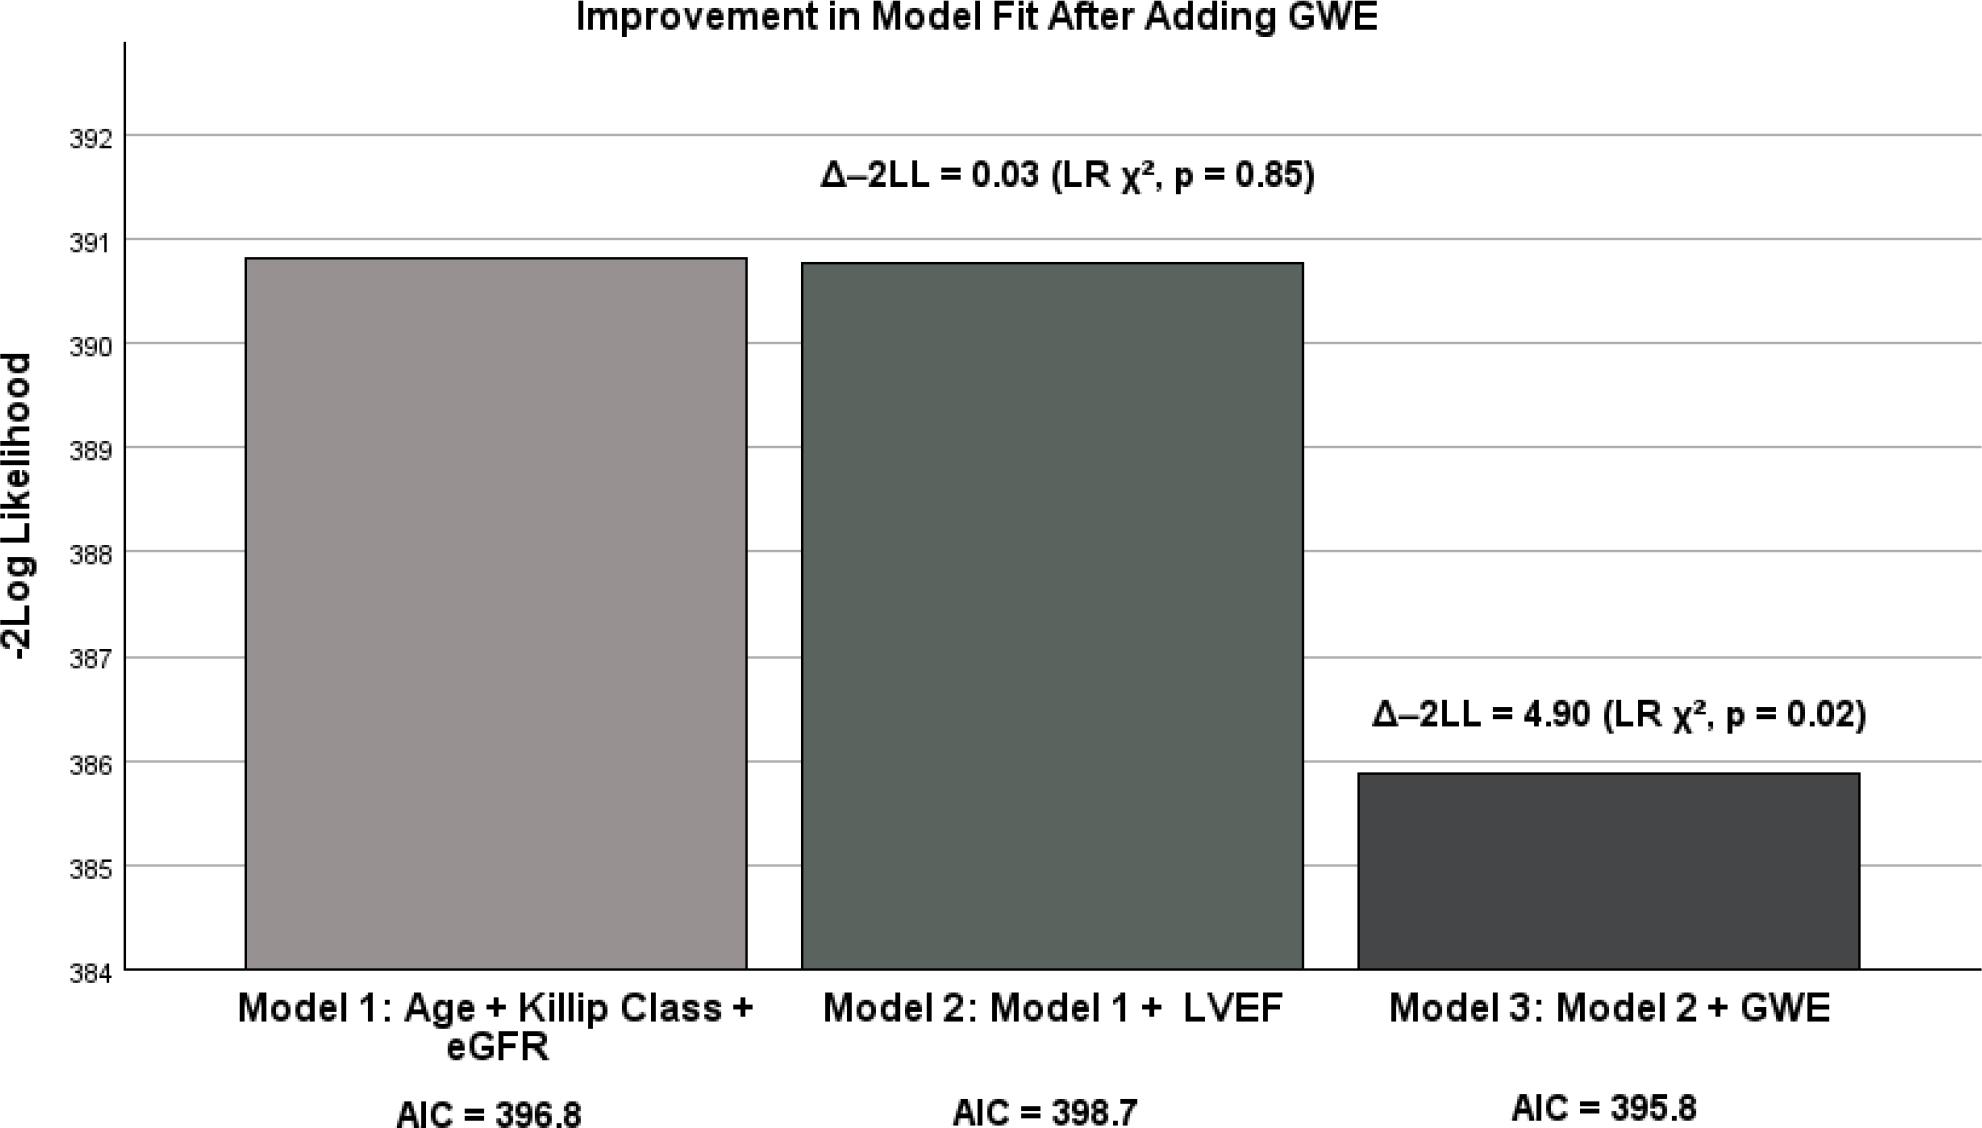
Incremental prognostic value of GWE for MAE. The bar chart shows –2 log likelihood for three sequential Cox models: the baseline clinical model (age, Killip class and eGFR), the model adding LVEF, and the model further including GWE. Data labels indicate the Akaike information criterion for each model. Addition of LVEF resulted in a minimal and non-signif¡cant improvement in model fit (likelihood ratio X2= 0.03, df =1, p = 0.85). Further inclusion of GWE produced a substantial reduction in –2LL, significantly improving model fit (likelihood ratio X2 = 4.90, df = 1, p = 0.02). GWE, global work efficiency; -2LL, -2 log likelihood; LR, likelihood ratio; eGFR, estimated glomerullar filtration rate; LVEF, left ventricular ejection fraction; AIC, akaike information criterion.
Model comparison using the AIC supported these results. The baseline clinical model had an AIC of 396.8, which increased slightly after adding LVEF (398.7), indicating no improvement in model quality. In contrast, incorporation of GWE reduced the AIC to 395.8, confirming improved model performance while maintaining parsimony (Figure 2).
Intra-observer reproducibility was excellent for all MW parameters, as reflected by high ICCs: 0.988 (95% CI: 0.969–0.995) for GWI, 0.987 (95% CI: 0.966–0.995) for GCW, 0.975 (95% CI: 0.936–0.990) for GWW, and 0.979 (95% CI: 0.946–0.992) for GWE. Likewise, interobserver agreement was consistently strong across myocardial work indices, with ICCs of 0.969 (95% CI: 0.923–0.987) for GWI, 0.963 (95% CI: 0.909–0.985) for GCW, 0.970 (95% CI: 0.928–0.988) for GWW, and 0.967 (95% CI: 0.921–0.987) for GWE.
Despite major advances in reperfusion strategies and secondary prevention, identifying patients at increased risk of adverse outcomes following STEMI remains challenging. Although the prognostic value of MW indices in STEMI patients has been reported in previous studies, a key strength of our study is the assessment of these parameters during the acute phase of myocardial infarction — immediately following PCI. This evaluation captures myocardial function before post-infarction remodeling or recovery processes occur, allowing for identification of high-risk patients at a stage when intervention and risk stratification may be most impactful. In this study, we demonstrate that GWE, a non-invasive MW parameter integrating LV deformation and afterload, independently predicts MAE in patients undergoing primary PCI. Importantly, GWE provided incremental prognostic value beyond established clinical predictors and conventional echocardiographic parameters, including LVEF. This underscores its potential role in post-infarction risk stratification.
Although LVEF and GLS remain widely used for prognostic assessment, their accuracy may be limited by loading conditions, particularly in the acute and early post-infarction phases [24,25]. In our cohort, GLS showed a trend toward prognostic significance but did not reach statistical significance, suggesting that while it may contribute complementary information, it may be less robust than MW-based parameters in this setting. Additionally, MD demonstrated a borderline association with MAE in univariable Cox regression (p = 0.05), consistent with previous studies linking higher MD to arrhythmic risk and adverse outcomes [26]. However, MD did not retain independent prognostic significance in our cohort; this may be explained by the limited number of arrhythmic events. While MD remains a useful marker of regional mechanical heterogeneity, its predictive value in this population appears modest, especially when integrated with other MW parameters such as GWI, GCW, and GWE. Future studies with larger event rates may clarify its role in risk stratification post-myocardial infarction. In contrast, GWE consistently emerged as the strongest echocardiographic predictor of outcome, supporting its ability to more comprehensively reflect myocardial performance by integrating deformation with afterload.
The pathophysiological relevance of GWE lies in its ability to quantify the efficiency of myocardial energy utilization by balancing constructive and wasted work [27]. A reduced GWE reflects impaired myocardial energetics, contractile inefficiency, and altered ventricular-arterial coupling — processes that are particularly salient following ischemic injury. Prior data have linked reduced GWE to microvascular dysfunction, adverse remodeling, and worse clinical outcomes — findings that are consistent with our observations [28].
Our results align with previous investigations demonstrating the prognostic value of MW parameters in patients with acute myocardial infarction. Coisne et al. [29] reported that GWE was the only echocardiographic parameter independently associated with long-term outcomes, despite echocardiographic assessment being performed later, after the acute event. Similarly, larger retrospective studies have shown that reduced GWE predicts long-term mortality in STEMI populations [30]. Although our follow-up was shorter and event composition differed (being driven largely by rehospitalizations rather than mortality), the consistency of these findings across diverse cohorts reinforces the robustness of GWE as a prognostic marker.
Though GWI and GCW were associated with adverse outcomes in univariable analyses, they did not retain independent predictive value in multivariable models. This suggests that GWE may capture the integrated efficiency of myocardial performance better than absolute work alone [31-34]. Interestingly, hypertension emerged as a seemingly protective factor. This is a finding likely reflecting treatment or selection bias, as patients with known hypertension are often more closely monitored and more likely to receive guideline-directed therapies. Similar paradoxical associations have been reported in previous cardiovascular studies and should be interpreted cautiously [35].
Taken together, our findings support the clinical relevance of GWE as a sensitive and reproducible marker for risk stratification following STEMI. Incorporating GWE into routine echocardiographic assessment may enhance the identification of high-risk patients and facilitate more personalized post-infarction management strategies.
Several limitations should be acknowledged. This was a single-center study with a moderate sample size, which may limit its generalizability. In addition, patients were enrolled only if they underwent PCI within 12 hours of symptom onset and had echocardiographic images of sufficient quality. This could have potentially led to excluding higher-risk patients, which may limit the applicability of our findings to the broader STEMI population. Furthermore, exclusion of individuals with severe valvular disease, LV outflow tract obstruction, pronounced R-R variability on electrocardiogram (including atrial fibrillation), and permanent pacemakers may reduce the applicability of our findings to such populations. Serial assessment of MW was not performed, precluding evaluation of temporal changes in myocardial efficiency. Additionally, the relatively short follow-up interval may have limited the detection of hard clinical endpoints such as mortality. Finally, speckle-tracking analysis remains operator-dependent, although standardized acquisition and blinded analysis were used to minimize variability.
Future multi-center studies with larger cohorts and longer followup periods are warranted to validate these findings and to explore the role of serial MW assessment in guiding therapy. Integration of MW indices into routine clinical workflows may ultimately enhance personalized risk stratification and improve outcomes in patients with STEMI.
In patients with STEMI undergoing PCI, GWE independently predicts MAE and provides incremental prognostic value beyond conventional clinical and echocardiographic parameters. Incorporation of MW analysis — particularly GWE — enhances early risk stratification and facilitates more accurate identification of patients at increased risk for adverse outcomes, and thus it has a potential role in guiding targeted post-infarction management strategies.