
Heart failure with preserved ejection fraction (HFpEF) is a complex clinical entity characterized by the presence of HF signs and symptoms due to elevated LV filling pressure, despite a normal or nearly normal left ventricular ejection fraction (LVEF) ≥ 50 percent. Over 50% of people with HF have preserved EF [1]. The incidence of HFpEF is rising, mainly because of the growing frequency of prevalent risk factors, such as advanced age, hypertension, renal impairment, and higher BMI. The diagnosis of HFpEF is often challenging and relies on a meticulous clinical examination, echocardiography with Doppler, speckle-tracking echocardiography (STE), and invasive hemodynamic measurements [2].
The right ventricle (RV) plays a critical role in determining functional capacity and prognosis across cardiovascular diseases. In HFpEF, increased left atrial pressure leads to post-capillary pulmonary hypertension, which imposes pressure overload on the RV, ultimately causing hypertrophy, fibrosis, and systolic dysfunction. Over time, chronic pulmonary hypertension causes structural changes in the pulmonary vessels, increasing their stiffness and further burdening the RV. Consequently, the RV itself undergoes pathological remodeling, including fibrosis, increased stiffness, and impaired cellular function, paralleling the changes observed in the LV [3].
The assessment of RV function ought to be included in every standard echocardiographic evaluation. The evaluation of RV size and function remains one of the most complex and technically demanding tasks in echocardiography [4].
STE has emerged as a crucial imaging modality in the evaluation of HFpEF. Traditional echocardiographic parameters often fail to detect subtle myocardial dysfunction in these patients. By measuring myocardial strain, particularly global longitudinal strain (GLS), STE offers a more sensitive assessment of left ventricular systolic function. Two-dimensional speckle-tracking echocardiography (2D-STE) is a precise and dependable method for diagnosing subtle myocardial dysfunction in individuals undergoing chemotherapy, as well as those with arterial hypertension, diabetes mellitus (DM), and ischemic heart disease, before observable alterations in conventional functional measures, like EF [5].
Recently, RV strain imaging has emerged as a sophisticated metric for assessing RV systolic function, overcoming the limitations of traditional echocardiographic measures.
Both Doppler tissue imaging and STE may be used to quantify RV longitudinal strain (RVLS). Speckle-tracking offers advantages over Doppler tissue imaging, including independence from the insonation perspective and enhanced repeatability [6].
The LV is a primary source of B-type natriuretic peptide (BNP), a neurohormone secreted by cardiac ventricles in response to increased wall stress. BNP is predominantly synthesized and released by ventricular myocytes when subjected to stretching caused by pressure overload or volume expansion. Its precursor, proBNP, plays a critical role in neurohormonal regulation, promoting natriuresis and diuresis to reduce cardiac preload and afterload. [7].
This work aimed to study the correlation between 2D STE-derived RV and right atrial strain with N-terminal pro-brain natriuretic peptide (NT-proBNP) level among individuals with HFpEF.
This prospective, single-center, case-control study was conducted at Menoufia University Hospital, Egypt, between January 2023 and December 2024. The study protocol was approved by the local ethics committee (Approval code: 4/2023 CARD 5), and all participants provided written informed consent.
Thirty-nine consecutive patients diagnosed with HFpEF and 20 healthy controls matched for age and sex were enrolled. In order to minimize selection bias, patients were recruited consecutively from the cardiology outpatient clinics and inpatient services during the study period.
Patient selection: The diagnosis of HFpEF was established in accordance with the 2022 American College of Cardiology/American Heart Association/Heart Failure Society of America (ACC/AHA/HFSA)’s guidelines [8]. Eligible participants were adults (> 18 years) presenting with signs and symptoms of heart failure and meeting the following conditions:
Preserved left ventricular ejection fraction (LVEF ≥ 50%) confirmed by two-dimensional transthoracic echocardiography (2D-TTE).
Evidence of cardiac dysfunction as the underlying cause of symptoms, including abnormal LV filling and elevated filling pressures assessed by Doppler and tissue Doppler imaging.
H2FPEF score ≥ 6, indicating high probability of HFpEF (criteria include BMI >30 kg/m2, hypertension on ≥ 2 medications, atrial fibrillation, pulmonary hypertension [PASP >35 mmHg], age > 60 years, and E/e′ > 9) [9].
Sample size: Based on prior literature demonstrating strong diagnostic performance of natriuretic peptides for right ventricular dysfunction (BNP >90 pg/mL; AUC = 0.943; 95% CI: 0.863–1.022), the sample size was calculated using Sample Size Pro software (version 6). Assuming a statistical power of 80% and a confidence level of 95%, the minimum required sample size was estimated to be 50 participants [7].
Exclusion criteria: Other cardiomyopathies; acute coronary syndrome; significant valvular disease (> mild); congenital heart disease; pericardial disease; chronic lung diseas;, end-stage renal or hepatic disease; and uncontrolled rapid atrial fibrillation.
Clinical laboratory assessment and electrocardiography (ECG): All enrolled participants underwent a comprehensive clinical evaluation, including detailed medical history-taking and a physical examination. Routine laboratory investigations to characterize the study population included complete blood count, liver function tests, glycated hemoglobin (HbA1c) and serum creatinine levels for renal function. A 12-lead surface ECG using ATM 300 cardio three-channel was performed to detect heart rhythm, arrhythmias, and ST and T-wave changes.
Echocardiography: Each subject was examined in the left lateral decubitus position connected to a single-lead ECG, as per the guidelines of the American Society of Echocardiography [10]. Standard two-dimensional transthoracic echocardiography (2D-TTE) was performed. At least three cardiac cycles were captured in cine loop format for the apical four-chamber view. To focus on the RV, the transducer was tilted slightly anteriorly (toward the patient’s right side) to bring the RV and RA into better view, as the RV is more anterior in the chest. The angle was adjusted to ensure the RV was not foreshortened and that its full size and function were visible.
Conventional 2D-TTE, Doppler study, and tissue Doppler imaging (TDI) were conducted using the Vivid 9 system (General Electric Healthcare, GE Vingmed, Norway) with a harmonic M5S transducer (1.7–4 MHz). Subsequently, 2D STE was performed utilizing EchoPAC BT 12, GE-Vingmed workstation software.
Conventional Echocardiography: 2D-TTE was used for assessing valve texture and morphology, LV and RV function, wall motion abnormalities, and RV and RA chamber dimensions. RV dimensions were measured in the apical four-chamber view, with three common sites comprising RV basal, mid, and longitudinal diameter. RA dimensions (septal-lateral and apico-basal diameters) were also measured in the apical four-chamber view. RA volume and volume index (RAVI) were not available for all participants, and thus were not included in the main analysis [11].
Left ventricular function and dimensions were assessed in the parasternal long-axis view using M-mode. Ejection fraction was automatically calculated by employing the formula EF% = (EDV – ESV) / EDV × 100. Left atrium (LA) and aortic root diameters were also measured in the parasternal long-axis view [12].
Tricuspid Annular Plane Systolic Excursion (TAPSE) has been used to assess RV function by measuring the longitudinal motion of the tricuspid annulus in the apical four-chamber view. A TAPSE of more than 17 mm is considered normal, and values < 14 mm have been associated with worse prognosis in HF populations [11]. By continuous wave Doppler (CW Doppler) analysis, pulmonary artery systolic pressure (PASP) was measured using the tricuspid regurgitation (TR) jet, as determined by the Bernoulli equation [13]. PW Doppler assesses the velocity of the blood flow throughout the mitral valve, including parameters such as early (E) and late (A) diastolic filling velocities, E/A ratio, and the deceleration time of the E-wave. These metrics provide insights into LV filling pressures and diastolic compliance.
TDI complements PW Doppler by evaluating the velocity of myocardial tissue motion, specifically the early diastolic velocity (e’) at the mitral annulus. The E/e’ lateral ratio is assessed by dividing the early diastolic mitral inflow velocity (E, from pulsed wave Doppler) by the early diastolic myocardial relaxation velocity at the lateral mitral annulus (e’, from TDI). It estimates LV filling pressures, which are a key non-invasive indicator of LV filling pressure that is often elevated in HFpEF due to impaired myocardial relaxation and greater stiffness. A reduced e’ velocity (< 8 cm/s lateral) indicates impaired myocardial relaxation. An E/e’ lateral between 8 and 14 suggests intermediate LV filling pressures, and an E/e’ lateral > 14 indicates elevated LV filling pressures consistent with HFpEF diastolic dysfunction [14].
2D speckle-tracking: 2D-STE was performed utilizing automated function imaging software (EchoPAC BT 12, GE-Vingmed). We traced the RV endocardial border in the apical four-chamber perspective. This view was selected to capture the RV free wall, septum, and right atrium in a single plane, providing a clear depiction of RV morphology and motion. Next, we carefully manually traced the RV endocardial border at end-diastole, defining the inner lining of the RV cavity from the tricuspid annulus along the free wall to the RV apex and back along the interventricular septum. The STE software tracked myocardial speckle patterns frame-by-frame across the cardiac cycle, calculating longitudinal strain as a percentage. The resulting strain curves and color-coded maps provided detailed insights into regional and global RV function. RV global longitudinal strain (GLS) was calculated using a six-segment model (three segments of free wall and three segments of septum).
For the RA, we traced the endocardium at max volume. Right before the tricuspid valve opened during early diastole, we manually traced the RA endocardial border, starting from one side of the tricuspid annulus, along the RA free wall, across the roof of the atrium, and back to the opposite annulus to calculate peak RA strain, which reflects reservoir function [14]. In patients with atrial fibrillation, right-atrial and right-ventricular strain measurements were obtained by averaging three consecutive cardiac cycles with stable R-R intervals, excluding premature beats. This approach minimizes the impact of beat-to-beat variability on speckle-tracking accuracy. Strain values are reported as absolute values.
Interobserver and intraobserver reproducibility were evaluated in a randomly-selected subset of 15 patients by two experienced echocardiographers blinded to clinical and biochemical data. Intraclass correlation coefficients (ICC) demonstrated excellent agreement for RV global longitudinal strain (interobserver ICC = 0.88, intraobserver ICC = 0.91) and for RA reservoir strain (interobserver ICC = 0.85, intraobserver ICC = 0.89).
Measurement of N-terminal pro-brain natriuretic peptide (NT-proBNP): Plasma samples were collected by venipuncture, and NT-proBNP levels were assessed using an Enzyme-Linked Immunosorbent Assay (ELISA) kit. The assay protocol involved adding 50 μL of standard, sample, or positive control, along with 25 μL of primary antibody and 25 μL of biotinylated peptide and incubating at room temperature for 2 hours. The plate was washed, and further reagents were added — including Streptavidin-Horseradish Peroxidase (SA-HRP) solution, Tetramethylbenzidine substrate solution, and 2 M HCl — to terminate the reaction. Absorbance at 450 nm was assessed, and NT-proBNP concentration was determined by constructing a standard curve using known concentrations. The NT-proBNP level was then calculated by comparing the sample’s optical density with the standard curve [14].
Statistical analysis: Statistical analysis was performed using SPSS version 26 (IBM Corp., Chicago, IL, USA). Normality of continuous variables was assessed using the Shapiro-Wilk test and visual inspection of histograms. Normally-distributed variables were expressed as mean ± standard deviation (SD) and compared between groups using the unpaired Student’s t-test, whereas non-normally distributed variables were summarized as median (interquartile range, IQR) and compared using the Mann-Whitney U test. Categorical variables were presented as frequencies and percentages and analyzed using the chi-square test or Fisher’s exact test, as appropriate. Correlation analyses were performed using Pearson’s correlation coefficient for variables with approximately normal distribution. The ROC curve was used to evaluate diagnostic performance, including sensitivity, specificity, positive predictive value (PPV), and negative predictive value (NPV). A two-tailed P value < 0.05 was considered statistically significant [15].
The HFpEF group demonstrated significantly higher values for both body mass index (BMI) and total cholesterol compared to the control group. Both groups were matched for age and sex, and no statistically significant differences were observed in comorbidities, including smoking, hypertension, or diabetes mellitus.
AF was significantly more prevalent in the HFpEF group, where it was observed in 38.5% of patients. All individuals in the control group, by comparison, exhibited normal sinus rhythm (p = 0.001). Conventional echocardiographic assessment revealed that patients with HFpEF demonstrated significantly higher values than those in the control group, including interventricular septal thickness (IVSd: 1.3 ± 0.24 cm vs. 0.82 ± 0.12 cm, p < 0.001), LV posterior-wall thickness (LVPWd: 1.2 ± 0.2 cm vs. 0.8 ± 0.1 cm, p < 0.001), LA diameter (39.41 ± 8.8 mm vs. 30.66 ± 8.2 mm, p < 0.001), E/e’ ratio (12.91 ± 2.02 vs. 6.7 ± 1.79, p < 0.001), PASP: 43.57 ± 11.03 mmHg vs. 22 ± 5 mmHg, p < 0.001).
In contrast, patients with HFpEF exhibited significantly lower values compared to controls in LV internal diameter in diastole (LVIDd: 4.7 ± 0.3 cm vs. 5.2 ± 0.3 cm, p < 0.001); E-wave velocity (82 ± 15 cm/s vs. 95 ± 13 cm/s, p < 0.001), lateral e’ velocity (6.5 ± 0.6cm/s vs 14 ± 3 cm/s, p < 0.001); MAPSE (1.56 ± 0.15 cm vs. 2.25 ± 0.21 cm, p < 0.001); and TAPSE (1.72 ± 0.23 cm vs. 2.23 ± 0.21 cm, p < 0.001). No statistically significant differences were found between the HFpEF and control groups in LV internal diameter in systole, end-diastolic volume, stroke volume, fractional shortening, ejection fraction, or aortic root diameter.
The HFpEF group demonstrated significantly larger RA dimensions compared to controls, including both septal-lateral (3.7 ± 0.5 cm vs. 3.4 ± 0.2 cm, p = 0.001) and apico-basal diameters (4.6 ± 0.6 cm vs. 4.2 ± 0.4 cm, p = 0.003). In contrast, RV size assessed at the basal, mid, and longitudinal levels did not differ significantly between groups. Notably, strain analysis revealed that the following were significantly reduced in patients with HFpEF compared with controls: RV free-wall strain (19.6 ± 7.33% vs. 28 ± 4.31%, p < 0.001); septal-wall strain (15.2 ± 3.49% vs. 32.5 ± 5.93%, p < 0.001); global longitudinal strain 16.79 ± 3.96% vs. 25.35 ± 1.89%, p < 0.001); and RA strain (20.94 ± 8.78% vs. 39.95 ± 2.03%, p < 0.001). Additionally, NT-proBNP levels were markedly elevated in the HFpEF group (610 ± 15.6 pg/mL, vs. 103 ± 7 pg/mL, p < 0.001 for the control group).
Distribution of demographic and cardiovascular risk factors among the studied groups.
| HFpEF Group (N = 39) | Control Group (N = 20) | P | ||
|---|---|---|---|---|
| Age (years) | 52.7 ± 8.6 | 48.5 ± 10.6 | 0.106 | |
| Sex | Male | 10 (25.6%) | 4 (20%) | 0.63 |
| Female | 29 (74.4%) | 16 (80%) | ||
| BMI (kg/m2) | 23.27 ± 1.5 | 22.13 ± 1.4 | 0.006* | |
| Total Cholesterol (mg/dL) | 182.56 ± 16.4 | 167.5 ± 11.5 | 0.001* | |
| Comorbidities | Smoking | 6 (15.4%) | 0 (0%) | 0.064 |
| Hypertension | 5 (12.8%) | 0 (0%) | 0.094 | |
| Diabetes Mellitus | 4 (10.2%) | 0 (0%) | 0.138 | |
Data is presented as mean ± SD or frequency (%).
Significant p value < 0.05. BMI: Body mass index, HFpEF: heart failure with preserved ejection fraction
Heart rhythm and conventional echocardiographic parameters in the studied groups.
| HFpEF Group (N = 39) | Control Group (N = 20) | P | ||
|---|---|---|---|---|
| ECG | AF | 15 (38.5%) | 0 (0%) | 0.001* |
| Sinus Rhythm | 24 (61.5%) | 20 (100%) | ||
| IVSd (cm) | 1.3 ± 0.24 | 0.82 ± 0.12 | < 0.001* | |
| LVIDd (cm) | 4.7± 0.3 | 5.2 ± 0.3 | < 0.001* | |
| LVIDs (cm) | 3.01 ± 0.3 | 3.1 ± 0.2 | 0.367 | |
| LVPWd (cm) | 1.2 ± 0.2 | 0.8 ± 0.1 | < 0.001* | |
| EDV (ml) | 102.2 ± 31.4 | 114.6 ± 25.6 | 0.133 | |
| EF (%) | 66.17 ± 5.89 | 66.4 ± 4.48 | 0.884 | |
| SV (ml) | 80 ± 8.7 | 75.15±15.3 | 0.12 | |
| Conventional echocardiography | FS (%) | 36.48 ± 4.7 | 36.5 ± 2.9 | 0.991 |
| LA diameter (mm) | 39.41± 8.8 | 30.66 ± 8.2 | < 0.001* | |
| Ao (mm) | 30.4 ± 7.1 | 27.05 ± 6.09 | 0.07 | |
| e’ lateral (cm/s) | 6.5 ± 0.6 | 14 ± 3 | < 0.001* | |
| E (cm/s) | 82 ± 15 | 95 ± 13 | < 0.001 | |
| E/e’ | 12.91 ± 2.02 | 6.7 ± 1.79 | < 0.001* | |
| MAPSE (cm) | 1.56 ± 0.15 | 2.25 ± 0.21 | < 0.001* | |
| TAPSE (cm) | 1.72 ± 0.23 | 2.23 ± 0.21 | < 0.001* | |
| PASP (mmHg) | 43.57± 11.03 | 22± 5 | < 0.001 | |
Data is presented as mean ± SD or frequency (%). P value < 0.05 is statistically significant. AF: Atrial fibrillation; Ao: Aortic diameter; EDV: End-diastolic volume; E/e’: Ratio of early diastolic velocity to early diastolic filling; EF: ejection fraction; FS: Fractional shortening; HFpEF: Heart failure with preserved ejection fraction; IVSd: Interventricular septal thickness in diastole; LA: Left atrium; LVIDd: Left ventricular internal diameter in diastole; LVIDs: Left ventricular internal diameter in systole; LVPWd: Left ventricular posterior wall thickness in diastole; MAPSE: Mitral annular plane systolic excursion; PASP: Pulmonary artery systolic pressure; SV: Stroke volume; TAPSE: Tricuspid annular plane systolic excursion; e’: Early diastolic velocity.
Right ventricular and right atrial diameters and strain parameters, together with N-terminal pro-brain natriuretic peptide (NT-proBNP) level, among the studied groups.
| HFpEF Group (N=39) | Control Group (N=20) | P> | |
|---|---|---|---|
| RV basal diameter (cm) | 3.13 ± 0.54 | 3.26 ± 0.63 | 0.43 |
| RV mid diameter (cm) | 2.56 ± 0.53 | 2.78 ± 0.58 | 0.15 |
| RV longitudinal diameter (cm) | 5.59 ± 0.76 | 5.34 ± 0.69 | 0.21 |
| RA septal-lateral diameter (cm) | 3.7 ± 0.5 | 3.4 ± 0.2 | 0.001* |
| RA apico-basal diameter (cm) | 4.6 ± 0.6 | 4.2 ± 0.4 | 0.003* |
| Right ventricle longitudinal strain | |||
| RV free wall % | 19.6 ± 7.33 | 28 ± 4.31 | < 0.001* |
| RV septal wall % | 15.2 ± 3.49 | 32.5 ± 5.93 | < 0.001* |
| RV GLS % | 16.79 ± 3.96 | 25.35 ± 1.89 | < 0.001* |
| Right atrial strain % | 20.94 ± 8.78 | 39.95 ± 2.03 | < 0.001* |
| NT-proBNP pg./ml | 610 ±15.6 | 103 ±7 | < 0.001* |
Data is presented as mean ± SD. P value ˂0.05 is statistically significant. HFpEF: Heart failure with preserved ejection fraction; RV: Right ventricle; GLS: global longitudinal strain; RV: Right ventricle; NT-proBNP: N-terminal pro-brain natriuretic peptide.
NT-proBNP levels were strongly negatively correlated with RA strain (r = –0.739, p < 0.001), RV free-wall strain (r = –0.505, p < 0.001), RV septal-wall strain (r = –0.849, p < 0.001), and RV GLS (r = –0.737, p < 0.001).
Receiver operating characteristic (ROC) curve analysis demonstrated that NT-proBNP is a highly accurate biomarker for predicting HFpEF. A cutoff value of 383 pg/mL yielded an area under the curve (AUC) of 0.95, with a sensitivity of 96%, specificity of 94%, positive predictive value (PPV) of 97%, and negative predictive value (NPV) of 92%.
HF affects 2–3% of the population, with HFpEF making up to 50% of cases [16]. Its increasing prevalence poses significant public health problems, including increased mortality, frequent hospital admissions, diminished quality of life, and significant healthcare expenditures [1]. In HFpEF, LV diastolic dysfunction raises LA pressure, leading to post-capillary PH. This increases RV afterload, causing RV hypertrophy and eventual dysfunction. Chronic PH also promotes pulmonary vascular remodeling, further straining the RV. Over time, the RV develops fibrosis, stiffness, and impaired function, mirroring changes seen in the LV [1].
Reduced RVGLS via 2D-STE in HFpEF patients has been extensively studied as an independent indicator of poor prognosis, as it is linked to increased risks of hospitalization, as well as arrhythmia, heart transplant, and mortality [1].
In our study, assessments conducted via 2D STE for RV free-wall and septal-wall, as well as RVGLS and right atrial strain, showed a substantial decrease in the values of these indices in the HFpEF group compared to the control group.
Correlations between NT-proBNP and RV longitudinal and RA strain in the studied group.
| NT-proBNP pg./ml | ||
|---|---|---|
| r | P | |
| RA strain % | -0.739 | < 0.001* |
| RV longitudinal strain % | ||
| RV free-wall % | -0.505 | < 0.001* |
| RV septal-wall % | -0.849 | < 0.001* |
| RV GLS % | -0.737 | < 0.001* |
r: Pearson correlation. P value < 0.05 is statistically significant. RV: right ventricle, RA: right atrium, NT-proBNP: N-terminal pro-brain natriuretic peptide, GLS: global longitudinal strain.
A study conducted by Elsayed et al. [16] revealed that RVGLS has the potential to aid in the detection of HFpEF patients at high risk for poor outcomes, even in the absence of significant differences in RV dimensions between HFpEF and control groups. It was found to be useful for predicting worse clinical outcomes in individuals with HFpEF. Consistent with our findings, Pastore et al. [18] demonstrated that RV strain was correlated with mortality and cardiovascular conditions among individuals with HFpEF and might offer essential supplementary prognostic information. These results underscore the potential utility of free-wall right-ventricle longitudinal strain in clinical settings for enhancing risk classification and treatment for individuals with HF, irrespective of LVEF. In support of our conclusions, Lejeune et al. [16] demonstrated that STE RVGLS was significantly different in individuals with HFpEF compared to controls, and that impaired RVGLS has predictive significance in individuals with HFpEF.
Our work showed that in the HFpEF group, the IV-wall thickness (indicated by IVSd and LVPWd) was significantly higher compared to the controls, in addition to LV filling pressure (E/e’), LA diameter, and PASP. Conversely, LVIDd and e’ were found to be lower in the HFpEF group vs. the control group. Additionally, no substantial variations were observed in LVIDs, EF%, or FS%. This is consistent with the findings of Lan et al. [18], who demonstrated that the HFpEF cohort had significantly larger LA diameters, IVSd, LVPWd, and E/e’ values compared to the controls.
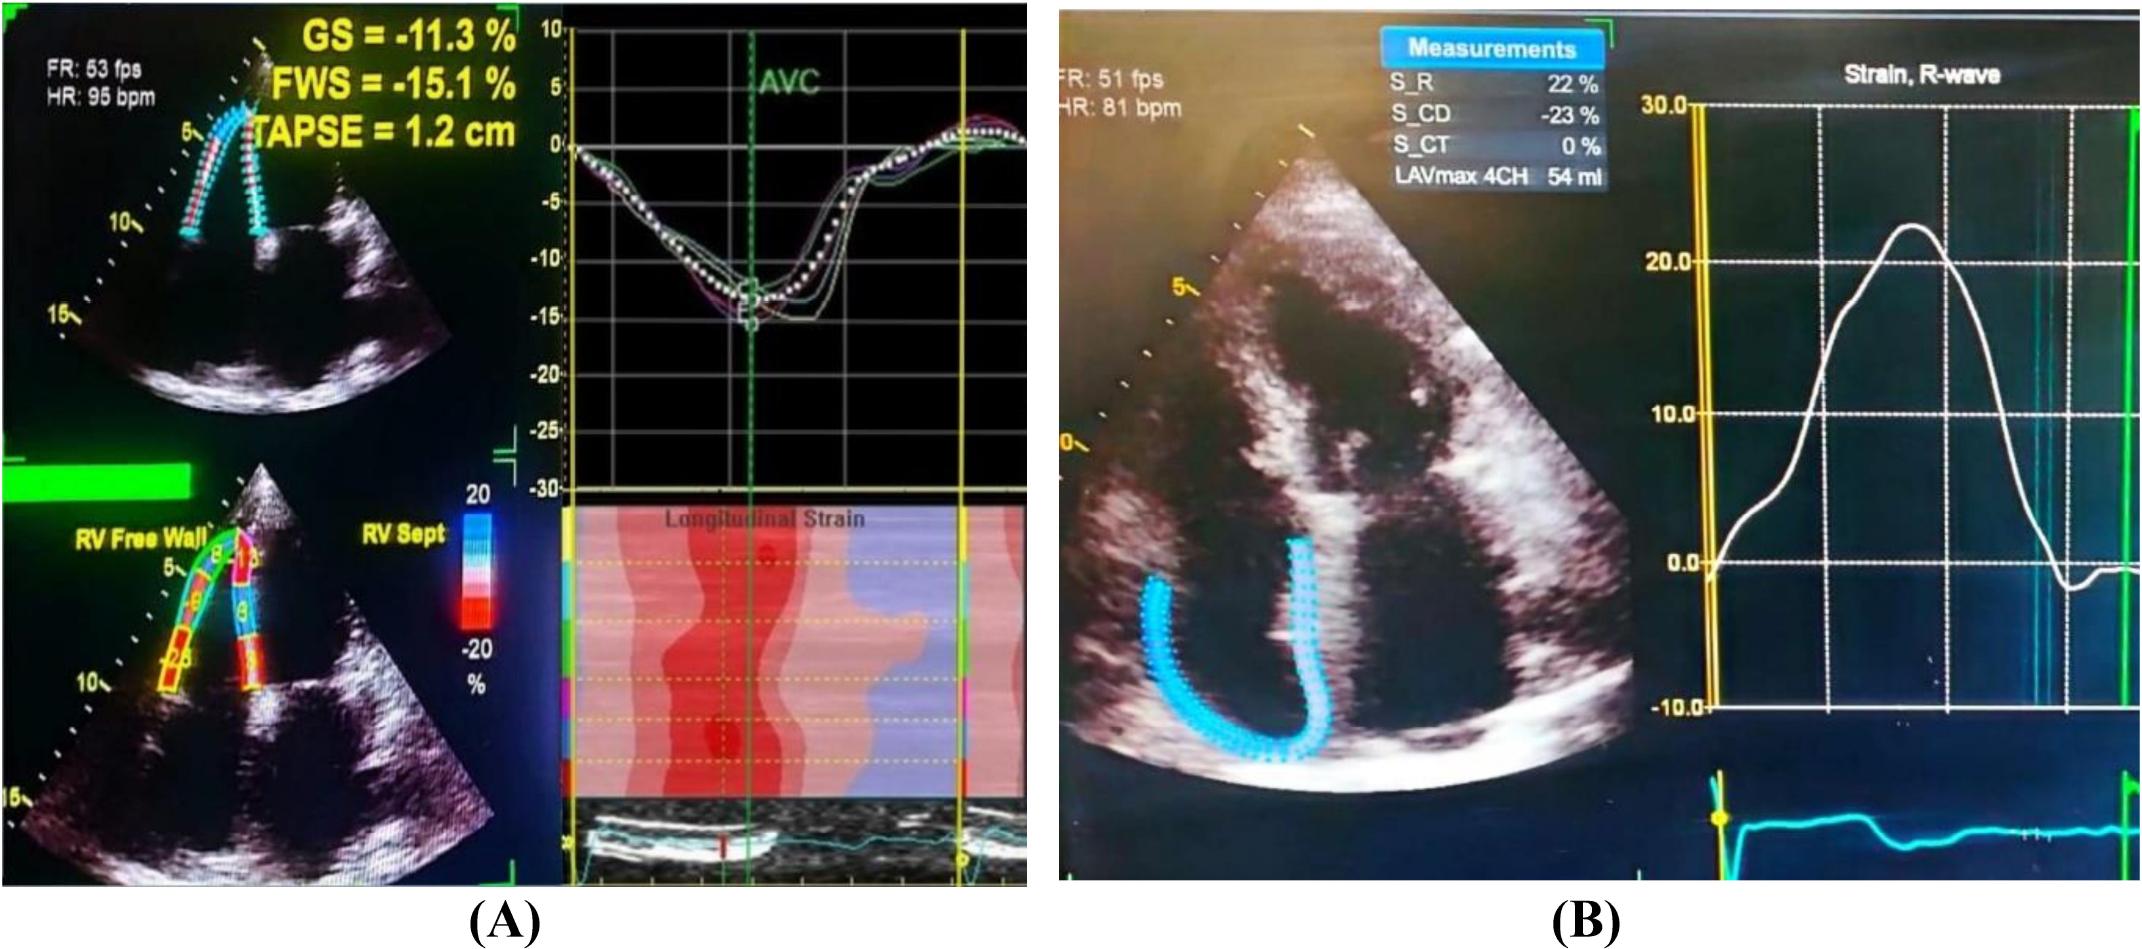
(A) Right ventricular strain analysis: GS: 11.3%, FWS: 15.1%, TAPSE: 1.2 cm (all below normal), HR: 95 bpm, FR: 53 fps. Right panel shows longitudinal strain curve and color-coded strain map (red = higher strain, blue = lower strain). (B) Right atrial strain analysis: HR: 81 bpm, FR: 51 fps, peak strain: 22%, S_CD: 23%, S_CT: 0%, RAVmax: 54 ml. Right panel displays strain rate curve with peak at 22%. Abbreviations: GS = global strain; FWS = free-wall strain; TAPSE = tricuspid annular plane systolic excursion; FR = frame rate; HR = heart rate; S_CD = strain at end-diastole; S_CT = strain at end-systole; RAVmax = maximum RA volume in 4-chamber view.
ROC curve of NT-proBNP in the prediction of HFpEF.
| AUC | Cutoff | Sensitivity | Specificity | PPV | NPV | 95% CI | ||
|---|---|---|---|---|---|---|---|---|
| Lower | Upper | |||||||
| NT-Pro-BNP | 0.95 | 383 | 96% | 94% | 97% | 92% | 0.93 | 0.97 |
AUC: Area under the cdurve; PPV: Positive predictive value; NPV: Negative predictive value; CI: Confidence interval, NT-proBNP: N-terminal pro-brain natriuretic peptide.
Conversely, no notable discrepancies were observed in SV or EF% between the two groups. Additionally, Sidhu et al. [19] found that the E/e’ ratio and PASP were significantly higher in the HFpEF group compared to the controls. However, no substantial variation existed in EF% among the HFpEF group and the controls.
In our study, no significant differences were observed in RV basal, mid, or longitudinal diameters among the studied groups. RA septal-lateral diameter and RA apico-basal diameter were higher in the HFpEF group compared to the controls. Supporting our findings, Schönbauer et al. [20] reported that RA volumes were higher in HFpEF and linked to worse clinical outcomes, highlighting the prognostic significance of RA enlargement in this patient population.
In our study, levels of NT-proBNP were substantially raised in the group of patients diagnosed with HFpEF compared to the control group. This outcome reveals that NT-proBNP might play a crucial role as a biomarker for identifying the presence of HFpEF. Similarly, Eidizadeh et al. [21] found that NT-proBNP levels were substantially greater in the HFpEF group compared to the control group. Validating our findings, Farajidavar et al. [22] also demonstrated that NT-proBNP levels were elevated among individuals with HFpEF compared to the control group.
In the present study, we observed a strong correlation between NT-proBNP levels and both right ventricular and right atrial strain parameters. This statistically significant association reflects the increased myocardial wall stress and mechanical deformation of the right heart in patients with HFpEF.
Understanding these relationships provides important insights into the pathophysiology of HFpEF — a condition characterized by increased myocardial stiffness and reduced ventricular compliance that leads to impaired cardiac filling and performance [23]. HFpEF markedly impairs right heart mechanics, primarily due to increased afterload from post-capillary pulmonary hypertension, reduced myocardial compliance, and altered ventricular-atrial interaction driven by systemic and pulmonary vascular changes [24]. These alterations increase myocardial wall stress, resulting in neurohormonal activation with subsequent NT-proBNP release and impaired right atrial deformation [25]. NT-proBNP is a well-established biomarker of ventricular wall stress in adults with heart failure [26].
The NT-proBNP cutoff value of 383 pg/mL demonstrated excellent diagnostic performance in the present study and is consistent with ranges reported in previous HFpEF studies and current guideline recommendations. Although no universal NT-proBNP cutoff exists for HFpEF, this value falls within commonly-used thresholds in clinical practice, supporting its clinical relevance. NT-proBNP concentrations are influenced by several clinical factors, including atrial fibrillation, renal function, and metabolic status. In our cohort, atrial fibrillation was more prevalent among patients with HFpEF and may have contributed to higher NT-proBNP levels as well as altered strain measurements. Renal and metabolic status were assessed using serum creatinine and HbA1c; however, due to the exploratory nature and relatively limited sample size of this study, multivariable adjustment was not performed, and residual confounding thus cannot be ruled out.
In line with previously reported associations between left ventricular strain and natriuretic peptides in HFpEF, a similar relationship between right ventricular strain and NT-proBNP is therefore expected. Our findings suggest that this association may have important clinical implications for the assessment of right heart involvement in HFpEF. Supporting our results, Dsouza et al. [27] demonstrated that elevated filling pressures and the severity of diastolic dysfunction are associated with increased BNP or NT-proBNP levels, which serve as reliable prognostic markers. Similarly, Inciardi et al. [28] reported that impaired right ventricular free-wall strain was associated with higher circulating NT-proBNP levels and an increased risk of heart failure hospitalization and cardiovascular mortality.
In the present study, it was observed that individuals within the HFpEF group exhibited higher BMI and total cholesterol levels compared to their counterparts in the control group. In line with our findings, Lan et al. [18] also reported that BMI was substantially elevated in their HFpEF group compared to the controls. Recent evidence from Amdahl et al. [29] suggests that higher BMI is commonly associated with HFpEF, and Reddy et al. [19] explicitly addresses BMI as a key clinical variable in the diagnosis of HFpEF. Additionally, Eidizadeh et al. [21] found in their research that HFpEF patients had a higher BMI (e.g., mean BMI ~30 kg/m2) compared to healthy individuals, reflecting the prevalence of higher BMI in HFpEF.
Our study demonstrated a notably high prevalence of atrial fibrillation (AF) among HFpEF patients compared to controls, with 38.5% of HFpEF patients presenting with AF. This finding is consistent with prior literature identifying AF as a frequent comorbidity in HFpEF, and highlights AF’s potential impact on cardiac hemodynamics, right atrial function, and biomarker interpretation. AF may influence both strain measurements and NT-proBNP levels. Although we implemented a standardized approach for strain assessment in AF patients by averaging three consecutive cardiac cycles with stable RR intervals, subgroup analysis was not feasible due to the limited sample size. Supporting our findings, Ariyaratnam et al. [30] demonstrated that the diagnosis of HFpEF may identify patients with AF who could potentially benefit from new therapies for HFpEF. Similarly, Chieng et al. [31] noted that AF frequently co-occurs with HFpEF.
Limitations of the study: This single-center, prospective study included a relatively small sample, and this limits its statistical power, subgroup analyses, generalizability, and external applicability.
Interobserver and intraobserver reproducibility were assessed in a subset of patients that may not fully capture the variability of the entire cohort. Right atrial volume index (RAVI), RV ejection fraction (RVEF), and 3D speckle-tracking echocardiography (3D STE) which are considered more comprehensive measures of atrial and ventricular remodeling, were not routinely available in all participants. Future studies incorporating volumetric assessment may provide further insights. Longitudinal data would help assess how these biomarkers and echocardiographic parameters evolve in HFpEF patients. This study also did not account for potential confounders, such as comorbidities like diabetes, hypertension.
Treatment variations among HFpEF patients may have also introduced variability in echocardiographic parameters and NT-proBNP levels. The influence of AF on RA strain and NT-proBNP could not be fully addressed, and NT-proBNP may also be affected by renal dysfunction. Additionally, subgroup analysis and multivariable adjustment were not performed due to sample size limitations.
In this study, elevated NT-proBNP levels were significantly associated with impaired RA and RV strain, indicating right heart dysfunction and neurohormonal activation in HFpEF. A cutoff value of 383 pg/mL demonstrated excellent diagnostic performance (AUC = 0.95, sensitivity = 96%, specificity = 94%). Based on these findings, we recommend RA and RV strain assessment via STE in patients exceeding this threshold, as this information can facilitate early detection of subclinical right heart involvement and enhance risk stratification.