
Table 1
Comparative Analysis with QAOS Protocol: two cases of patients with pacemakers.
 | Case A Male, 85 years old Ischaemic heart disease | Case B Male, 68 years old Non-ischaemic heart disease | ||
|---|---|---|---|---|
| Heart failure symptoms? | NYHA Class II | NYHA Class II | ||
| RV pacing % | 62.3% | 55% | ||
| Heart Rythm | Native Sinus | VVI | Native Atrial Fib. | VVI |
| LVEF (%) | 58% | 56% | 48% | 37.9% |
| Global Longitudinal Strain (%) | -16.4% | -12.5% | -24.2% | -15.5% |
| QAOS Step 1: Septal flash? (Yes/No/Not evaluable) | No | Yes | No | Yes |
| QAOS Step 2: LVOT area (cm2) | 2.27 cm2 | 3.14 cm2 | ||
| QAOS Step 3: VD pre-expulsive period (ms) | 55 ms | 116 ms | 88 ms | 94 ms |
| QAOS Step 4: LV pre-expulsive period (ms) | 87 ms | 176 ms | 88 ms | 138 ms |
| QAOS Step 5: Interventricular delay (ms) | 32 ms | 60 ms | 0 | 44 ms |
| Interventricular synchrony? (Y/N) | Yes | No | YES | No |
| QAOS Step 6: LVOT VTI (cm) | 25.2 cm | 14.5 cm | 17 cm | 14 cm |
| LV stroke volume (ml) | 56 ml | 32 ml | 51.5 ml | 44 ml |
| QAOS Step 7: Rocking apex: (Yes/No/Not evaluable) | No | Yes | NO | Yes |
| Intraventricular synchrony? (Y/N) | YES | No | YES | NO |
| QAOS Step 8: R–R interval (ms) | 1005 ms | 1000 ms | 822 | 740 ms |
| QAOS Step 9: Mitral diastolic flow duration (ms) | 614 ms | 382 ms | 391 | 254 ms |
| QAOS Step 10: Mitral diastolic flow duration ÷ R–R: (%) | 61.1% | 38.2% | 47.6% | 34.3% |
| A-V Synchrony? (Yes/No) | Yes | No | Yes | No |
| Can PIC be diagnosed? | NO | YES | ||
| Is there a need for a pacemaker upgrade? | NO | YES | ||
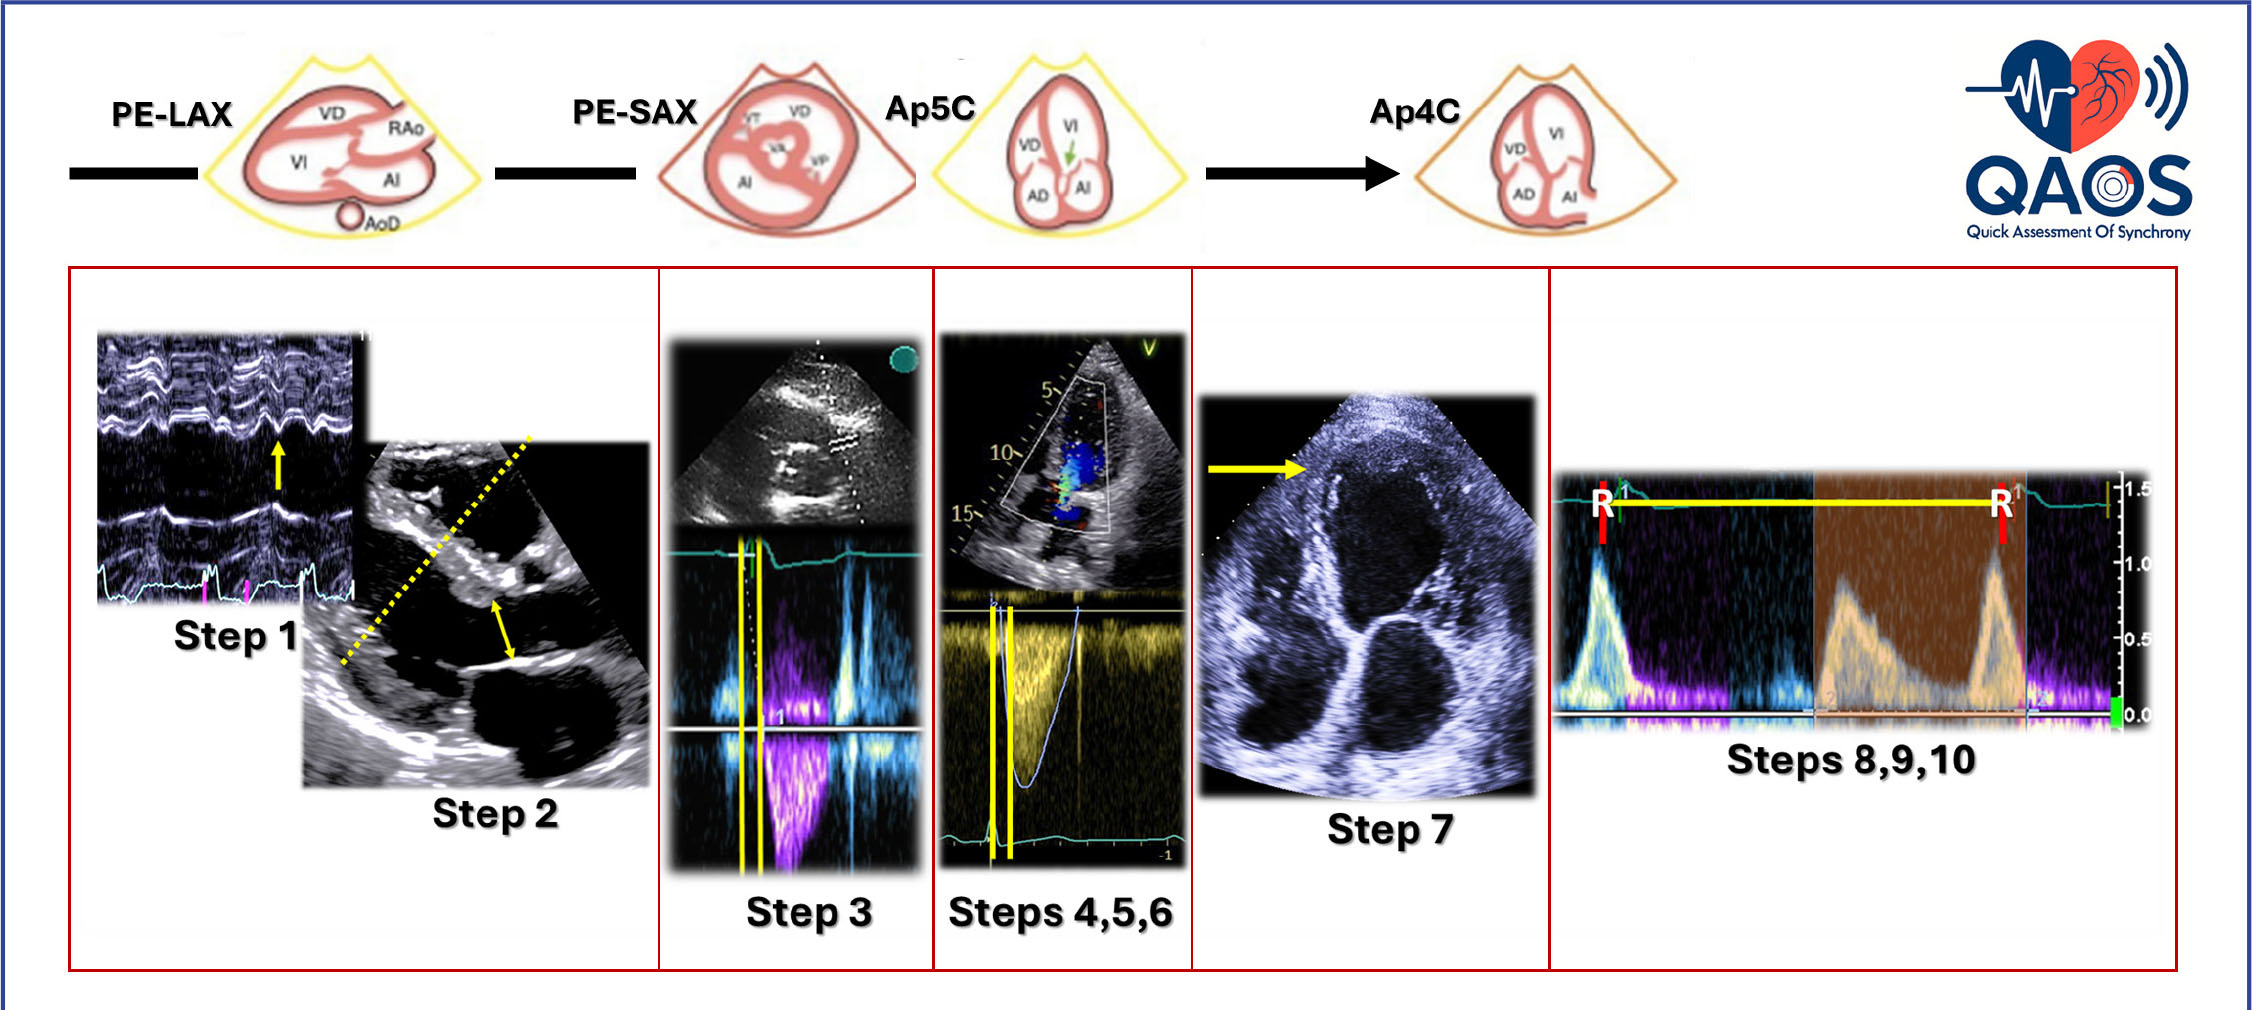
Figure 1
The image acquisition process adheres to the conventional sequence of standard echocardiography. The QAOS steps are illustrated in the parasternal long-axis (PE-LAX); short-axis views (PE-SAX, at the level of the great vessels); and apical five-(Ap5C) and four-chamber (Ap4C) views.
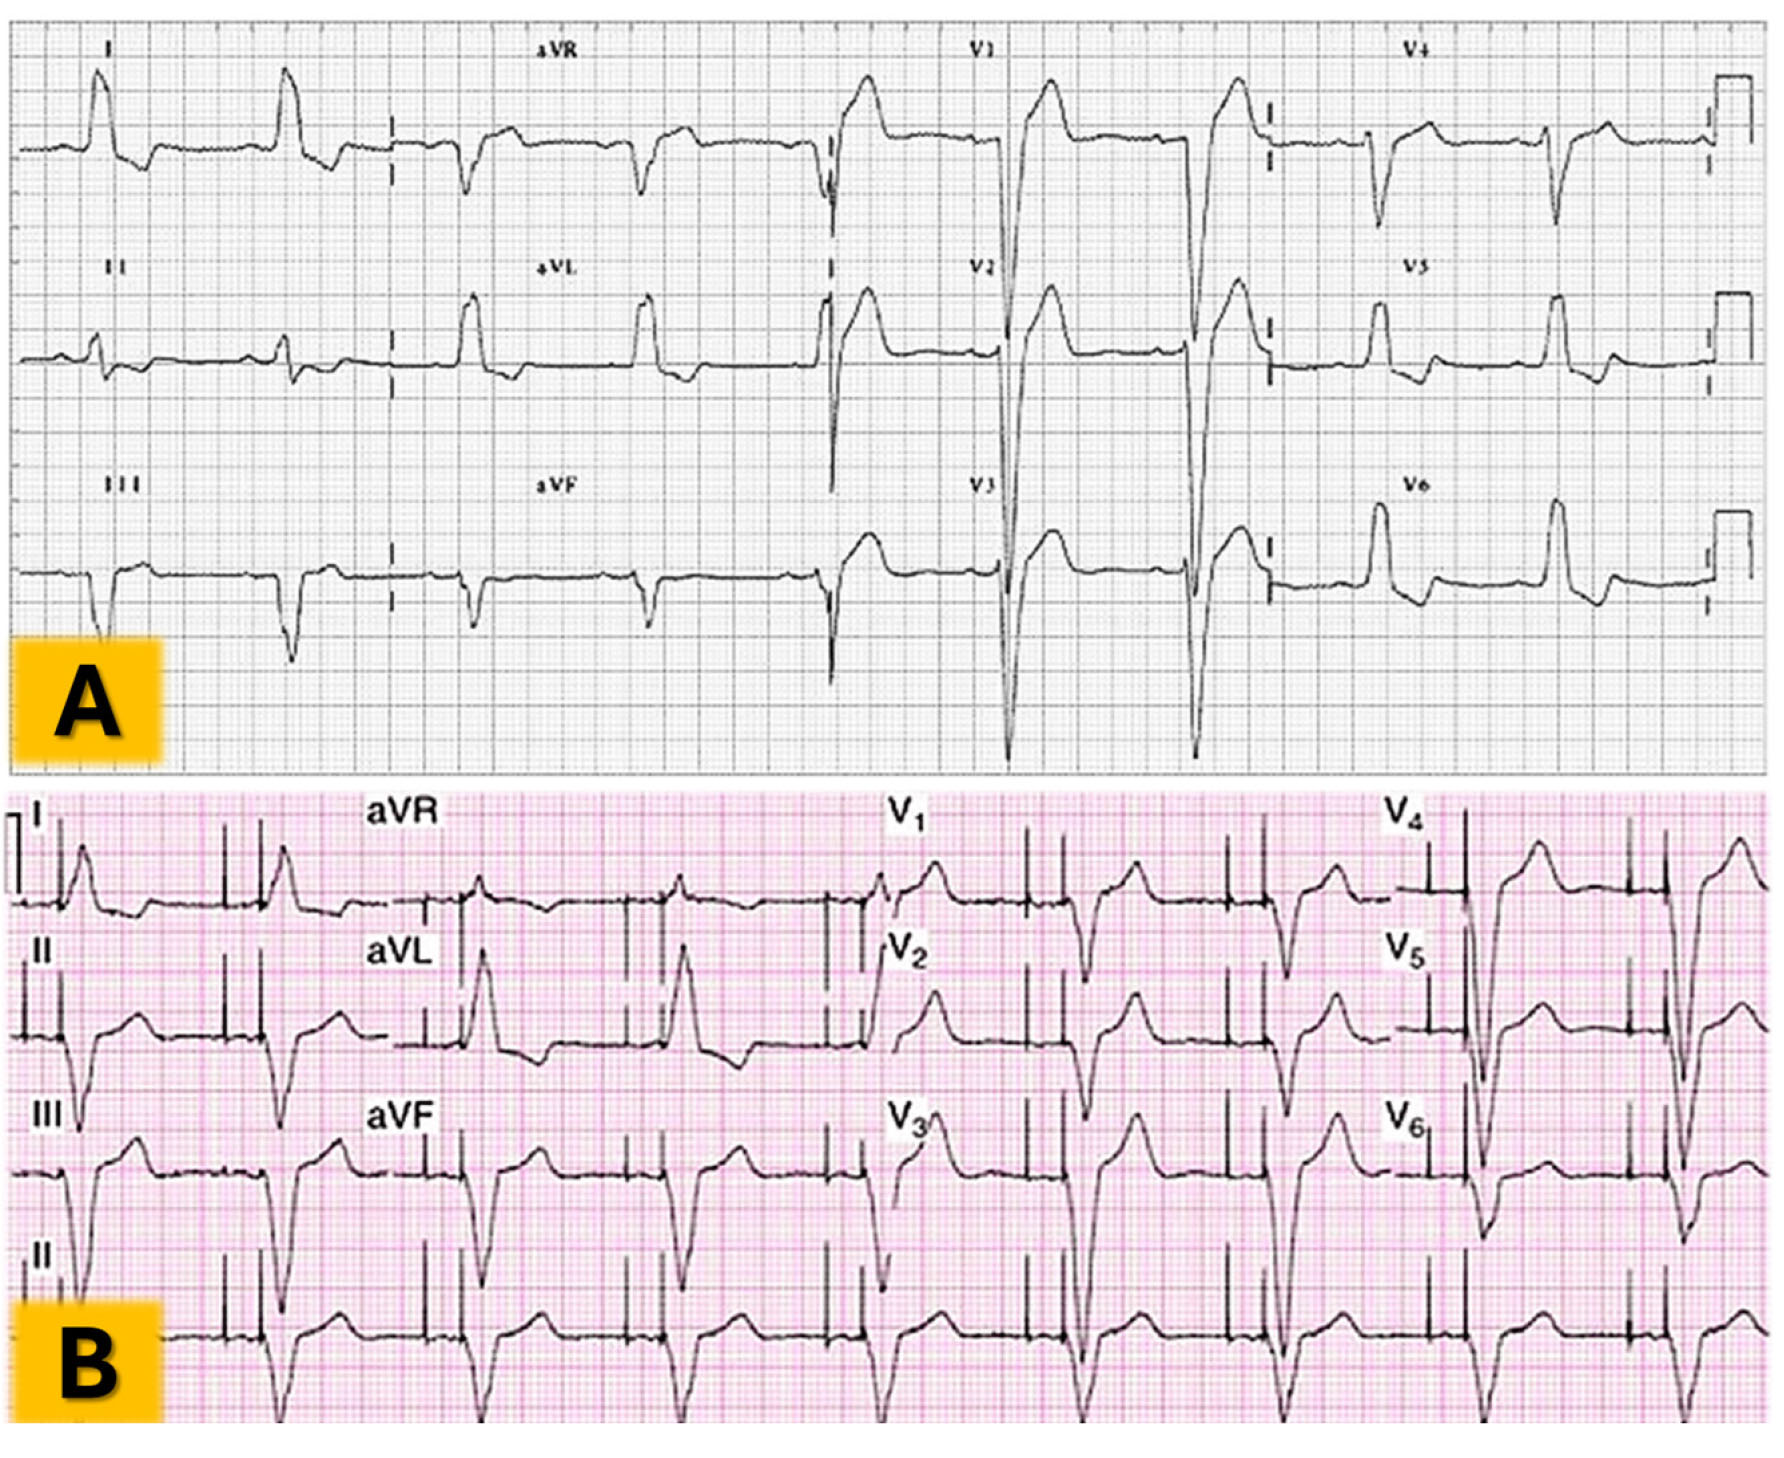
Figure 2
Comparison of the electrocardiogram from a patient with left bundle branch block (Panel A) and the tracing from a patient with a pacemaker showing right apical stimulation (Panel B).
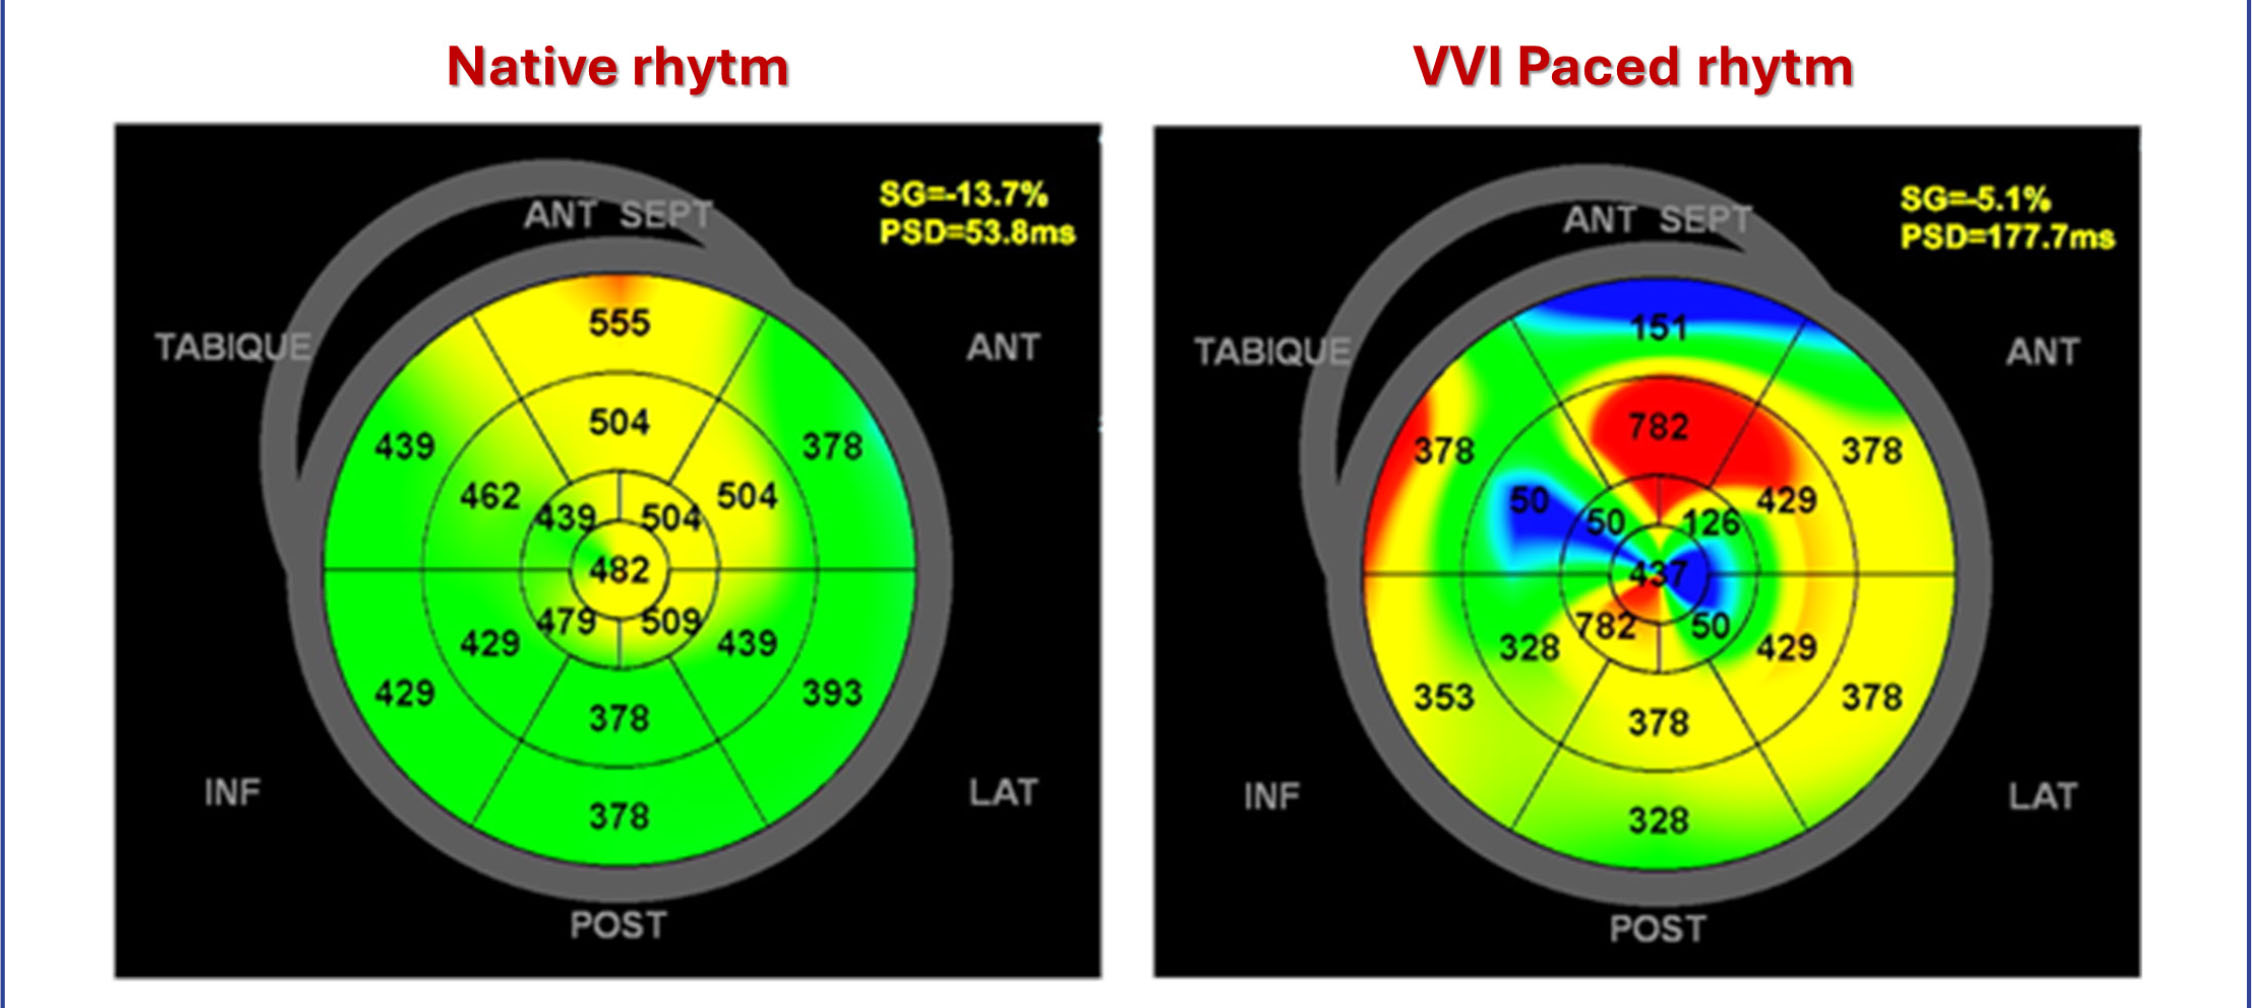
Figure 3
Polar maps of the left ventricle with pacemaker-induced left intraventricular dyssynchrony. Acute changes are shown in a female patient studied with speckle-tracking strain echocardiography, both in native rhythm (left) and during pacing from a right ventricular apical lead (right). Left ventricular mechanical dispersion (peak strain deviation, or PSD) increased from 53 ms (normal) to 177.7 ms (severely abnormal), confirming new dyssynchrony caused by pacing.
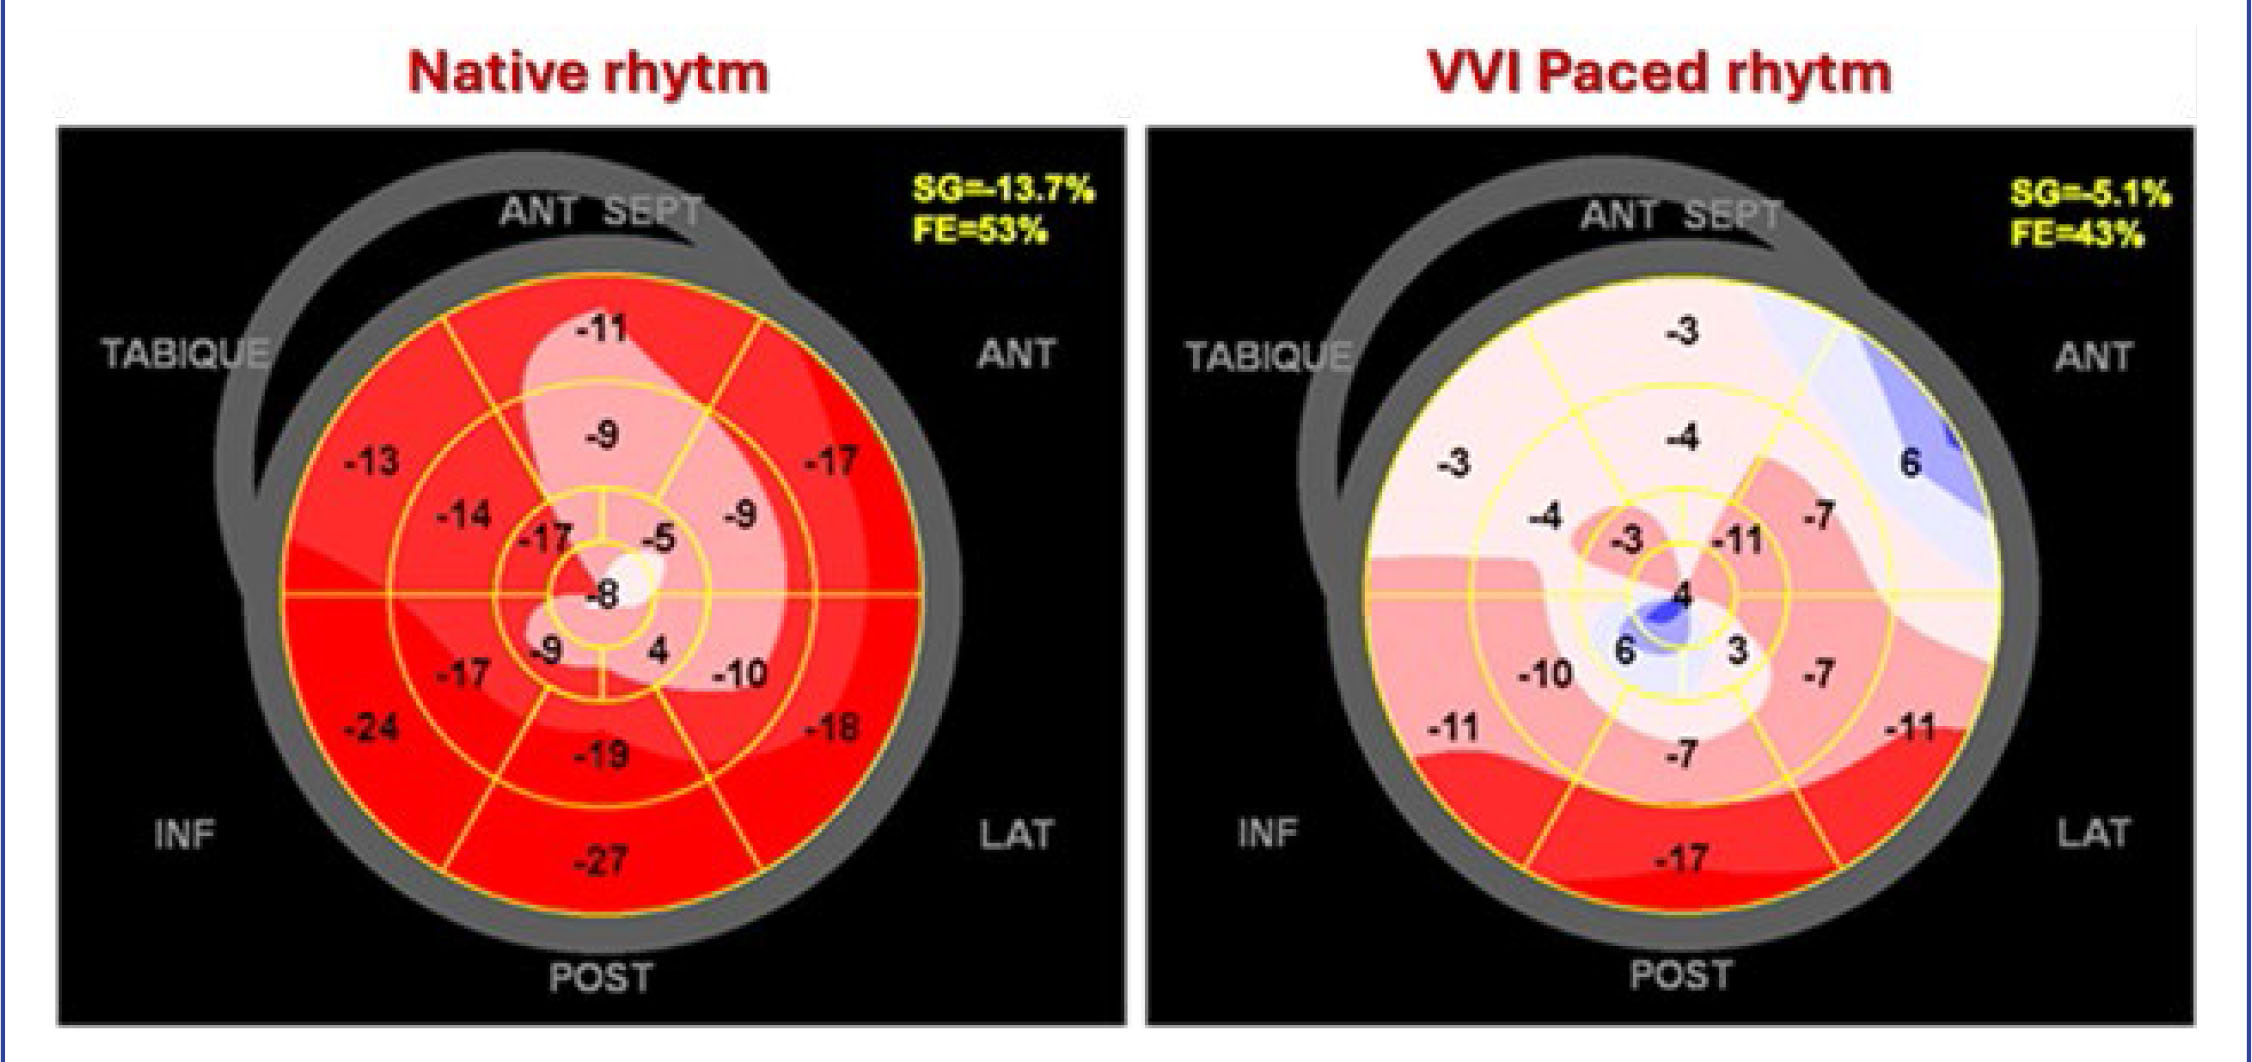
Figure 4
Polar maps of the left ventricle with pacemaker-induced ventricular dysfunction. Acute changes are shown in the same patient from Figure 3, assessed with speckle-tracking strain echocardiography. Left ventricular function in native rhythm (left) and during pacing from a right ventricular apical lead (right) are compared. Left ventricular ejection fraction (EF) decreases from 53% to 43%, and global longitudinal strain (SG) drops dramatically, from -13.7% to -5.1%.