
Figure 1
Diagnosis of arterial hypertension for patients with previous diagnosis of hypertension_
| Blood pressure measurement methods | Controlled HTN N (%) | Uncontrolled HTN N (%) | p value | Kappa | |
|---|---|---|---|---|---|
| P-5 vs GSa | First reading without 5 min rest | 82 (33.2) | 165 (66.8) | < 0.001* | 0.456 |
| Mean of the 2nd and 3rd readings | 106 (42.9) | 141 (57.1) | |||
| P1 vs GSb | First reading after 5 min rest | 99 (39.7) | 148 (60.3) | < 0.001* | 0.500 |
| Mean of the 2nd and 3rd readings | 106 (42.9) | 141 (57.1) | |||
| P123 vs GSc | Mean of the 3 readings | 118 (47.8) | 129 (52.2) | < 0.001* | 0.756 |
| Mean of the 2nd and 3rd readings | 106 (42.9) | 141 (57.1) | |||
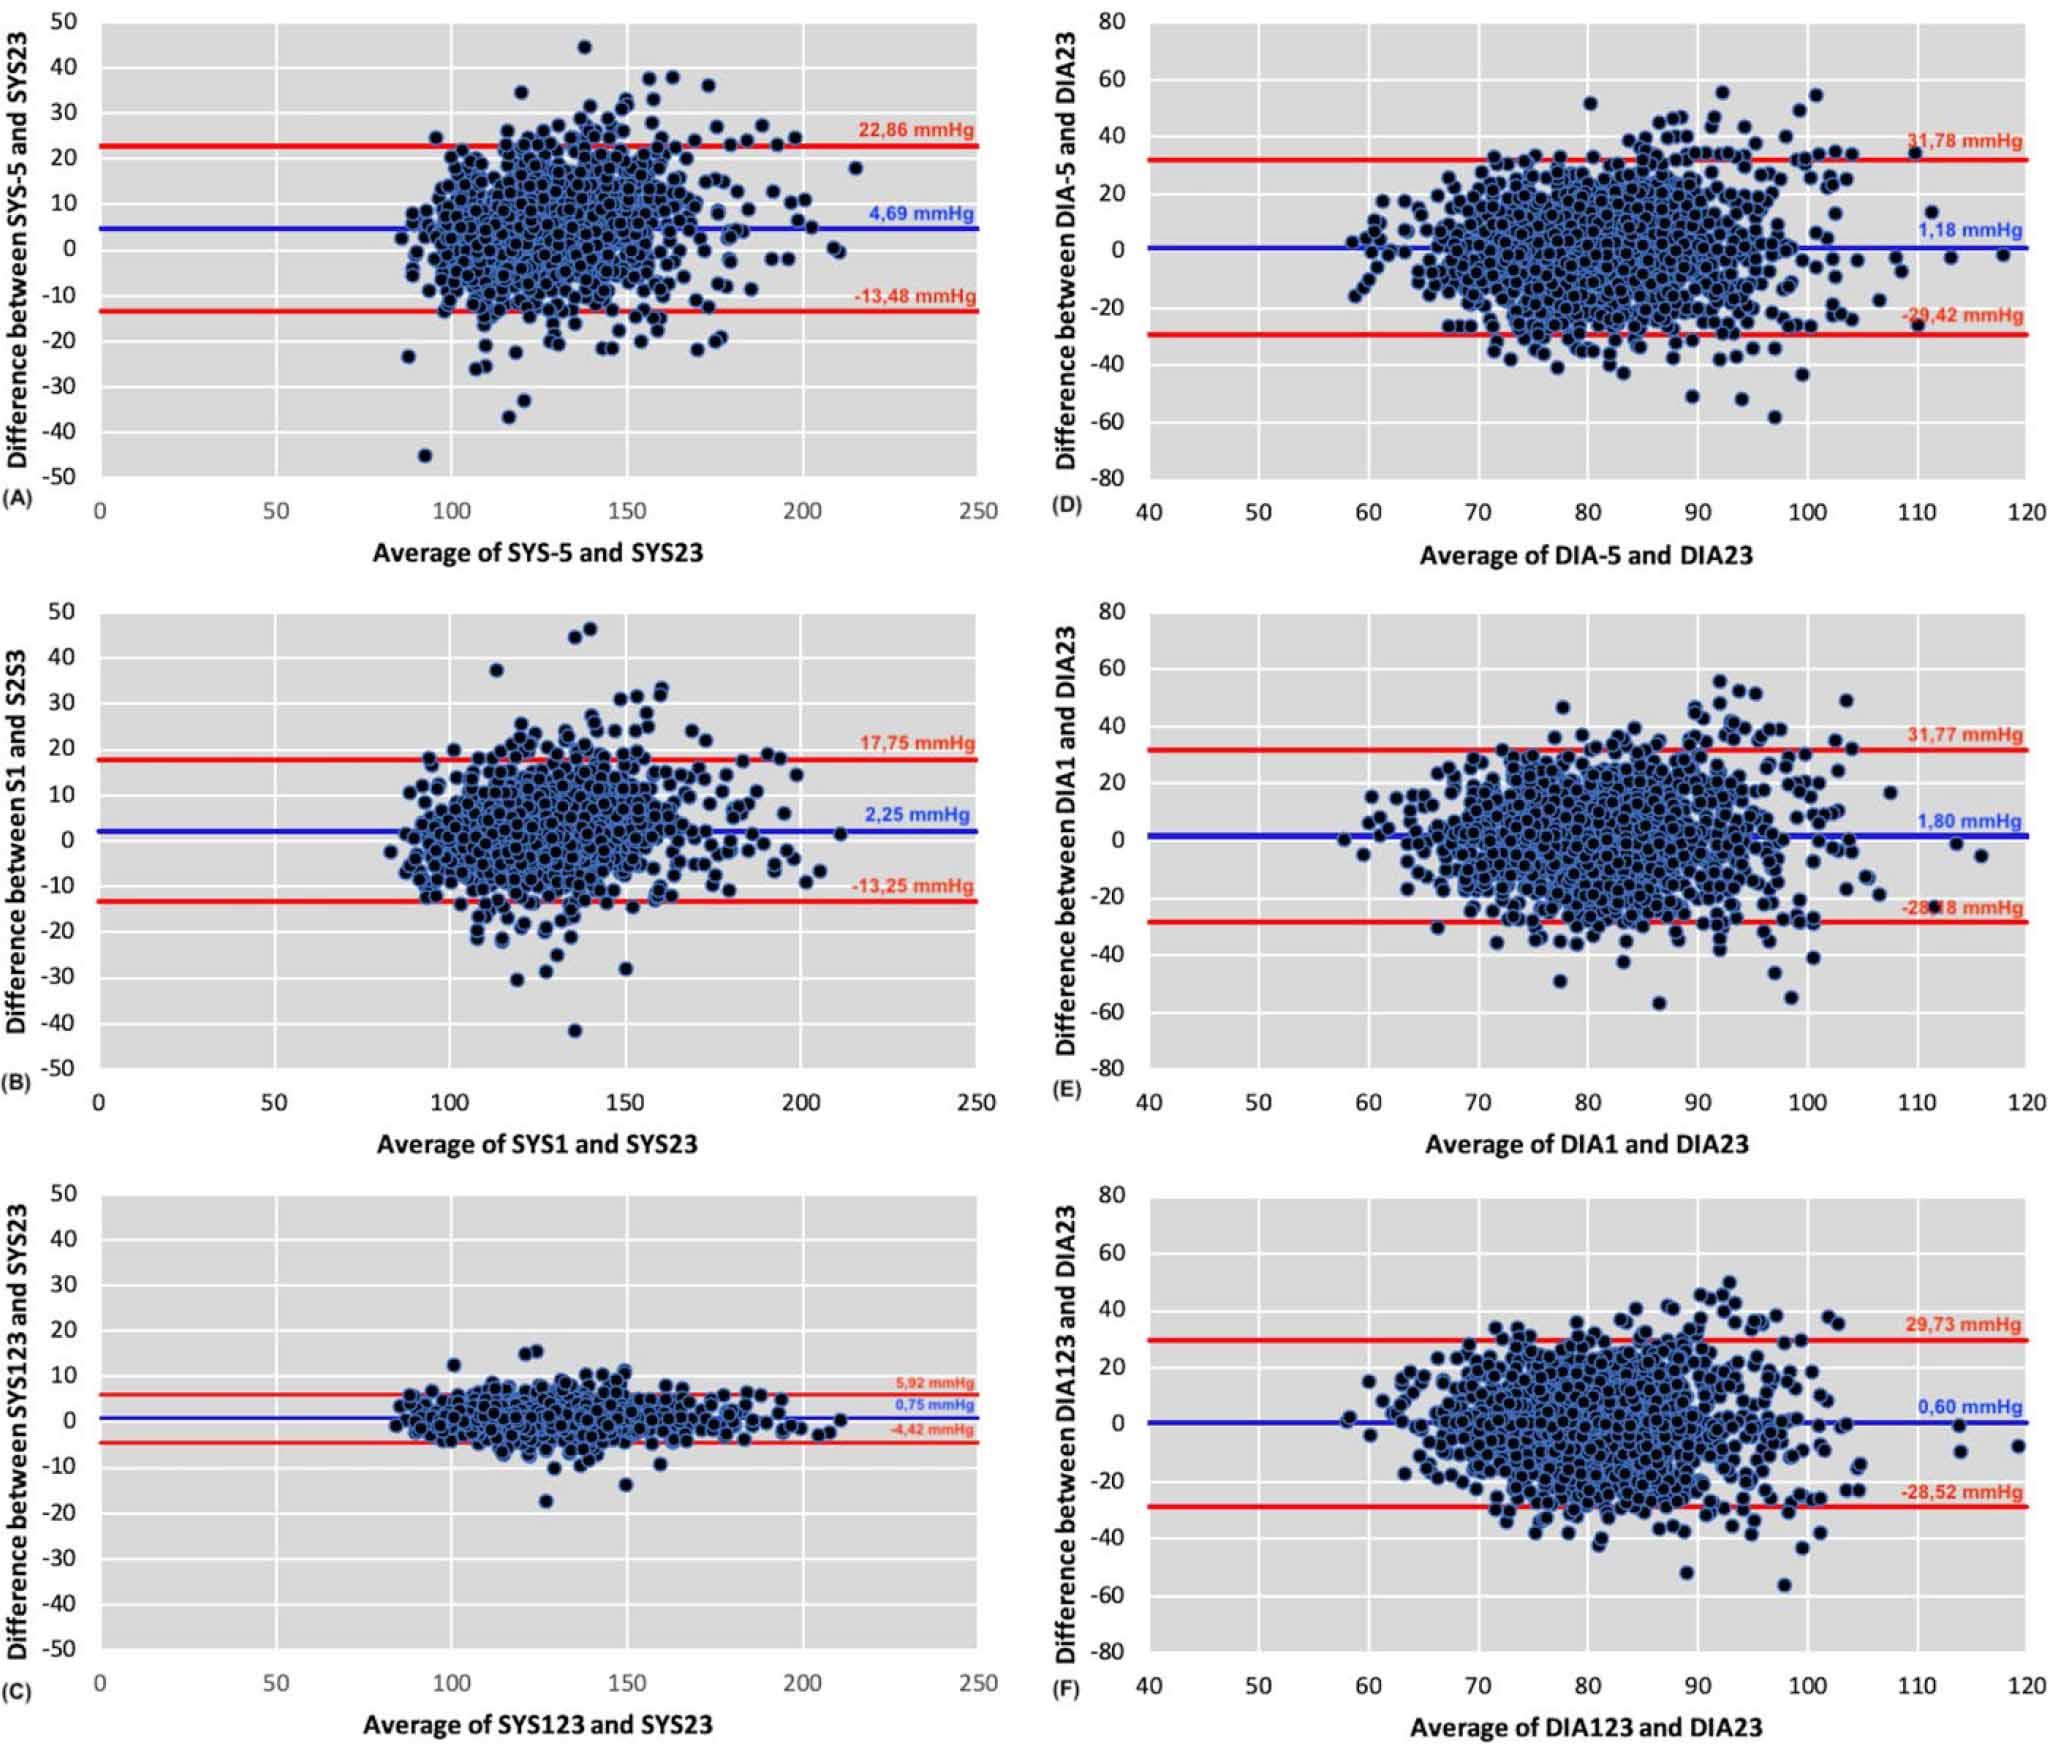
Differences in diastolic blood pressure values using three methods_
| Methods of measurements | Mean diastolic BP of alternative measurement method Mean ± SD | Mean diastolic BP of the mean of the last 2 readings (GS) Mean ± SD | Difference in diastolic BP between both methods Mean ± SD | p value | Cohen’s D |
|---|---|---|---|---|---|
| P-5 vs GSa | 81.67±11.68 | 80.48±10.90 | 1.22±9.71 | 0.004* | 0.104 |
| P1 vs GSb | 82.30±11.23 | 80.48±10.90 | 1.81±15.29 | <0.001* | 0.163 |
| P123 vs GSc | 81.08±10.59 | 80.48±10.90 | 0.60±14.85 | 0.126 | 0.056 |
Diagnosis of arterial hypertension for patients without previous diagnosis of hypertension_
| Blood pressure measurement methods | Normal N (%) | Hypertension N (%) | p value | Kappa | |
|---|---|---|---|---|---|
| P-5 vs GSa | First reading without 5 min rest | 807 (68.7) | 367 (31.3) | < 0.001* | 0.333 |
| Mean of the 2nd and 3rd readings | 814 (69.3) | 360 (30.7) | |||
| P1 vs GSb | First reading after 5 min rest | 699 (59.5) | 475 (40.5) | < 0.001* | 0.270 |
| Mean of the 2nd and 3rd readings | 814 (69.3) | 360 (30.7) | |||
| P123 vs GSc | Mean of the 3 readings | 894 (76.1) | 280 (23.9) | < 0.001* | 0.436 |
| Mean of the 2nd and 3rd readings | 814 (69.3) | 360 (30.7) | |||
Differences in systolic blood pressure values using three methods_
| Methods of measurements | Mean systolic BP of alternative measurement method Mean ± SD | Mean systolic BP of the mean of the last 2 readings (GS) Mean ± SD | Difference in systolic BP between both methods Mean ± SD | p value | Cohen’s D |
|---|---|---|---|---|---|
| P-5 vs GSa | 130.63±20.27 | 125.94±18.76 | 4.68±9.26 | <0.001* | 0.239 |
| P1 vs GSb | 128.19±19.92 | 125.94±18.76 | 2.25±7.90 | <0.001* | 0.116 |
| P123 vs GSc | 126.69±18.79 | 125.94±18.76 | 0.75±2.63 | <0.001* | 0.039 |