
To help in the assessment of patients with discordant echocardiography, aortic valve calcium scoring using multidetector computed tomography (CT-AVC) has emerged as a valuable tool in the assessment of AS severity and has been validated against histological findings.[1]
CT-AVC should be performed using non-contrast, electrocardiogram-gated scans with appropriate settings (slice thickness of 3 mm, 120 kV, 60%–80% RR interval) to ensure accurate measurement. The Agatston method is recommended for quantifying calcium burden. This involves calculating a calcium score based on the area and density of calcified lesions, similar to the well-established approach for assessing coronary calcium scores. To accurately assess AVC, calcifications in the left ventricular outflow tract (LVOT), aorta, mitral annulus, and coronary arteries should be carefully excluded from the measurement.[2]

Role of computed tomography in aortic stenosis (AS) assessment. AVA, aortic valve area; TAVI, transcatheter aortic valve implantation.
It has been observed that women with severe AS have significantly lower Agatston scores compared to men, despite similar echocardiographic severity and symptom burden.[3] Histological analyses confirmed that this discrepancy reflects differences in calcification biology rather than patient size, imaging artifacts or measurement error. As a result, sex-specific CT-AVC thresholds have been adopted to improve diagnostic accuracy for identifying severe AS: ≥2,000 Agatston units (AU) for men and ≥1,200 AU for women.[4] These findings underscore the importance of personalized imaging criteria in the evaluation of AS.
Valve morphology also plays a significant role in the pathophysiology and imaging interpretation of AS. A study by Ye Z. et al. revealed a notable difference when comparing CT-AVC in male patients with bicuspid aortic valves (BAV) versus tricuspid aortic valves (TAV). These results suggest that current CT-AVC thresholds, which are largely based on tricuspid morphology, may not be appropriate for BAV patients. The study concludes that sex-specific and morphology-specific thresholds may be different from those currently recommended when assessing AS severity in patients with BAV, therefore, new studies should be conducted to address these diagnostic needs.[5]
Doris MK et al. evaluated the utility of CT-AVC in tracking the natural progression of AS over time. The study demonstrated that annual changes in CT-AVC were more precisely detected than traditional echocardiographic parameters such as peak aortic jet velocity, mean gradient, and aortic valve area (AVA). Importantly, the superior reproducibility of CT-AVC compared to echocardiographic parameters allows for more accurate detection of subtle progression in calcification, suggesting that CT-AVC may serve not only as a diagnostic tool but also as a disease-monitoring marker in both clinical practice and research settings.[6]
While CT-AVC is primarily used to confirm severe AS, consistent evidence indicates that it also carries important prognostic implications.[7] In a retrospective study by Ye Z. et al., when compared to the low AVC group, both sub-severe and severe AVC groups exhibited higher risk for all-cause mortality under medical surveillance, even after adjusting for echocardiographic AS severity and coronary artery calcium score, with similar risk between sub-severe and severe AVC groups. These findings suggest that high calcium burden, even in the absence of hemodynamically severe disease, may reflect a more aggressive phenotype of AS and could be used to identify high-risk patients who may benefit from earlier intervention.[8]
Contrast-enhanced CT has become the gold standard for preprocedural assessment in transcatheter aortic valve implantation (TAVI) patients due to its accuracy in evaluating the anatomy of the cardiovascular system. These include precise sizing of the aortic annulus, assessment of leaflet and root morphology, the height of the coronary ostia above the annulus, and the extent of aortic valve calcification—all of which are critical for selecting the appropriate valve type and size (Figure 2). Additionally, CT facilitates the evaluation of peripheral vasculature to determine the most suitable access route, reducing the risk of vascular complications (Figure 3).[9] The consensus document on “Computed Tomography Imaging in the Context of Transcatheter Aortic Valve Implantation (TAVI)/Transcatheter Aortic Valve Replacement (TAVR)” also highlights CT’s value in providing co-planar fluoroscopic angle prediction in advance of the procedure and identifying patients at risk of procedural complications, such as coronary obstruction or annular rupture. By standardizing imaging protocols and reinforcing the recommendation on multidisciplinary collaboration, Blanke and colleagues underscore CT’s central role in enhancing both procedural safety and long-term outcomes in TAVI patients.[9] Post-TAVI, CT imaging is utilized to monitor for complications such as leaflet degeneration, valve thrombosis, and prosthetic valve dysfunction, enabling timely intervention and management.[10]
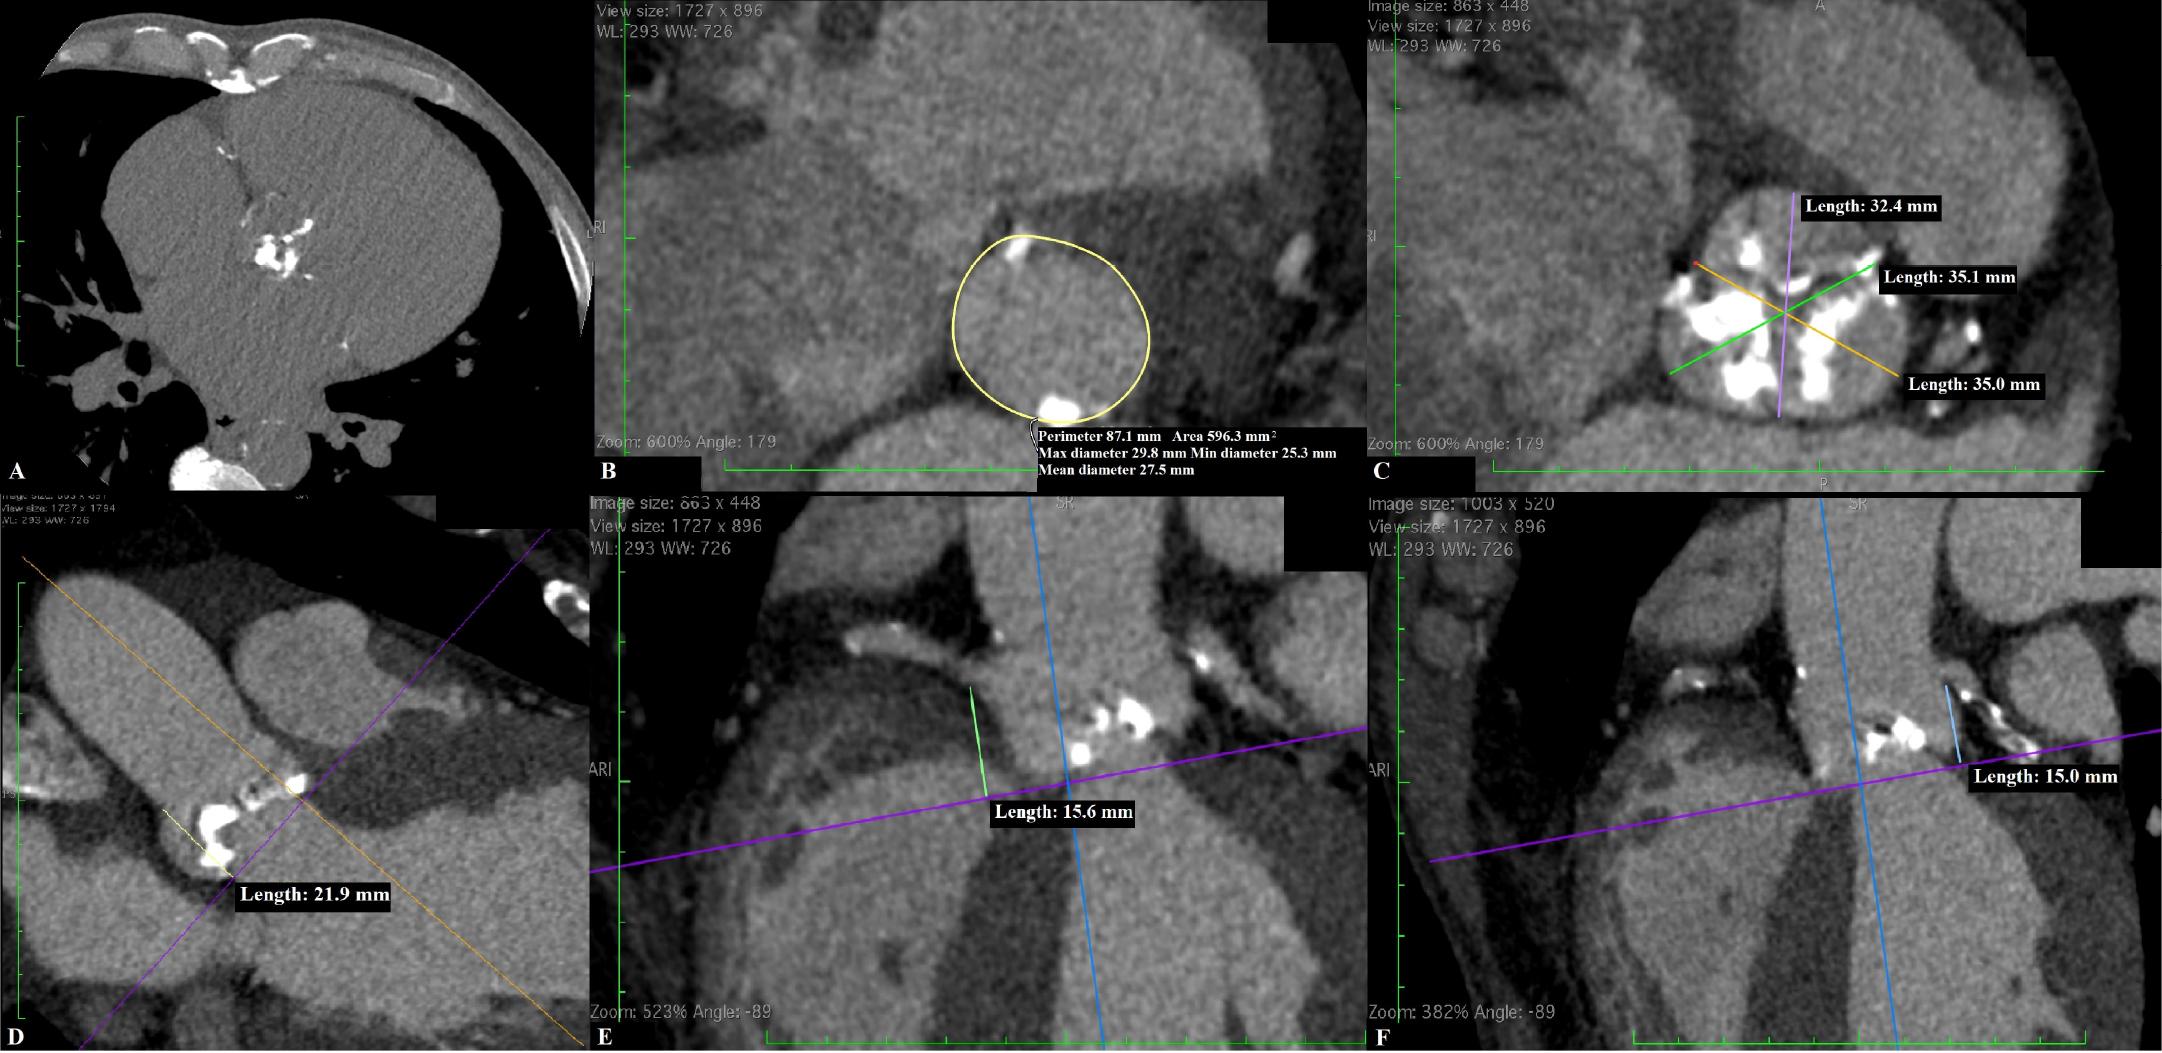
Computed tomography (CT) aortic root examination in a patient with aortic stenosis (AS) before transcatheter aortic valve implantation (TAVI). (A) Non-contrast CT showing intensely calcified aortic valve (calcium score 5888 AU); Contrast CT multiplanar reformatted images (during systolic phase 33 %) showing measurements of (B) the aortic annulus perimeter (87.1 mm) and diameters (maximum/minimum/mean 29.8/25.3/27.5 mm), (C) the sinuses of Valsalva diameters (32.4/35.1/35.0 mm), (D) the sinotubular junction height (21.9 mm), (E) the right coronary height (15.6 mm), and (F) the left coronary height (15.0 mm).

Vascular access assessment for transcatheter aortic valve implantation (TAVI) using computed tomography (CT) angiography. Multiplanar reformatted CT images demonstrating the assessment of iliofemoral access in a patient undergoing TAVI—axial and oblique views (left) and centerline image processing (middle and right) of the left external iliac artery allow assessment of dimensions, calcifications, and angulation critical for evaluating the feasibility and safety of transfemoral access.
By enabling accurate measurements and predicting potential complications, CT contributes significantly to improving the safety, success, and outcomes of TAVI procedures.
Discrepancies between Doppler echocardiography and CT in the assessment of AVA are well documented. [11,12,13] Several studies have demonstrated that CT, whether through direct planimetry or a hybrid approach combining CT and echocardiography, tends to yield systematically higher AVA values. This has led to the proposal of a revised threshold of <1.2 cm2 for severe AS when assessed by CT. [11,14] While sensitive, this threshold has been shown to lack specificity for severe AS in some studies, emphasizing that larger CT-derived AVA cutoffs may improve diagnostic accuracy. [15]
Although planimetry using CT offers a direct and seemingly straightforward method for AVA estimation, it still has several limitations affecting its accuracy and reproducibility. The reliability of manual tracing in CT planimetry is highly dependent on image quality, operator expertise, and the technical capabilities of the imaging system. Anatomically, the aortic valve orifice is not always a single, flat plane, which can introduce errors if the measurement is not performed at the narrowest part of the funnel-shaped opening or if the imaging plane is misaligned. Temporal limitations may also contribute to inaccuracy, as AVA is typically measured at a single time point (peak systole), failing to account for dynamic changes in valve opening throughout systole. Motion artifacts, particularly during rapid valve movement, may blur the valve margins, and severe calcification can lead to blooming artifacts that obscure the orifice or falsely narrow it. [16]
To address the limitations associated with the geometric assessment of the LVOT by echocardiography which typically assumes a circular LVOT and derives its area from a single diameter, a hybrid approach has been proposed using CT direct planimetric LVOT area in combination with echocardiographic hemodynamic data. However, studies have shown that this approach does not improve AVA-gradient relationship in cases with discordant echocardiographic findings. [11] Choe et al. found that factors such as larger body surface area (BSA), larger AVA on echocardiography, tricuspid valve morphology, and annulus area normalized to the BSA were significantly associated with AVA discordance between echocardiography and CT. Their findings suggest that a combined imaging strategy of CT and echocardiography for grading severe AS may be helpful in these patients. [13]
Zeb et al. emphasized that although CT cannot replace flowbased assessments, its value lies in its ability to quantify calcification burden, leaflet anatomy, and annular dimensions, features that can help adjudicate AS severity in ambiguous or discordant cases. [14] Taken together, these findings support a multimodality approach, with CT serving as a valuable method, particularly when echocardiographic data are inconclusive or technically limited.
While traditional imaging modalities primarily assess calcific deposits, recent advancements in contrast-enhanced CT have enabled comprehensive evaluation of both calcific and non-calcific (fibrotic) components of the aortic valve. The quantification of these components provides a more complete understanding of AS pathophysiology and may enhance diagnostic and prognostic accuracy. Fibrocalcific scoring has demonstrated that females demonstrate more fibrosis relative to calcification in their stenotic valve than males, indicating important sex-differences in the pathophysiology of this condition.[17] A larger study analyzing symptomatic patients with AS who underwent CT angiography for TAVI planning between 2015 and 2022 revealed the existence of phenotypic differences in CT angiography valve tissue composition in AS, with females and low-gradient AS showing a proportionally more fibrotic phenotype.[18]
A study conducted in 136 patients with AS using Gaussian-mixture modeling to analyze CT attenuation distributions, enabling the differentiation and quantification of calcific and non-calcific volumes in the aortic valve, showed that the aortic valve fibrocalcific volume correlated not only with baseline disease severity but also with disease progression over time.[19] The study by Grodecki K. et al. provided histologic validation of CT-derived fibrocalcific measurements. Aortic valve samples from 29 patients were analyzed, and the results revealed excellent agreement between CT and histologic assessments, with intraclass correlation coefficients exceeding 0.90 for both fibrotic and calcific tissue volumes. This underscores the reliability of CT imaging in accurately capturing the complex tissue composition of the aortic valve.[20]
Integrating fibrocalcific scoring into clinical practice offers several advantages. First, it provides a comprehensive assessment of valve pathology, encompassing both calcific and fibrotic components. Second, it enhances the accuracy of AS severity grading, particularly in cases where echocardiographic findings are discordant. Third, it serves as a valuable prognostic tool, identifying patients at higher risk for disease progression and adverse outcomes. Despite the promising results, several challenges remain in the widespread adoption of fibrocalcific scoring. Standardization of imaging protocols and software tools is essential to ensure consistent and reproducible measurements across different clinical settings. Additionally, defining threshold values for fibrocalcific volume that correlate with specific disease stages will further enhance the clinical applicability of this method. Further research is needed to validate these findings in larger and more diverse populations, while also investigating how fibrocalcific volume can be incorporated into risk stratification models and therapeutic decision-making algorithms.[21]
Cardiac CT has expanded beyond anatomical evaluation to include functional imaging through the assessment of myocardial strain, offering a promising adjunct to echocardiography in AS. While echocardiographic speckle-tracking remains the clinical standard for strain measurement, recent advances in algorithms and postprocessing technology have enabled accurate quantification of left ventricular (LV) and left atrial (LA) strain using computed tomography feature tracking (CT-FT). Although both speckle-tracking and feature-tracking techniques are employed to evaluate myocardial deformation throughout the cardiac cycle, they differ in their underlying tracking methodologies. Speckle-tracking analyses the naturally occurring speckle pattern in the myocardium, allowing for detailed assessment of intramyocardial motion. While feature-tracking can also capture myocardial deformation, it primarily relies on following distinct anatomical landmarks, such as the endocardial border, across the cardiac cycle. This fundamental difference—particularly the limited tracking of intramyocardial features in featuretracking—accounts for the variability observed between the two methods.[22]
Several studies have demonstrated strong agreement between CT-derived strain and echocardiographic metrics, in both LV and LA strain measurements.[23,24] This establishes CT as a feasible and reliable alternative, particularly in patients with suboptimal echocardiographic windows or in those already undergoing CT for TAVI planning.
A study by Marwan et al. assessing the changes in CT-derived LV strain parameters before and after TAVI in patients with AS, demonstrated significant improvements in CT-derived parameters of global myocardial strain on short-term follow-up.[25] A systematic review and meta-analysis found that impaired CT-derived GLS was independently associated with adverse outcomes, including all-cause mortality and heart failure hospitalization.[26] These findings suggest that CT-derived strain imaging can be a useful tool in monitoring myocardial function recovery following valve replacement and predicting outcomes.
Photon-counting CT and artificial intelligence-assisted post-processing are expected to further enhance strain measurement fidelity. Incorporating CT strain analysis into preprocedural workflows could offer incremental value without additional imaging sessions or radiation exposure. Nonetheless, broader adoption will require standardization of imaging protocols, analytic algorithms, and threshold definitions for clinical interpretation.
Extracellular volume (ECV) quantification using cardiac CT represents a novel method for myocardial tissue characterization in AS. While cardiac magnetic resonance (CMR) remains the gold standard for ECV assessment, CT-based approaches offer an accessible and efficient alternative, especially in patients already undergoing contrast-enhanced CT for procedural planning. Several studies have highlighted the strong prognostic utility of CT-derived ECV in patients with AS requiring aortic valve replacement.[27,28] Meta-analyses confirm that elevated ECV is associated with adverse postoperative outcomes, including all-cause mortality and heart failure admissions.[26,29] As such, ECV has the potential to become a key imaging biomarker for risk stratification in patients with severe AS undergoing valve replacement.
CT-based ECV mapping provides insight into myocardial fibrosis and infiltration. In a cohort of patients undergoing TAVI, the ones associating amyloidosis exhibited higher ECV values, this dual capacity for structural and tissue characterization is particularly valuable in tailoring individualized treatment strategies.[30]
CT has become an essential tool in the evaluation and management of AS, serving as a complementary method to echocardiography in many cases and highlighting the importance of a multidisciplinary approach in the care of these patients. Non-contrast CT aortic valve calcium scoring provides a reproducible, sex-specific assessment of AS severity and disease progression. Contrast-enhanced CT is the gold standard for TAVI planning, enabling precise anatomical assessment and reducing procedural risk. Emerging CT-based techniques, such as fibrocalcific scoring, CT-derived strain imaging and CT-derived ECV quantification, offer deeper insights into valvular and myocardial pathology. These tools have shown prognostic value and could enhance patient risk stratification and personalized care. However, for broader clinical use, standardization and validation in larger studies are needed. Overall, CT is evolving into an imaging modality able to offer an exhaustive anatomical, functional, and tissue-level assessment in AS.