
Figure 1
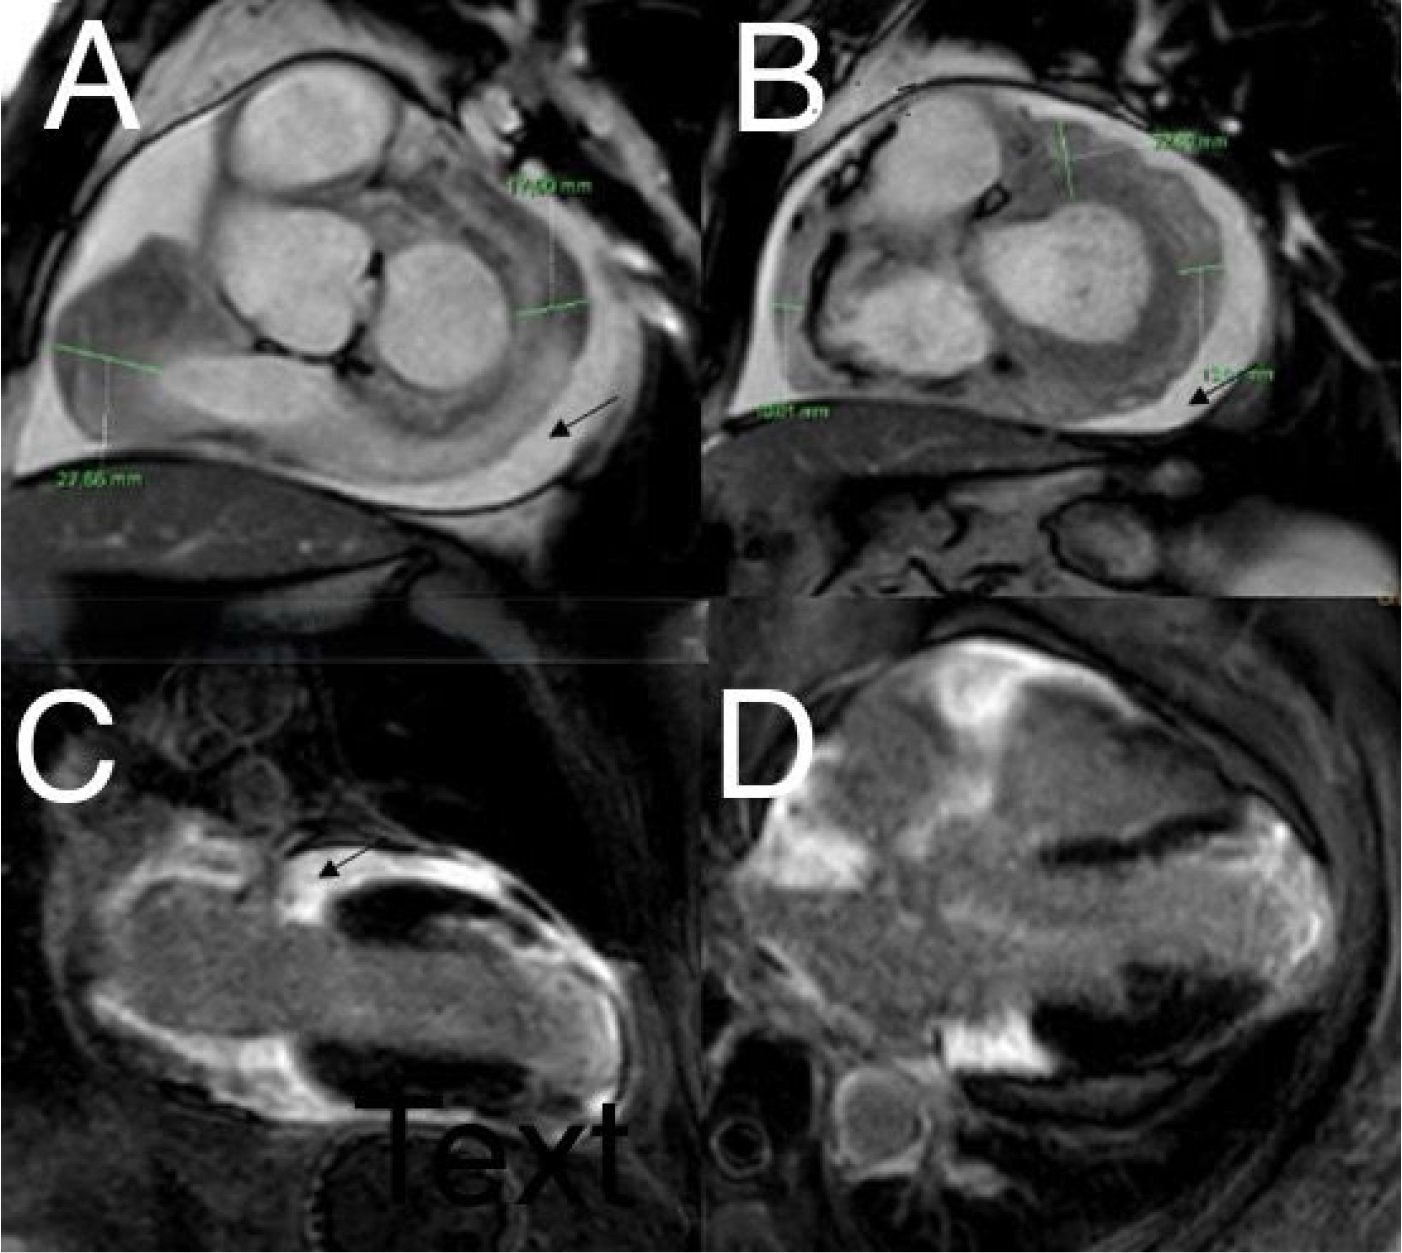
CMR. A, B – Short axis cine steady state free precession sequence showing moderate circumferential pericardial effusion without impact on the cardiac cavities (black arrow). Tumor or pseudotumoral process sheathing the visceral pericardium predominantly facing the right atrium, the base of the inferior vena cava, the posterior wall of the right auriculum extending towards the interatrial septum and the free wall of the left atrium (green lines). C, D – Late gadolinium enhancement sequences showing enhancement zones at the level of the pericardium, superimposable to the topography of the tumor described in the cine images. Additionally, transmural enhancement at the level of the left ventricular apex and the apical segments.
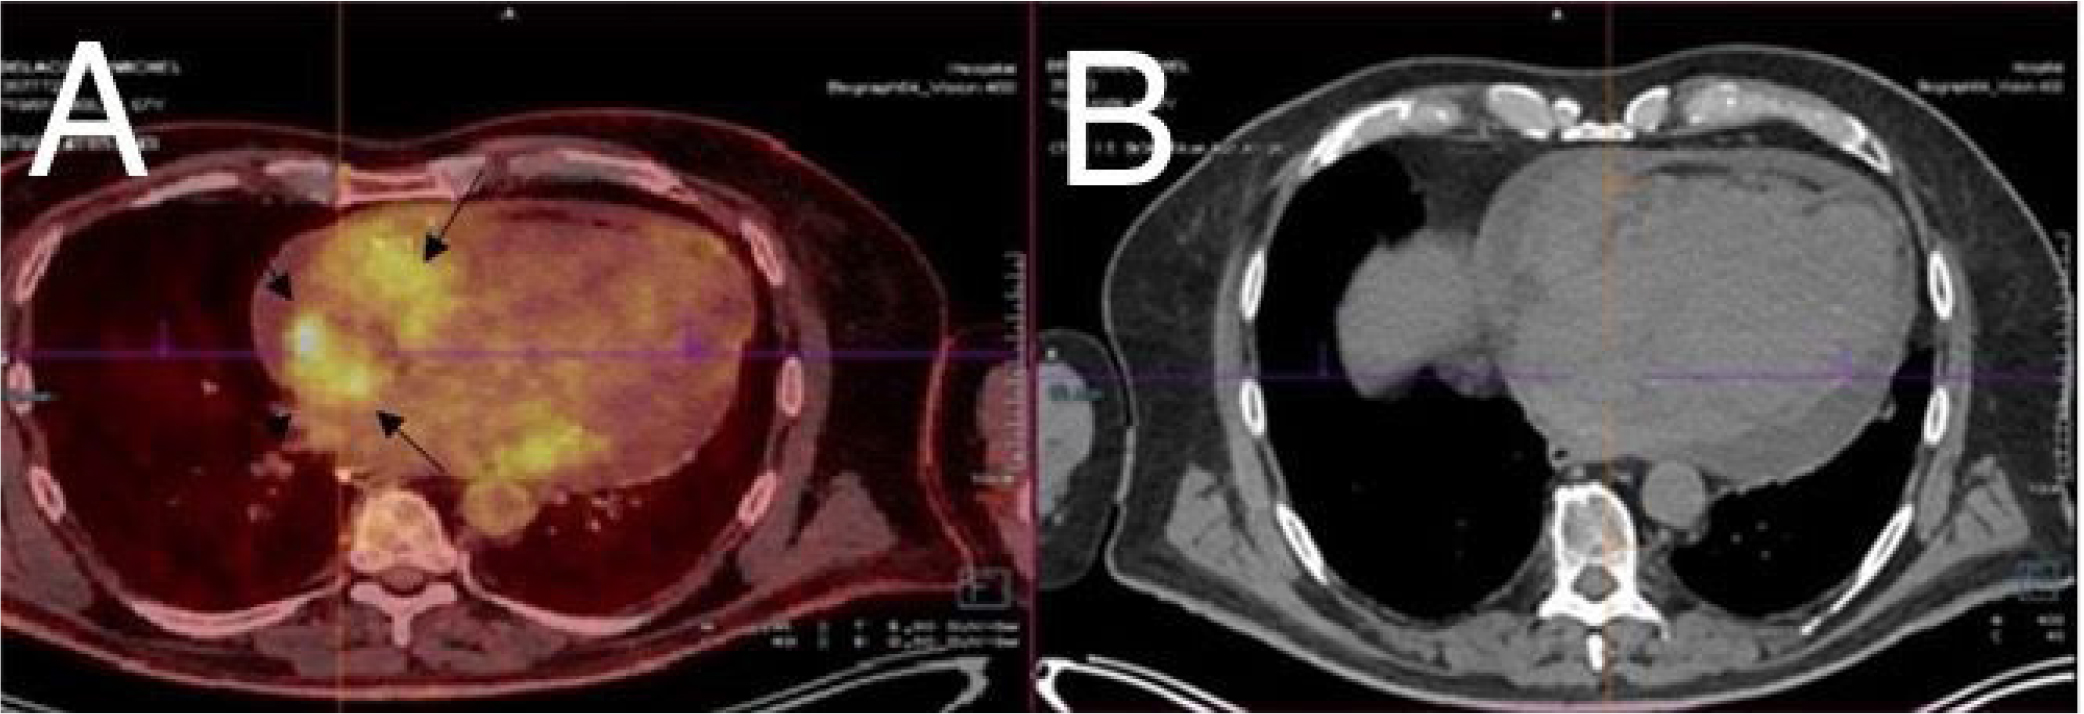
Figure 2
PET-CT SCAN. Transverse section at the level of the heart. A. Moderate diffuse hypermetabolism involving the internal pericardial layer in the context of known pericardial effusion. Increased fixation at the level of known pseudo-tumoral thickenings on the periphery of the right atrium (black arrows) B. Transverse section CT scan without PET at the same level.
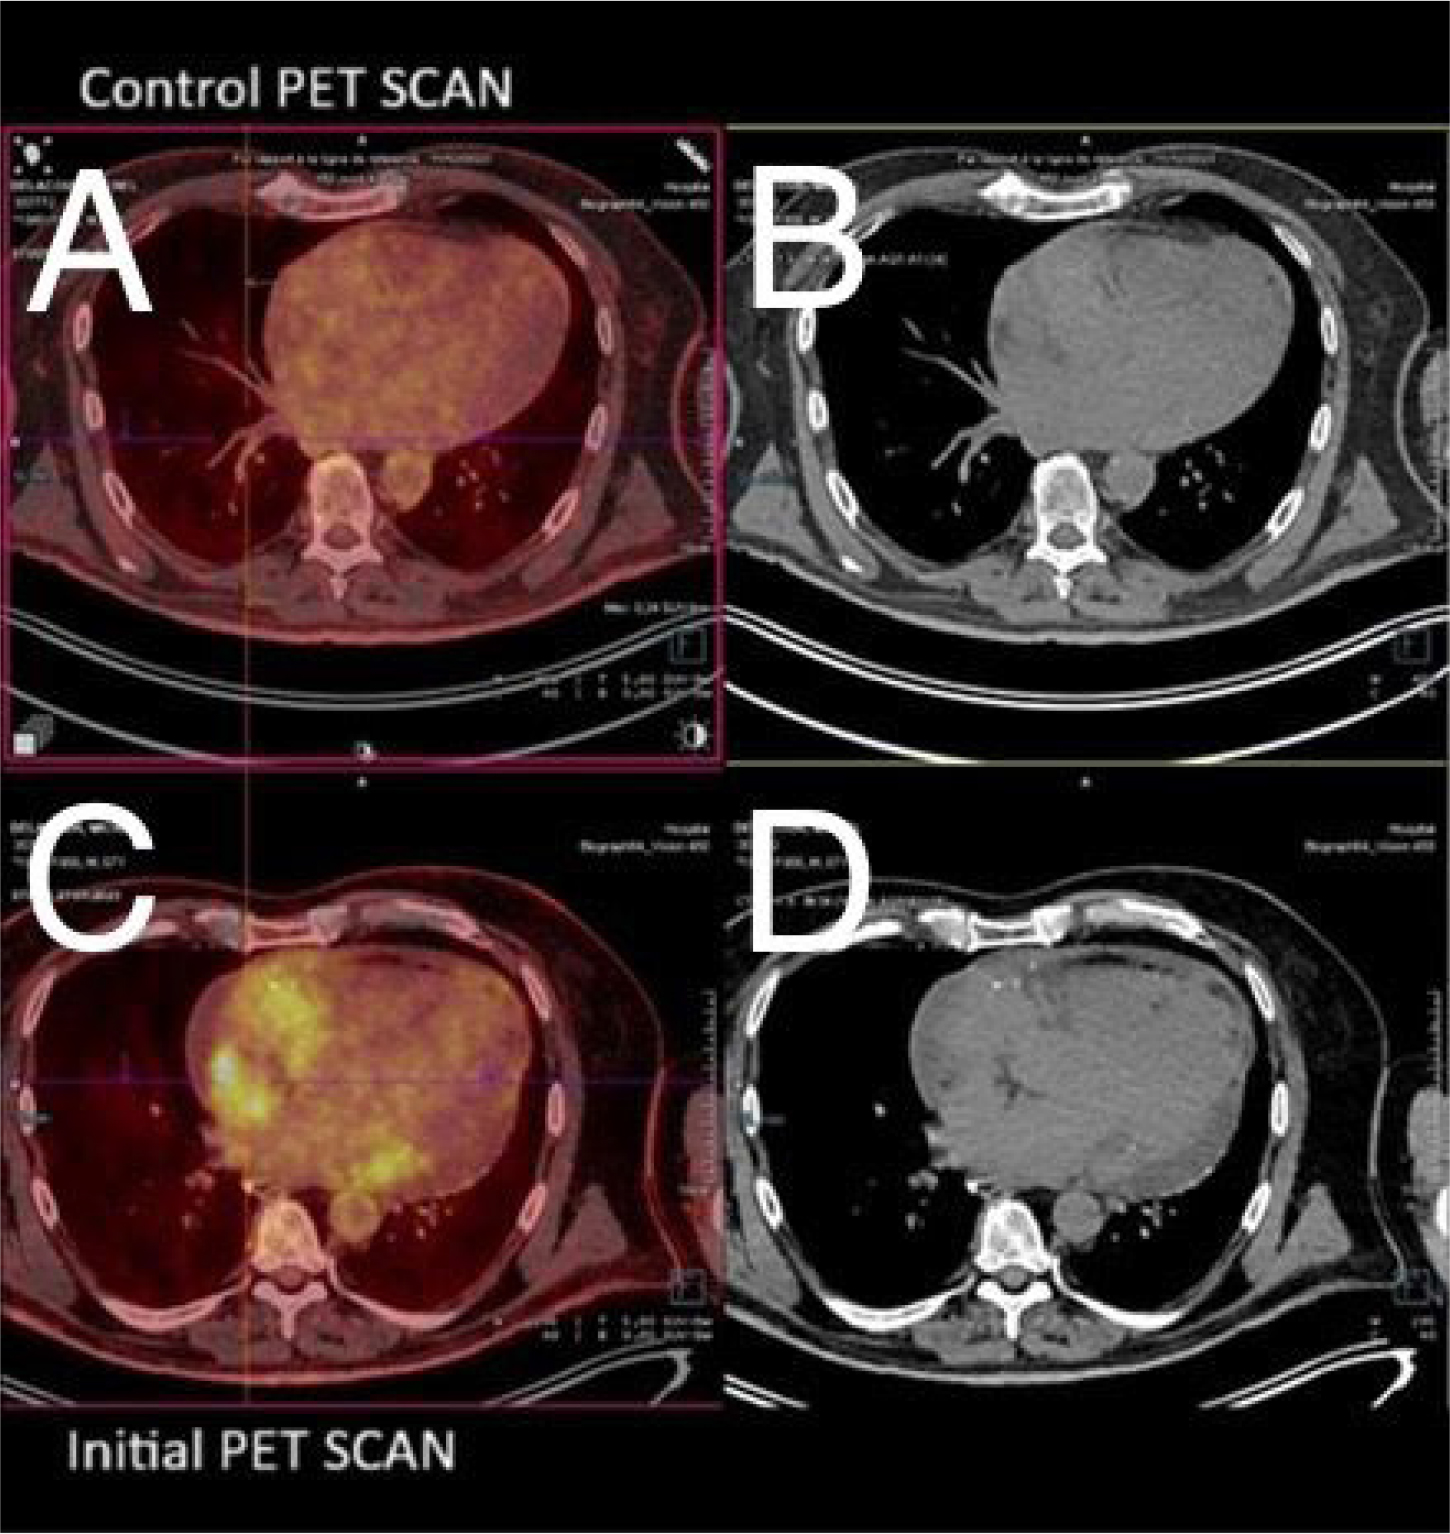
Figure 3.
Control PET-CT Scan. A. Transverse PET/CT scan. Disappearance of pericardial hypermetabolism and pericardial effusion. Disappearance of pathological hyperfixation at the level of the right atrium. B. Transverse CT scans at the same level. C. Initial PET/CT scan. View Figure 2 for image details. D. Transverse CT scans at the same level.
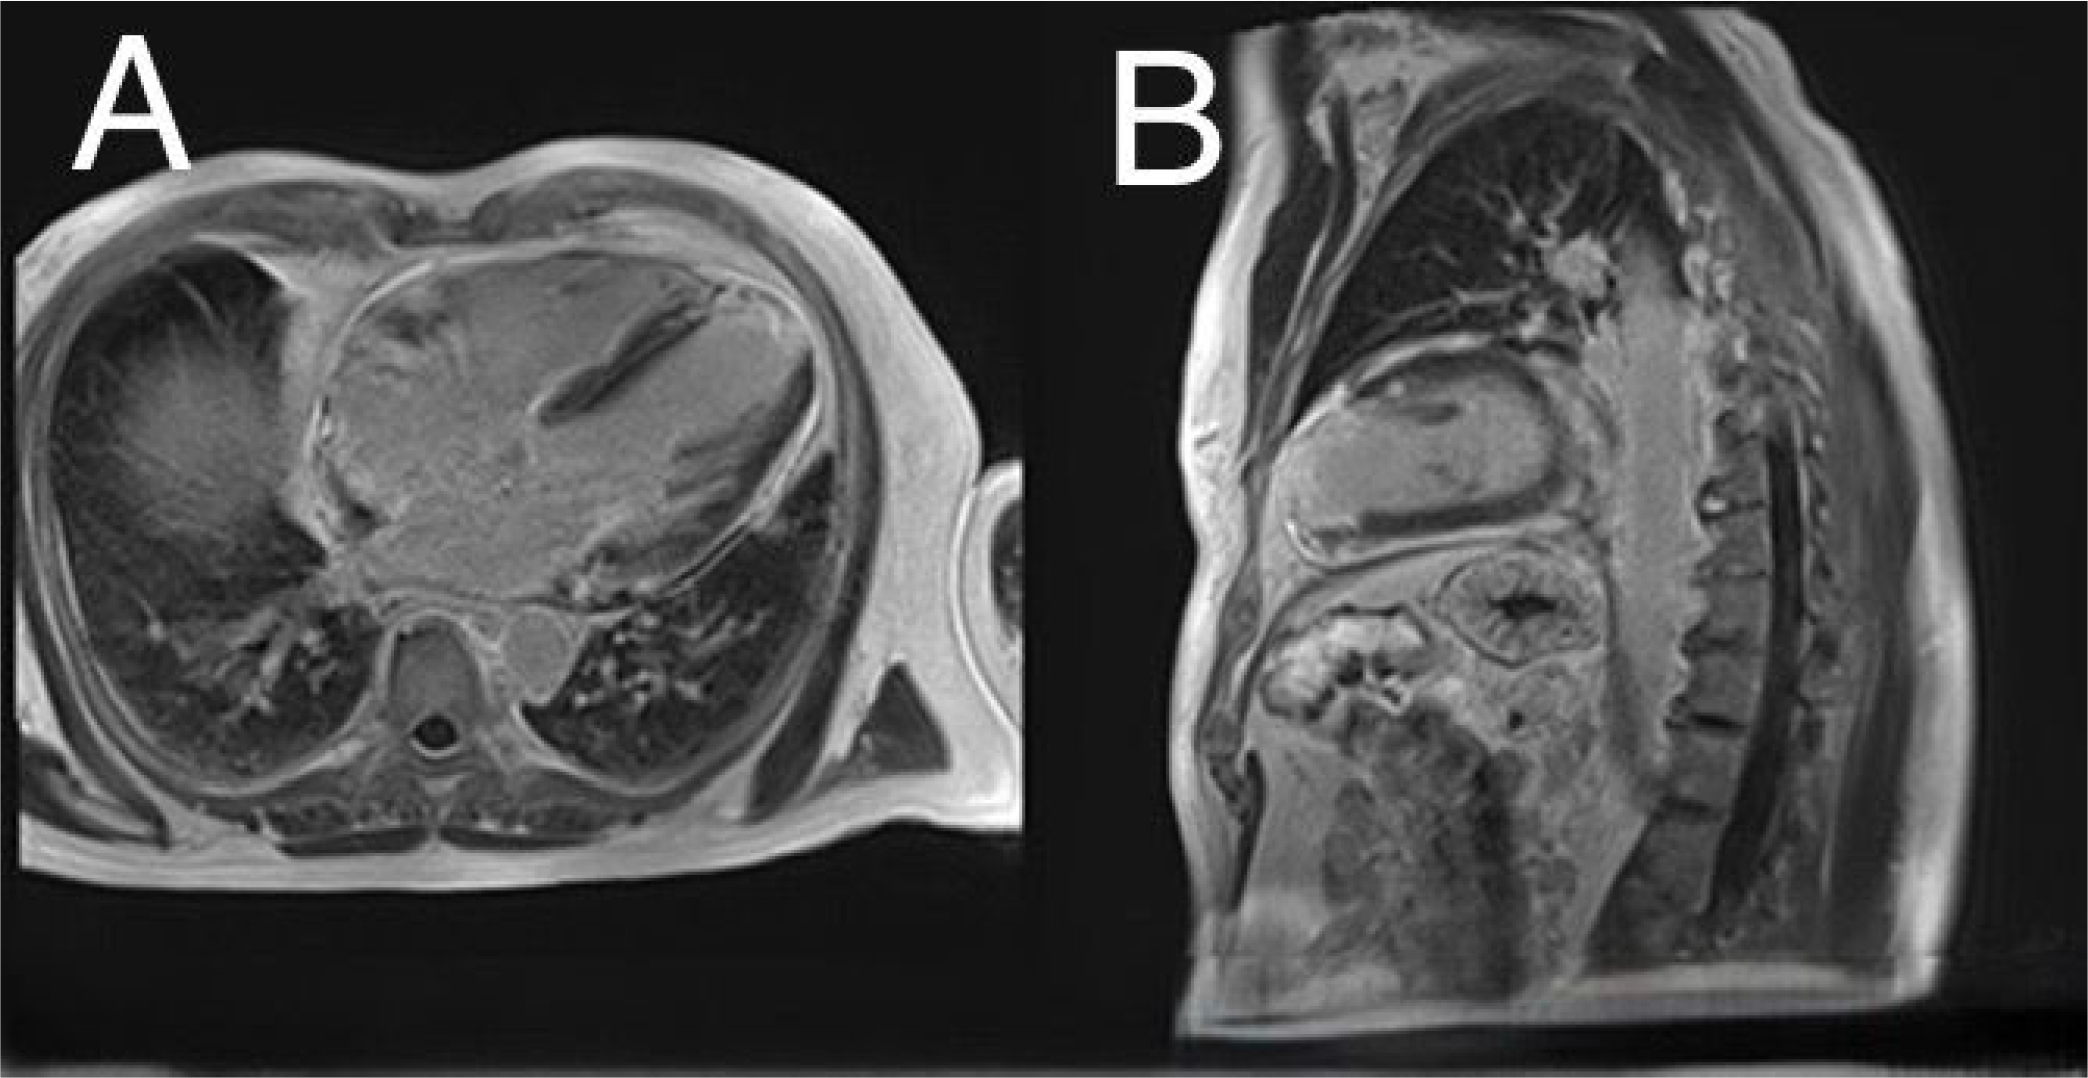
Figure 4
Control CMR – A, B – late gadolinium enhacement (LGE) sequences in four chambers and two chambers view showing significant improvement of pericardial effusion with persistence of a minimal residual layer. Persistence of a marked infiltration of the atrial mass of superimposable dimensions but with a very significant regression of inflammatory and perfusion signs on late enhancement sequences (black arrows). Apical scar post myocardial infarction (white arrow).