Figure 1
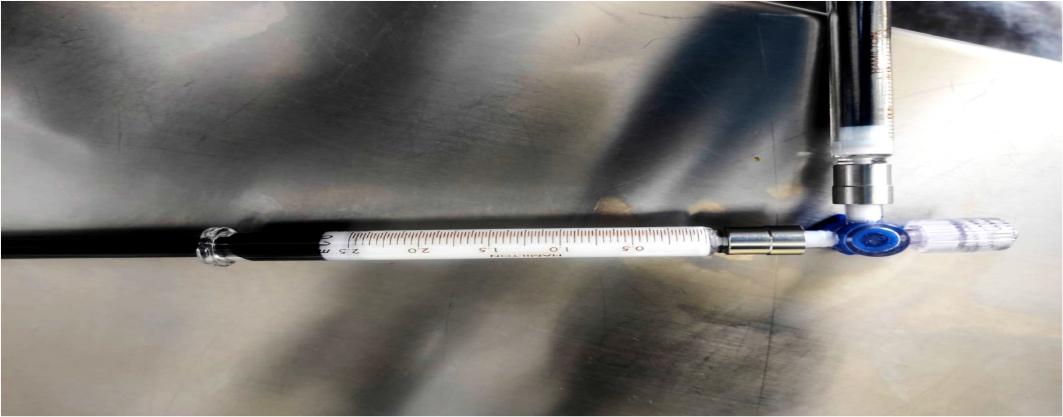
Figure 2
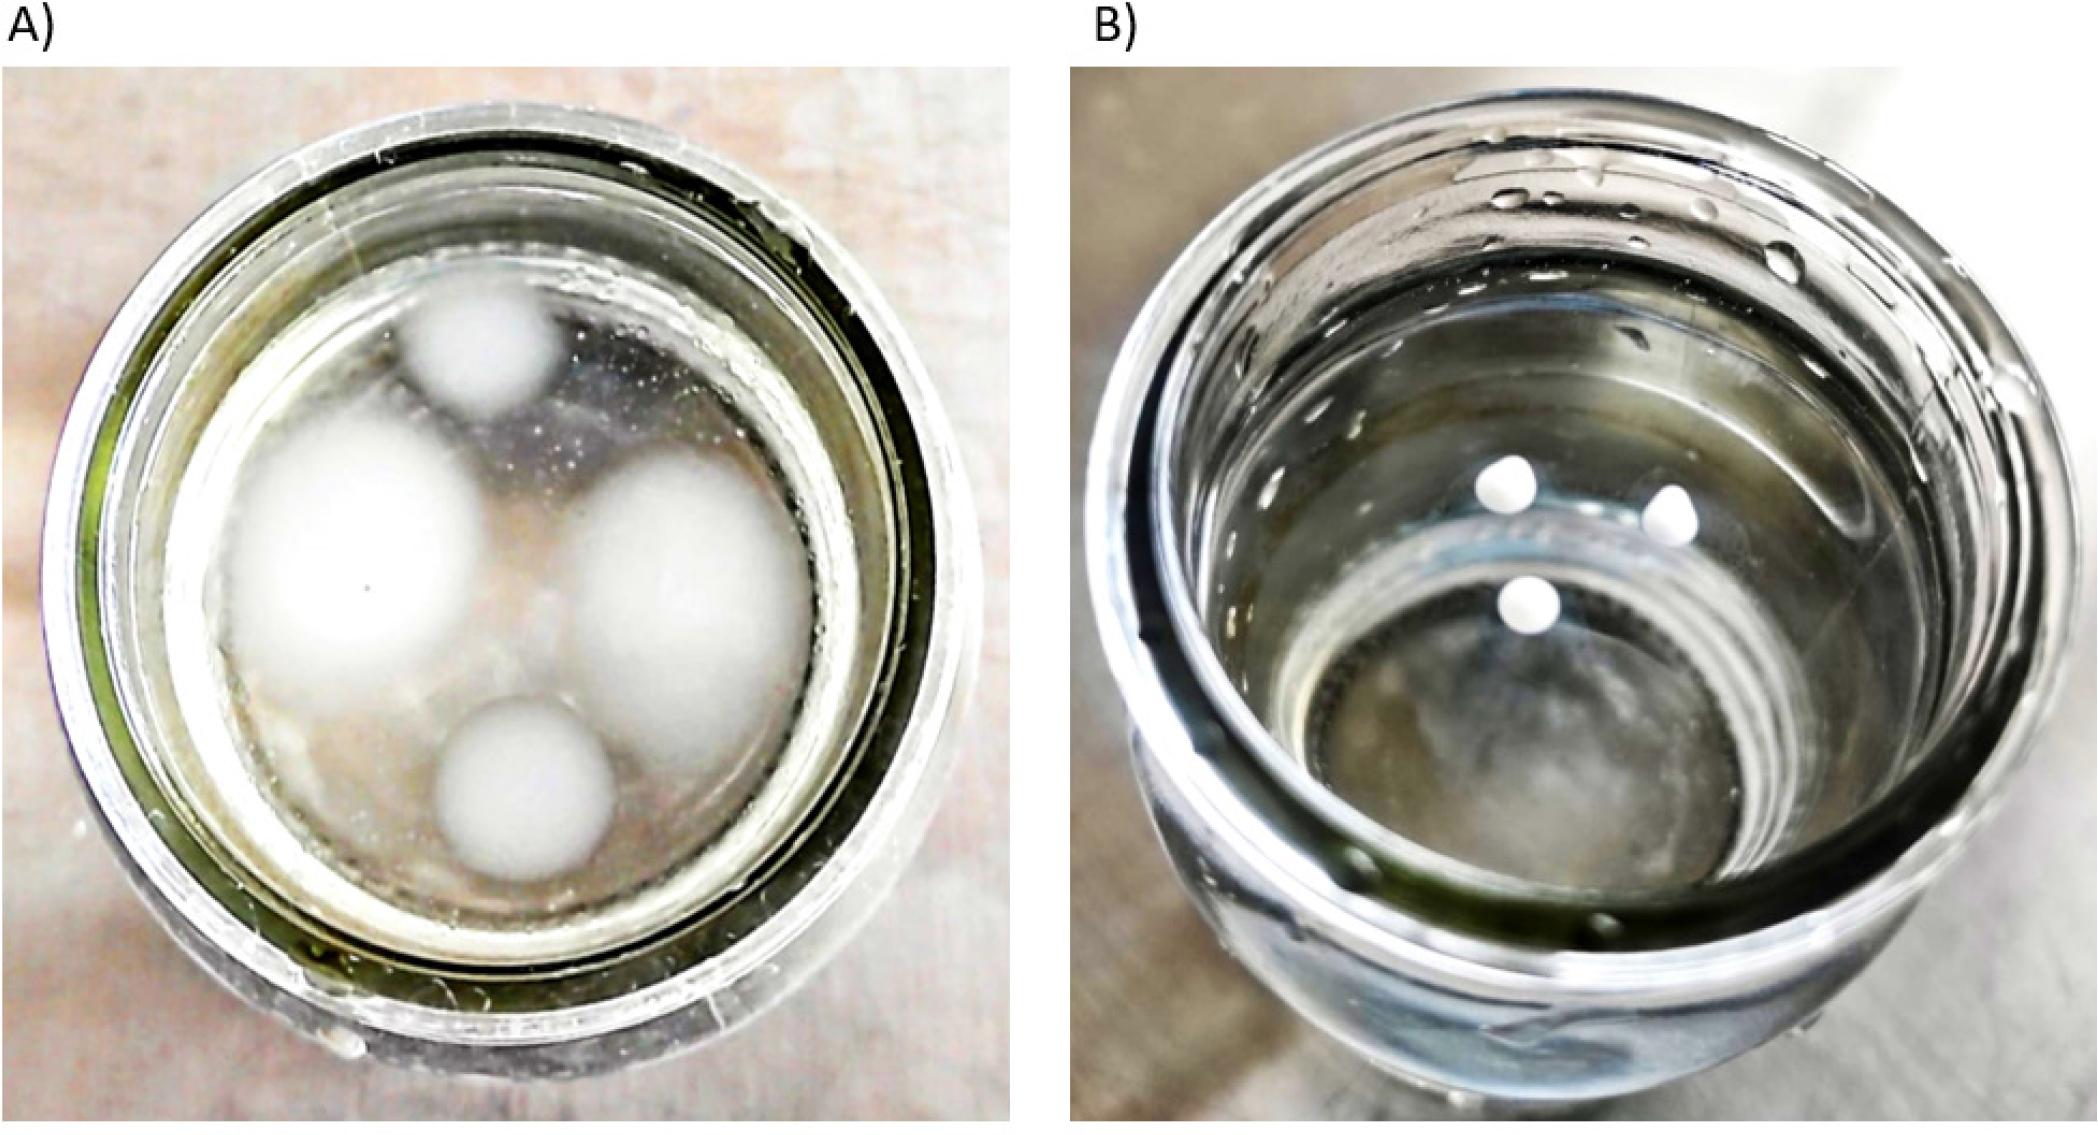
Figure 3
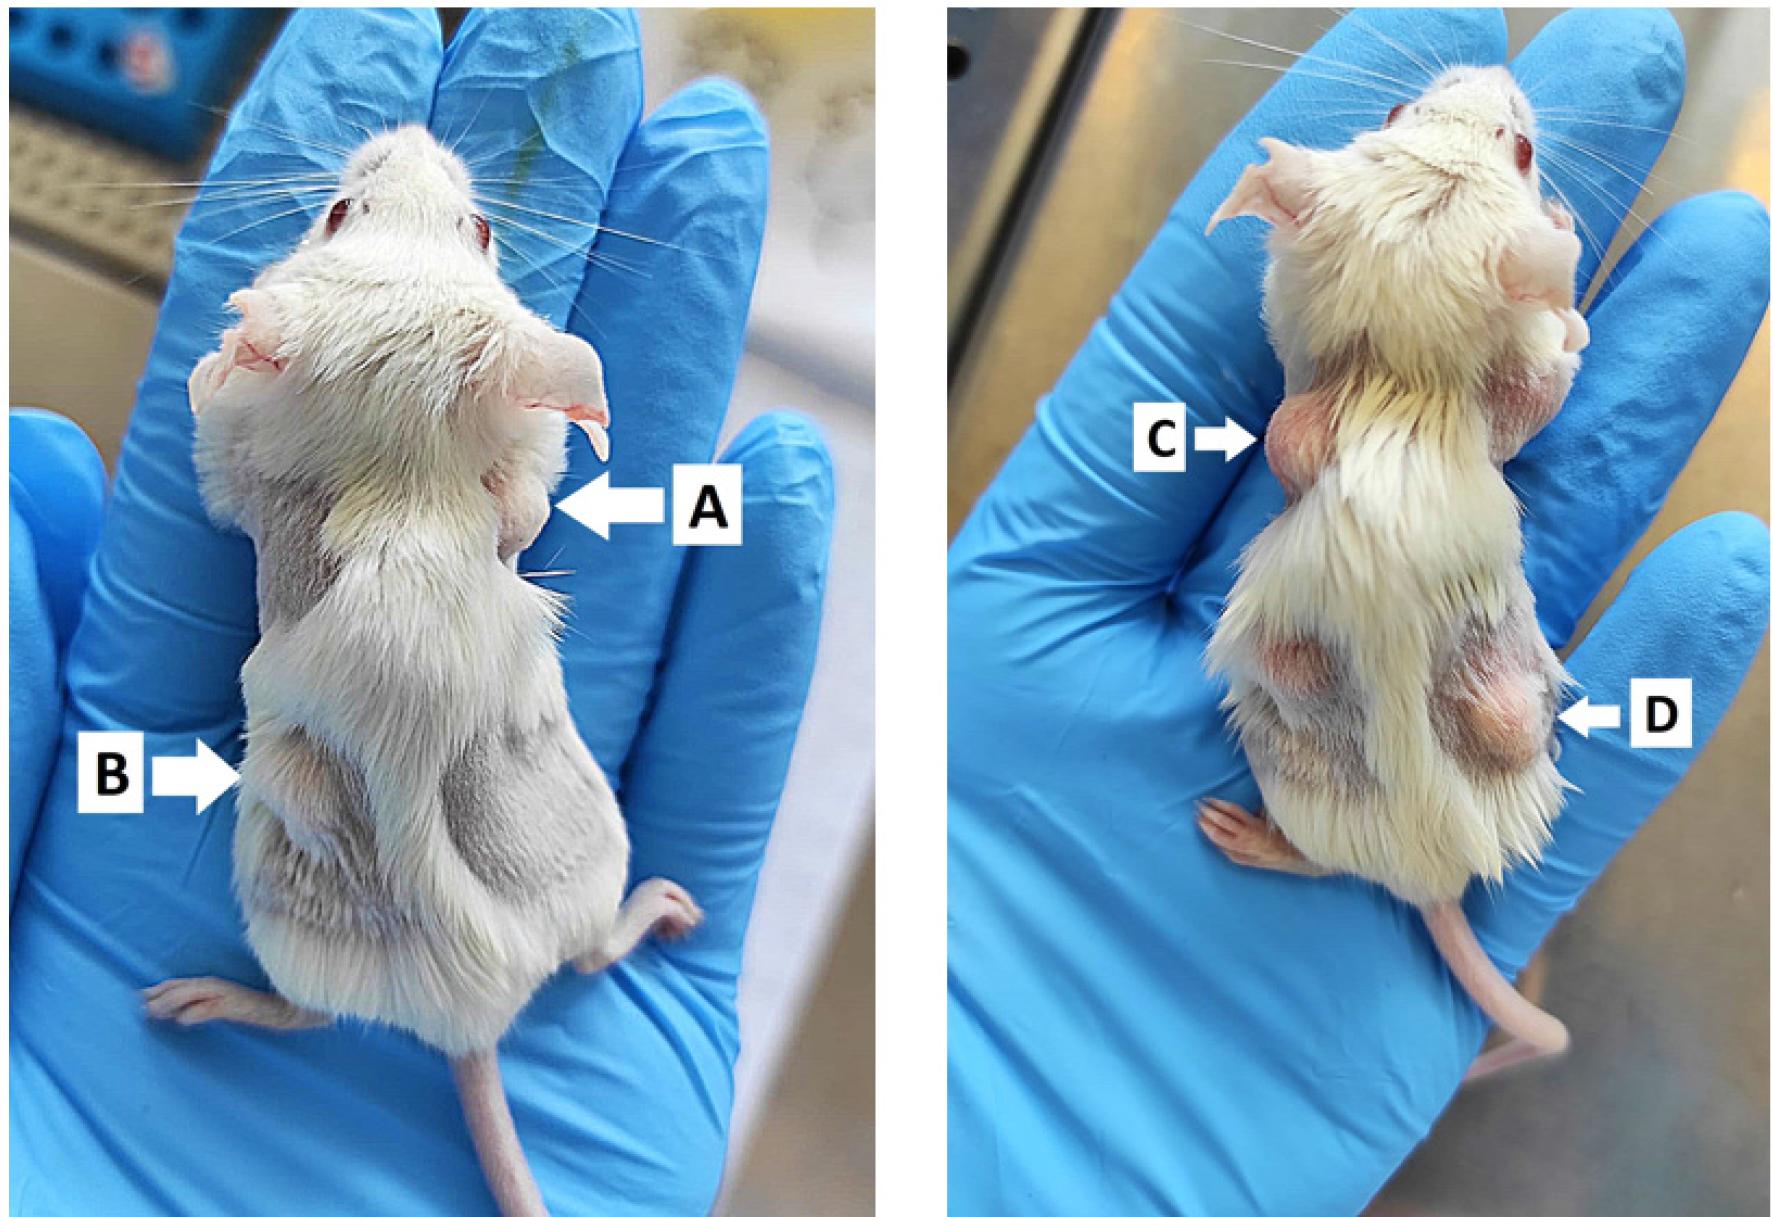
Figure 4
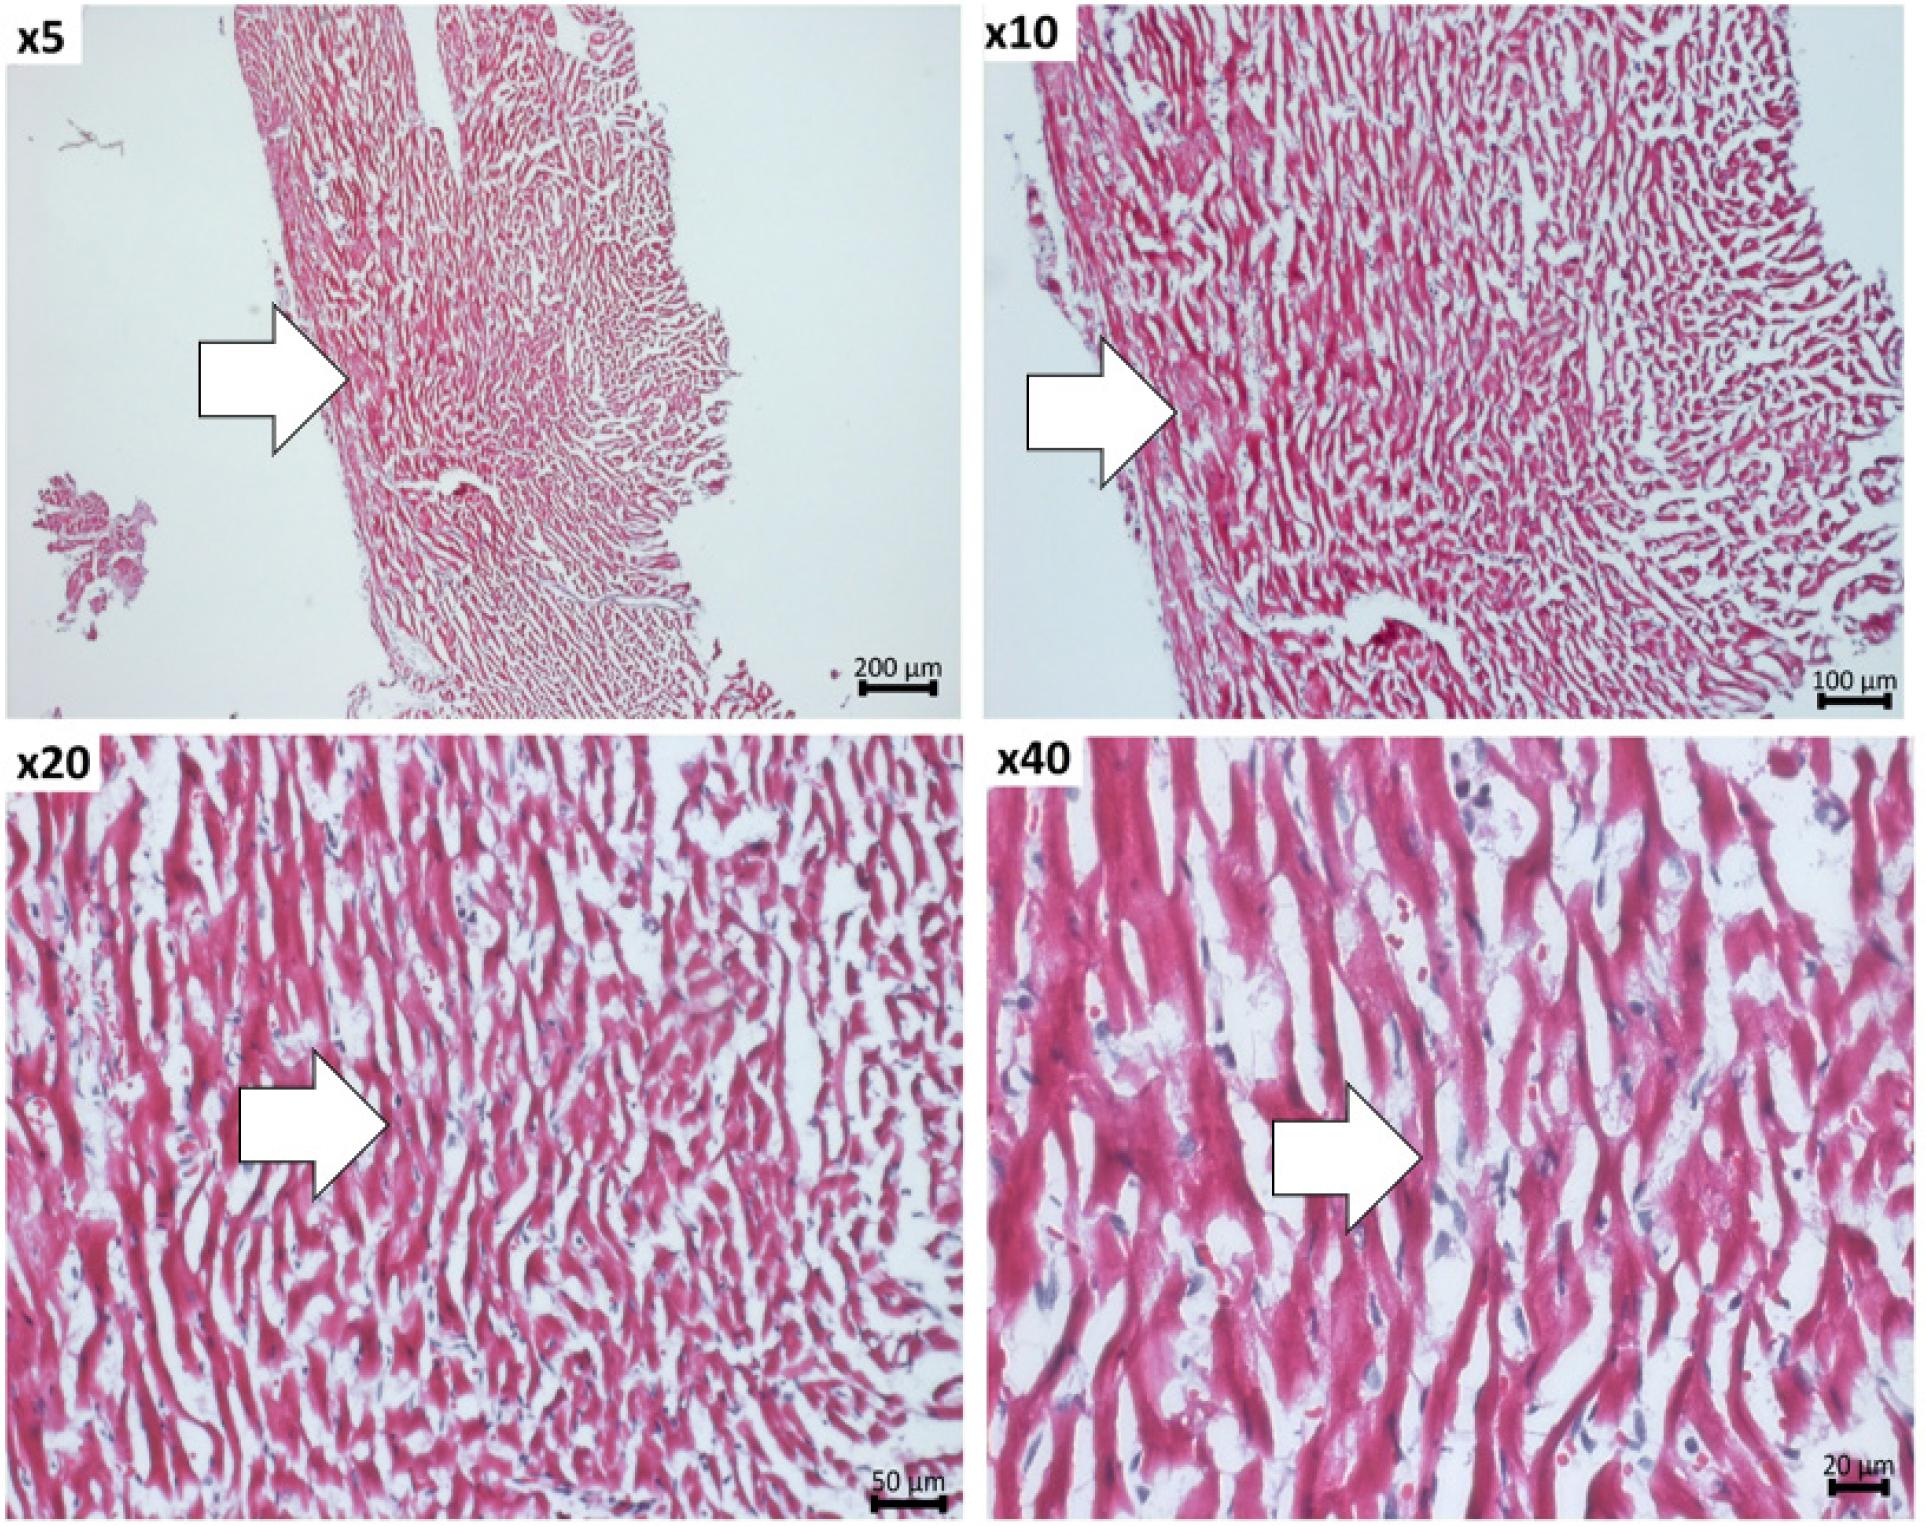
Figure 5
Figure 6
Figure 7
© 2025 Felicia-Luminita Dudu, Razvan-Mihai Fueriu, Gabriel Jakobsson, Mihaela-Loredana Vlad, Alexandra-Gela Lazar, Simona-Adriana Manea, Adrian Manea, Alexandru Schiopu, published by Romanian Society of Cardiology
This work is licensed under the Creative Commons Attribution 4.0 License.