Myocarditis is an inflammatory disease of the myocardium with a broad range of clinical manifestations ranging from moderate symptoms (chest pain, palpitations, decreased exercise tolerance) to severe arrhythmias that could lead to sudden death.1 The major long-term complication of myocarditis is chronic heart failure.2
Myocarditis can be caused by multiple pathogens, including cardiotropic viruses, bacteria (Staphylococcus spp., Streptococcus spp., Mycoplasma pneumoniae), and fungi (Aspergillus spp., Candida spp.)3 but it can also occur as a secondary reaction to systemic autoimmune diseases, vaccines, or oncological treatments.4,5
Recent epidemiological studies provide evidence that the incidence of myocarditis has progressively increased in recent years, currently ranging from 6.3 to 8.6 per 100,000 people.6 Importantly, myocarditis particularly affects the younger population, accounting for 25% of deaths in patients under 21 years of age.7
The pathogenesis of the disease is typically driven by activated T cells and anti-myocardial antibodies, leading to cardiac inflammation and cardiomyocyte damage. In the majority of patients, autologous immunomodulatory mechanisms can limit the immune activation and cardiac damage, but in some cases the pathogenic immune responses can lead to fibrosis, irreversible myocardial damage, heart failure, and dilated cardiomyopathy (DCM).8,9 Considering its heterogeneous nature, the diagnosis of myocarditis remains challenging and the available therapeutic options are limited, focusing on symptomatic control without addressing the underlying inflammatory causes of the disease.
The first successful induction of myocarditis in mice using purified Coxsackievirus B3 (CB3, Nancy strain) was reported in 1974, and to date it is the most commonly used virus-based model for inducing myocarditis in mice.10 To understand the autoimmune mechanisms in the pathogenesis of myocarditis, a group of scientists from the Department of Immunology and Infectious Diseases at Johns Hopkins Medical Institutions, Baltimore, Maryland, USA, conducted a study on two murine models.11 The first mouse model, induced by CB3 infection, replicated to some extent the complexity of clinical manifestations observed in human myocarditis, providing an important framework for understanding the virus–host interactions and the immune response triggered by the virus. The second model was obtained by immunization with a peptide fragment derived from the cardiac α-myosin heavy chain, allowing the study of autoimmune effects on the myocardium in the absence of viral influence. Both models lead to the development of myocardial inflammation, accompanied by a robust production of autoantibodies specific for cardiac myosin, enabling the study of the pathogenic processes involved in myocarditis.11
In the CB3 model, the disease progresses through three pathogenic phases: infection, autoimmune response, and dilated cardiomyopathy. The first phase is directly related to the viral infection and the inflammatory response following the infection. The second phase is characterized by mononuclear cell infiltration into the myocardium and the presence of heart-specific autoantibodies. Using immunochemical analyses, Alvarez et al. discovered that the cardiac myosin heavy chain is the major antigen recognized by heart-specific autoantibodies in genetically predisposed mice that develop myocarditis.11
To determine whether the autoantibodies are directly induced by the virus, they were tested for cross-reactivity with Coxsackie B3 (CB3) antigens. The results support the notion that autoantibodies against cardiac myosin do not cross-react with viral antigens. These observations are further supported by the differences in the timing of antibody appearance: Virus-neutralizing antibodies are detectable three days after infection, while myosin-specific autoantibodies are not identified until Day 15. This difference suggests distinct B cell populations. The production of myosin-specific autoantibodies is secondary to the viral-mediated myocardial injury, after which modified myosin becomes exposed and accessible to the immune system, highlighting the importance of the initial cellular damage in initiating the autoimmune response.11
Based on the experimental results, the researchers proposed a detailed pathological mechanism for CB3-induced myocarditis: viral infection causes myocardial injury and the recruitment of inflammatory cells. Cardiac myosin, an intracellular antigen, is released during the inflammatory process and captured either by dendritic cells resident in the myocardium or by invading macrophages. In both scenarios, myosin is fragmented and presented on major histocompatibility complex class II molecules on the surface of antigen-presenting cells to CD4+ T helper cells bearing T-cell receptors (TCRs) specific for cardiac myosin, thus triggering the autoimmune response.11 Further, the antigen-presenting cells and the myosin-specific T cells induce antibody production in B cells.
The link between viral myocarditis induced by CB3 and autoimmune myocarditis (EAM) is marked by the identification of cardiac myosin heavy chain as the major autoantigen, recognized by myocardial-specific autoantibodies, which mediate the development of autoimmune myocarditis post-CB3 infection. The second stage of viral myocarditis thus shares common mediators and pathways with autoimmune myocarditis.11
The same pathological process can be replicated through immunization with a peptide fragment from the cardiac α-myosin heavy chain (α-MHC). In this case, the antigen is administered subcutaneously in association with Complete Freund’s Adjuvant (CFA), facilitating the activation of antigen-presenting cells. The antigen is processed and presented to T cells carrying an α-MHC-specific TCR, inducing their activation, proliferation, and initiation of the autoimmune injury to the myocardium.11
The current method article presents the experimental model and technical procedures to induce experimental autoimmune myocarditis (EAM).11
The development of EAM is a multifactorial process, which depends not only on the presence of heart-specific T cells but also depends heavily on genetic predisposition. Immunization with α-MHC in CFA induces myocarditis only in susceptible strains. Mice on BALB/c, A/J, or A.SW backgrounds are sensitive to EAM, while mice on C57BL/6 backgrounds are resistant.12,13,14. Susceptible BALB/c, ABY/SnJ, and A/J mice develop a phenotype of DCM, characterized by chronic myocarditis, myocardial fibrosis, and cardiomyopathy, which are observed starting from approximately 28 days post-infection.15,16,17 C57BL/6 background mice do not develop the DCM phenotype18,19,20, except when treated additionally with lipopolysaccharide (LPS).21,22
The protocol used for inducing EAM in murine models is based on the method described by Čiháková and Rose.23 In several experimental autoimmune animal models, an appropriate immunogenic stimulus, such as CFA, which plays an important role in amplifying immune responses, is combined with the desired autoantigen. In our case, by using a peptide derived from the cardiac α-MHC emulsified in CFA, myocarditis can be reproducibly induced in mice without the need for viral infection. We use BALB/c mice, which are susceptible to EAM.24
CFA is commonly used to induce autoimmune diseases in murine models, but its mechanisms are not fully understood. A recent study compared the efficacy of CFA with Incomplete Freund’s Adjuvant (IFA) and TiterMax Gold (TMax) in inducing EAM in mice. The study discovered an important role for CFA in triggering IL-6 production during the initial phase of the immune response.24 In this study, the levels of total IgG and α-MHC-specific IgG (IgG1, IgG2a, IgG2b) were assessed on Day 21. Mice immunized with IFA or TMax showed significant increases in total IgG levels, but the myocardialspecific IgG levels remained low. In contrast, the α-MHC/CFA immunized group demonstrated a significant increase in myocardialspecific IgG levels, suggesting that CFA induces a more precise immune response against the antigen of interest, while IFA and TMax generate stronger but less specific responses.24
In the same study, the authors evaluated the effectiveness of the number of doses required to induce EAM. The mice were immunized with various combinations of CFA, IFA, and TMax on Days 0 and 7, and the severity of myocarditis was assessed through histology. The protocol using two doses of CFA proved to be the most effective in inducing EAM.24
Herein we describe the induction of EAM in 9-week-old female BALB/c mice using an α-MHC peptide emulsified 1:1 in CFA supplemented with 4 mg/mL inactivated Mycobacterium tuberculosis (M. tuberculosis). The addition of M. tuberculosis has the role of amplifying the immune response. Bacterial components (lipoproteins, peptidoglycans, mycolic acid) are recognized by specific Toll-like receptors (TLRs), which leads to the activation of innate immune cells that release cytokines (IL-1, TNFα, IL-6), creating a stronger proinflammatory environment at the site of antigen presentation.24
- 1.
Susceptible mouse strain, female BALB/c, 9 weeks old, grouped as follows: Mice with induced EAM (N=15), the non-immunized control group (N=9), and mice receiving CFA without α-MHC (N=10).
- 2.
Peptide derived from murine cardiac α-MHC (Anaspec AS-62554, position 614–643, sequence Ac –RSLKLMATLFSTYASADR– OH, 1 mg per vial).
- 3.
CFA (Sigma Aldrich: F5881, USA), supplemented with 4 mg/mL of heat-inactivated H37Ra strain of M. tuberculosis, which does not cause infection but is essential for stimulating the immune response (Difco, Detroit, USA).
- 4.
Phosphate-buffered saline (PBS) 1%, sterile, without Ca2+ and Mg2+.
- 5.
Hamilton® 2.5 mL syringes with grooves, series 1000 GASTIGHT®, Luer Lock (Hamilton, Nevada).
- 6.
1mL plastic syringes.
- 7.
Sterile needles.
- 8.
Two-way stopcock with Luer-Lock (Discofix®, Switzerland).
The mice were purchased from the National Institute for Research and Development in Military Medicine Cantacuzino (Bucharest, Romania). The mice were acclimatized to specific pathogen-free (SPF) facility conditions, exposed to 12-hour light/dark cycles, and provided ad libitum access to standard rodent food throughout the experimental procedure. On Day 0, the mice were immunized by subcutaneous injection with 100 μL of emulsion, prepared and injected as described below. A control group was also included, which was not immunized. One week after the initial injection, the EAM mice received a booster injection with the same amount of emulsion.
The studies were conducted in accordance with the regulations of EU Directive 2010/63/EU on the protection of animals used for scientific purposes, and the experimental protocols were approved by the ethical committee of the Institute of Cellular Biology and Pathology ‘Nicolae Simionescu’ (#-9/10.11.2022) and The National Sanitary Veterinary and Food Safety Authority of Romania (# 32/13.11.2023).
Here we detail the essential steps for the correct preparation of the emulsion, highlighting the importance of each stage, with each aspect having a significant impact on the success of the model.
- 1.
Calculate a total volume of 200 μL CFA (100 μL per immunization) for each mouse, both for the CFA only and for the CFA:α-MHC groups. Calculate from the beginning the total volume of CFA needed and add 10-20% extra. For 1 mL of CFA solution that will be used for the immunizations, weigh 4 mg of heat-inactivated M. tuberculosis H37Ra (BD Difco™) and add to 1 mL of CFA. Vortex to obtain a complete CFA solution with a concentration of 4 mg/mL M. tuberculosis.
- 2.
Reconstitute each vial of 1 mg α-MHC peptide dry substance by adding 500 μL PBS, vortex vigorously and leave for 15 minutes at room temperature. The concentration of the reconstituted peptide will be 2 mg/mL.
- 3.
Calculate the total volume of complete CFA:α-MHC emulsion needed for the initial and for the booster immunizations. Each EAM animal requires a volume of 200 μL emulsion for each immunization, totaling 400 μL per mouse. The control group is immunized with the same total volume of complete CFA:PBS emulsion, but without the addition of α-MHC. Prepare enough complete CFA:α-MHC and complete CFA:PBS emulsions for all the mice included in the experiment, for both immunizations, adding at least 20% extra for the spill. For example, a group of 10 EAM mice will require a total volume of 4 mL emulsion. Prepare 4.8 mL emulsion by mixing 2.4 mL complete CFA with 2.4 mL reconstituted α-MHC peptide in PBS. For the control group of 10 mice, mix 2.4 mL complete CFA with 2.4 mL PBS.
- 4.
The final complete CFA:α-MHC emulsion will contain 2 mg/mL M. tuberculosis and 1 mg/mL α-MHC peptide.
- 5.
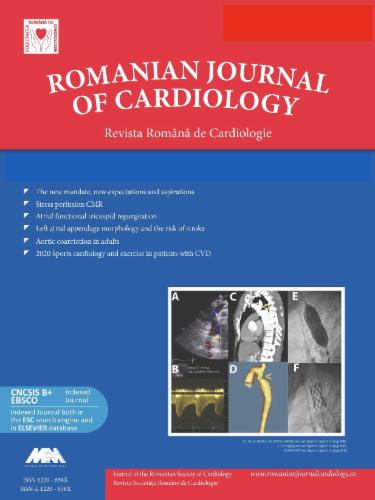
The volume of complete CFA solution that will be mixed is vortexed again to ensure uniform distribution of M. tuberculosis and is drawn into a Hamilton syringe, filling no more than 50% of the total syringe volume. The syringe is then attached to the two-way stopcock with Luer-Lock and the plunger is pushed to remove any air bubbles (Figure 1).
- 6.
The reconstituted MHC solution in PBS is drawn into the second Hamilton syringe, in an amount equivalent to the volume of the CFA solution. The plunger is then pushed until the solution reaches the tip of the syringe, eliminating any air bubbles (Figure 1).
- 7.
With slow pressure applied to the plungers, the two solutions are gradually mixed. It is very important to keep the valve tightly closed to prevent the emulsions from leaking.
- 8.
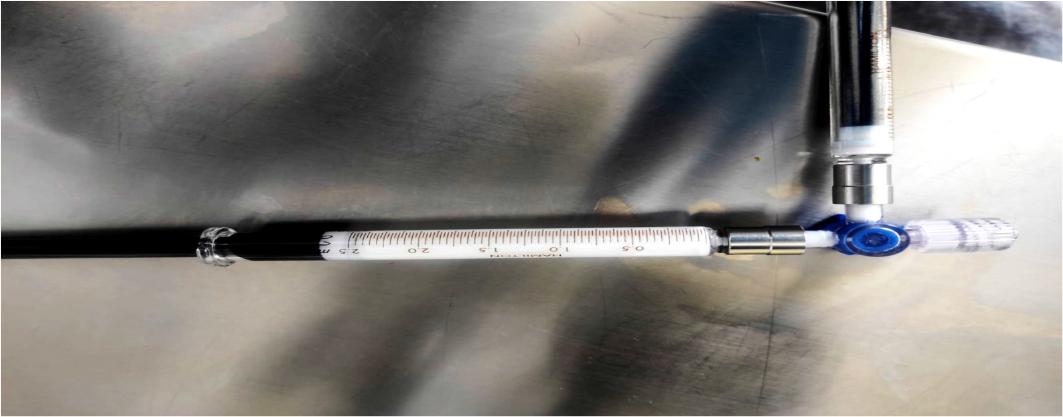
The emulsion is continuously mixed for at least 45–60 minutes to achieve the desired stability. The consistency can be checked by applying a drop to water. The emulsion must remain compact and not disperse quickly (Figure 2).
- 9.
After achieving stability, the solution is extracted into a 1 mL plastic syringe. The emulsion remains stable at 4°C for up to one month and can be reactivated by further mixing if necessary.
Attaching the 2.5 mL Hamilton® syringes to the two-way stopcock with Luer-Lock to prepare the emulsion.
Testing the consistency of the emulsion on the water surface: A) Representative image showing the emulsion after 1 hour of continuous mixing. Note the droplet dispersion, the resulting emulsion is not suitable for injection. B) Achieving stable emulsion consistency after 2.5 hours of continuous mixing. The emulsion remains compact and is ready to use.
Important notes:
- –
A 10-20% loss is estimated during the emulsion preparation process.
- –
The stability of the emulsion is crucial for the induction of EAM, and slow mixing during the initial phase of the process is the determining factor.
- –
The use of supplemented (complete) CFA is mandatory. Replacing it with alternative adjuvants, such as Incomplete Freund Adjuvant (without M. Tuberculosis), compromises the induction of myocarditis.
- –
If the emulsion remains fluid after 1 hour of mixing, it may be too warm. Placing the syringes on ice for about 30 minutes will help achieve a stable emulsion.
It is imperative that each mouse in the experiment receives the same amount of antigen. To ensure uniform doses, air bubbles must be removed from the emulsion, and the handling of the needle should be done carefully to prevent emulsion loss.
On Days 0 and 7, the mice were subcutaneously injected with 200 μL complete emulsion, containing a total of 200 μg α-MHC peptide, divided equally between the lower flank and shoulder to reduce local discomfort. The procedure is as follows:
- 1.
Induce anesthesia by 4% isoflurane inhalation.
- 2.
After anesthesia induction, 2% isoflurane is administered continuously through the inhalation mask.
- 3.
The flanks and shoulder areas on both sides of the mice are carefully shaved for optimal accessibility of the injection sites.
- 4.
The injection sites are disinfected with betadine to minimize the risk of infection.
- 5.
A 23 G needle is attached to a 1 mL syringe containing the CFA:α-MHC peptide emulsion, or the CFA:PBS emulsion for the control mice, ensuring the needle is fully filled with the emulsion by pressing the plunger.
- 6.
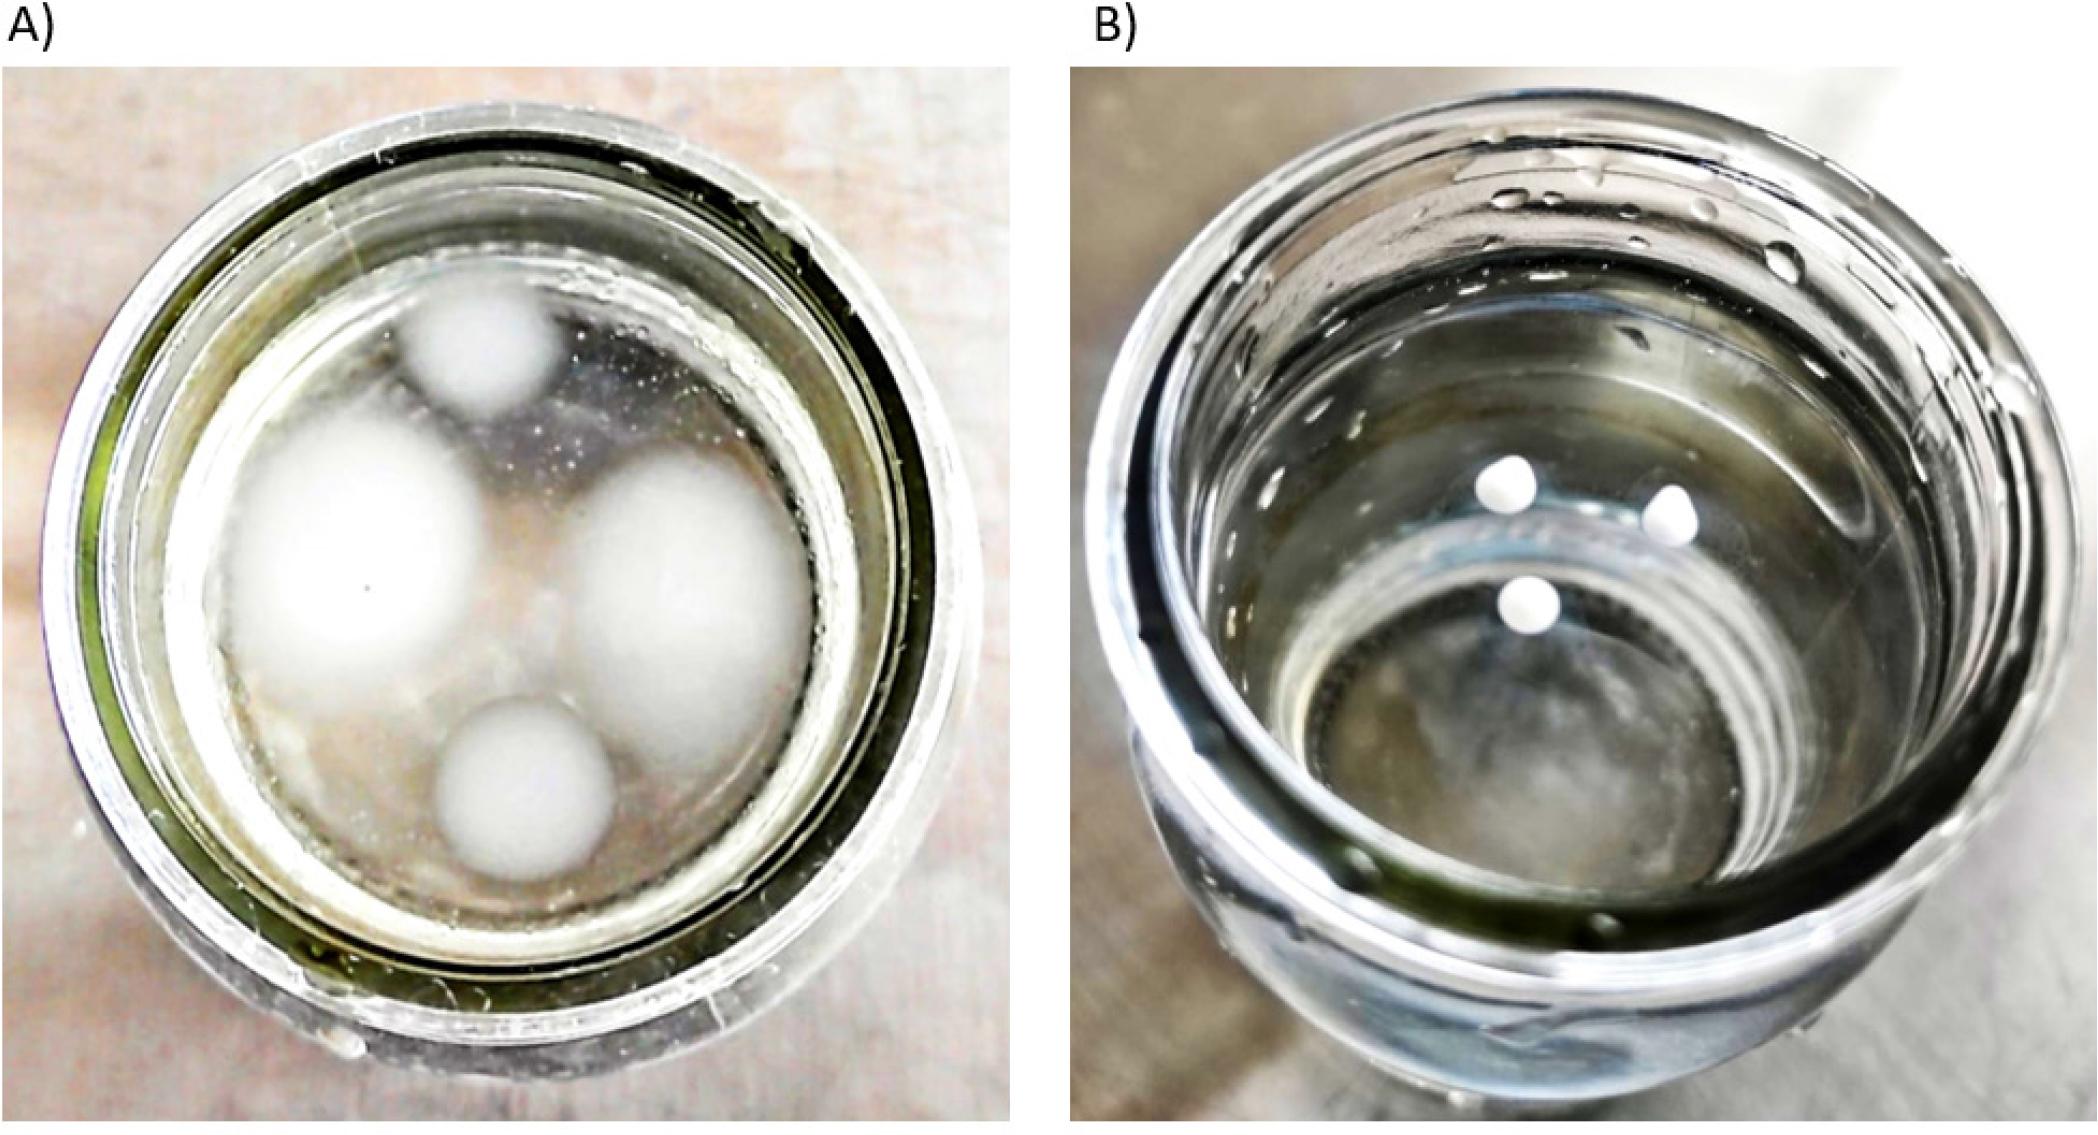
The skin along the midline of the back is lifted, and the needle is inserted 0.5-1 cm under the skin, at the level of the right scapula, slowly administering 100 μL of emulsion. This should form a white subcutaneous bump (Figure 3A–B).
- 7.
Another 100 μL of emulsion is injected with the same syringe on the left lower flank of the mouse.
- 8.
Booster: The booster immunization is administered 7 days after the first immunization. A volume of 100 μL emulsion is injected on the left scapula and right lower flank (Figure 3C–D). This is very important, in order to avoid skin wounds due to the potent pro-inflammatory local effect of the CFA.
Day 0 - Subcutaneous injection of 100 μL of CFA:α-MHC or CFA:PBS emulsion. A) Cranial, over right scapula. B) Caudal, over left lower flank. Day 7 - Subcutaneous injection of 100 μL of CFA:α-MHC or CFA:PBS emulsion. C) Cranial, over left scapula. D) Caudal, over right flank.
At 21 days after the initial immunization, the animals were sacrificed, the blood was collected by cardiac puncture, and the hearts were harvested. After harvesting, the hearts were fixed overnight at 4°C in a 4% paraformaldehyde solution in 0.1Mphosphate buffer, pH 7.4, followed by cryoprotection with glycerol solutions in 0.1M phosphate buffer. The steps for cryoprotection: 15 minutes at room temperature in 5% glycerol, 1 hour at 4°C in 10% glycerol, overnight at 4°C in 20% glycerol, and 1 hour at 4°C in 50% glycerol. If the samples are not used immediately, they are stored in 50% glycerol at -20°C. For cryosectioning, the samples are gradually warmed from -20°C to 4°C.
Cryosectioning involves six successive washes of 15 minutes with 0.1M phosphate buffer containing 3% sucrose, embedding in medium for frozen tissue specimens OCT (Optimal Cutting Temperature) at -30°C, rapid freezing in liquid N2. The sectioning of the OCT block begins with a thickness of 20μm and continues to-10μm as it approaches the sample. The heart is cut in 5μm thick sections, which are mounted on SuperFrost Plus™ microscope slides (Thermo Scientific).
For hematoxylin-eosin staining, the following steps were performed: The samples were rinsed in PBS for 15 minutes at 4°C, followed by permeabilization with methanol cooled to -20°C for 15 minutes at 4°C, staining with hematoxylin at room temperature for 3 minutes, washing with distilled water, staining with eosin for 30 seconds, successive washes with ethanol (75%, 90%, 100%) for 30 seconds. Three successive washes of 5 minutes with xylene were performed to remove alcohol. Canada balsam was used to mount the slides. The sections were examined and photographed using an inverted microscope (Zeiss Axio Observer). The hematoxylin-eosin staining reveals the presence and location of the inflammatory infiltrate (Figure 4).
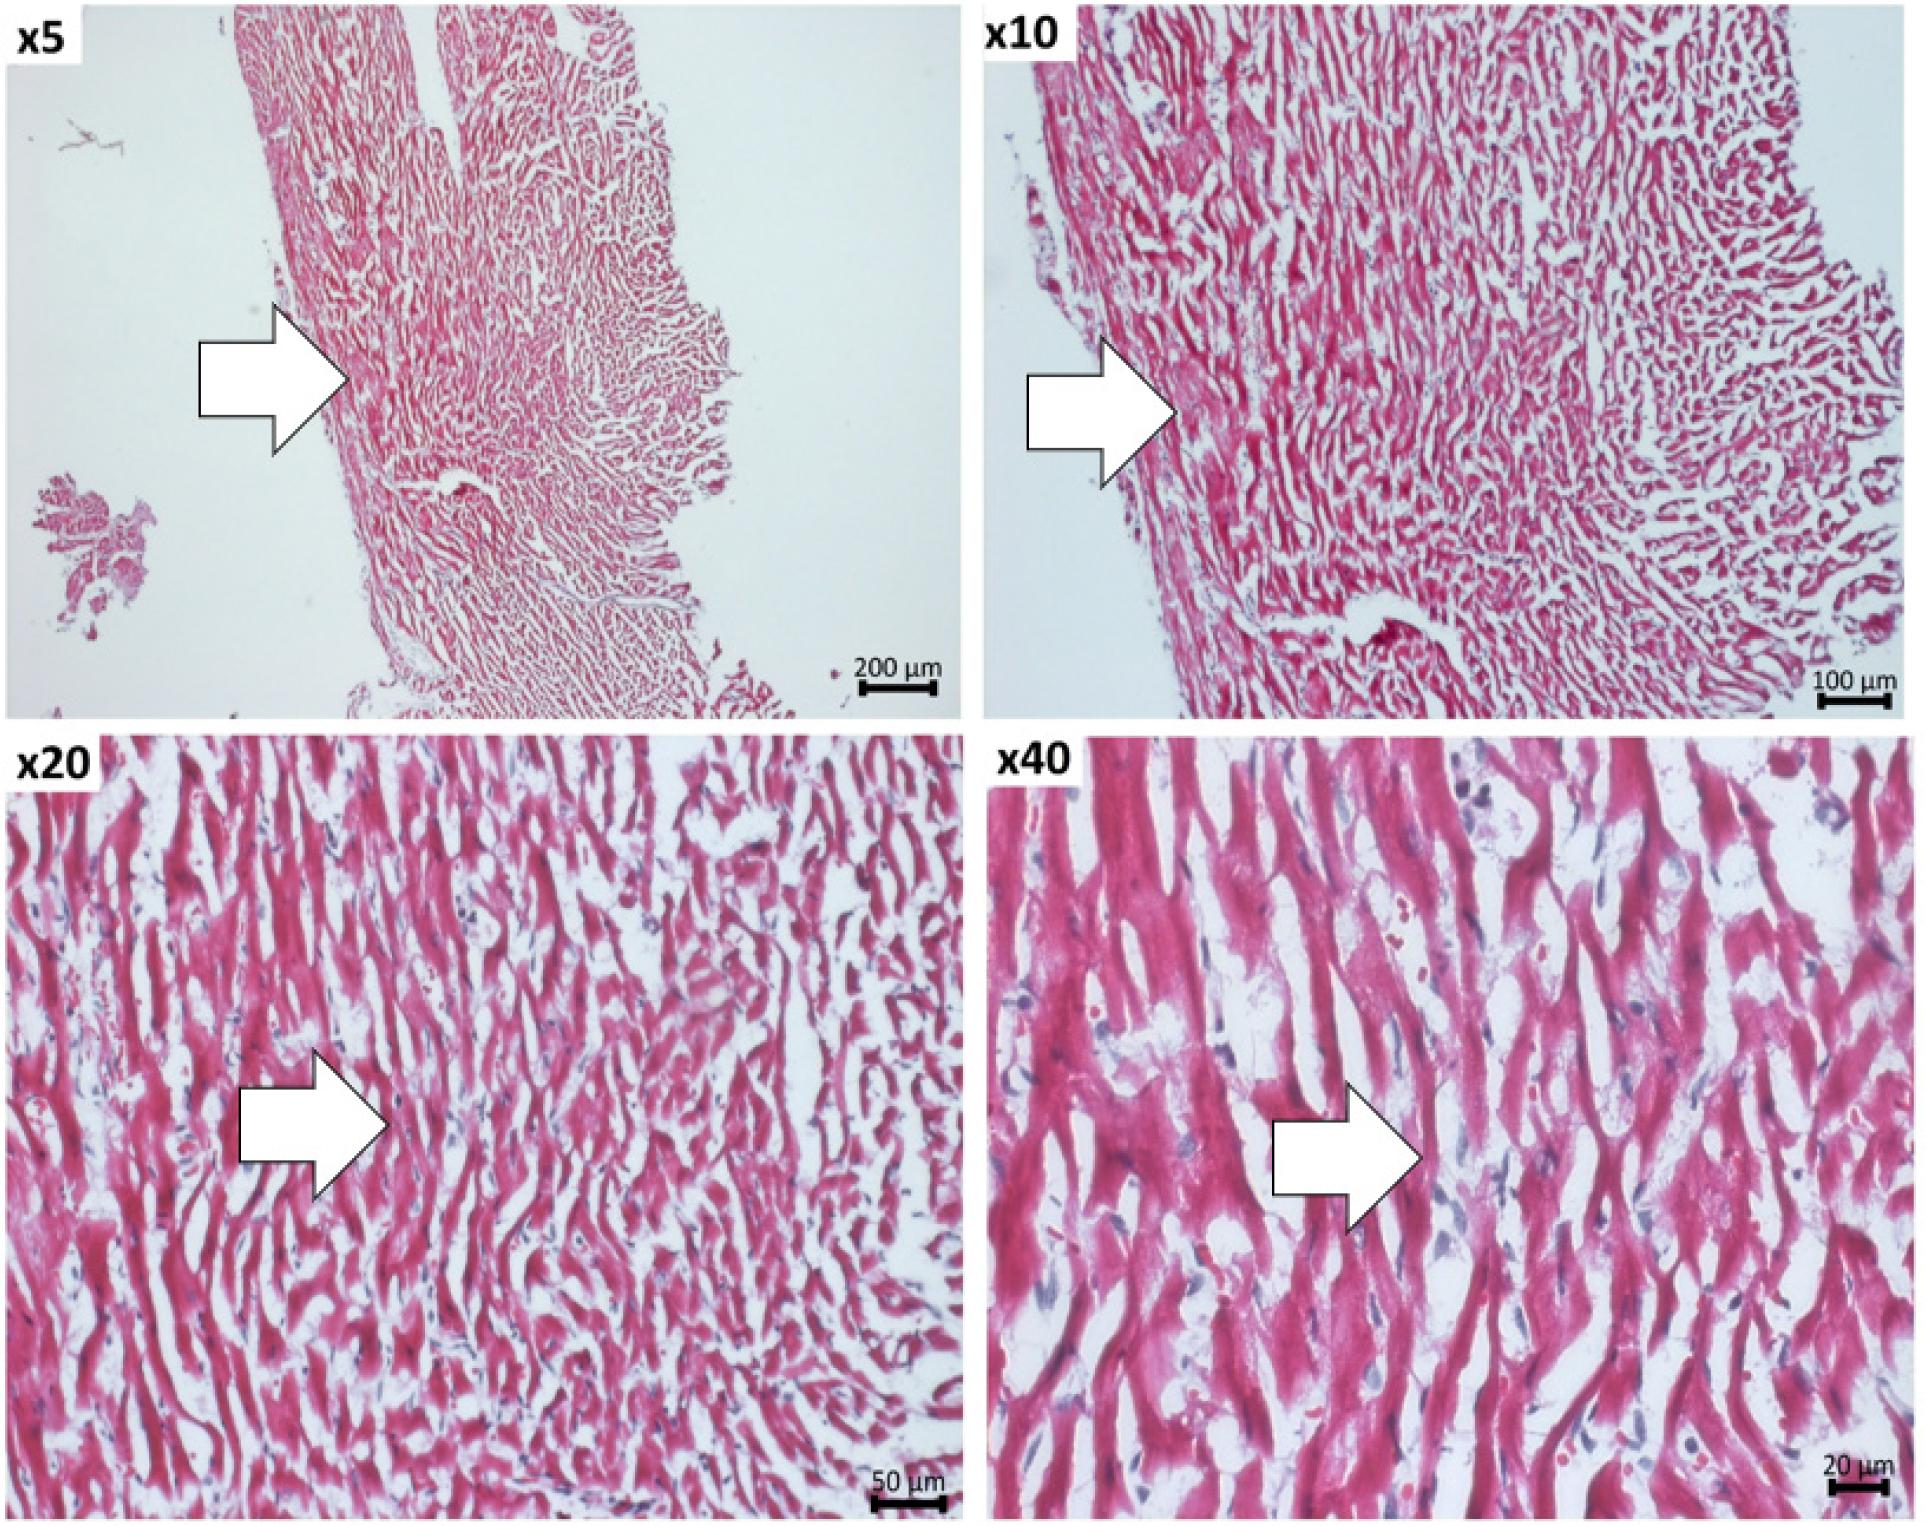
Representative hematoxylin-eosin images taken at 5x, 10x, 20x and 40x magnification, depicting the immune cells infiltration in the myocardium of EAM mice. The area of immune cell infiltrate is marked with arrows.
For the detection of fibrosis, the slides with 5 μm heart sections are washed with Phosphate Buffered Saline for 15 minutes at 4°C, followed by permeabilization with methanol cooled to -20°C for 15 minutes at 4°C, six successive washes of 3 minutes with ethanol at decreasing concentrations (100%, 95%, 70%). Fibrosis detection is achieved through staining with Picrosirius Red for 60 minutes, following the manufacturer’s recommendations, followed by washes with acetic acid, 100% ethanol, and xylene, followed by mounting with Surgipath Acrytol. The Picrosirius Red staining reveals the intensity and location of myocardial fibrosis (Figure 5).
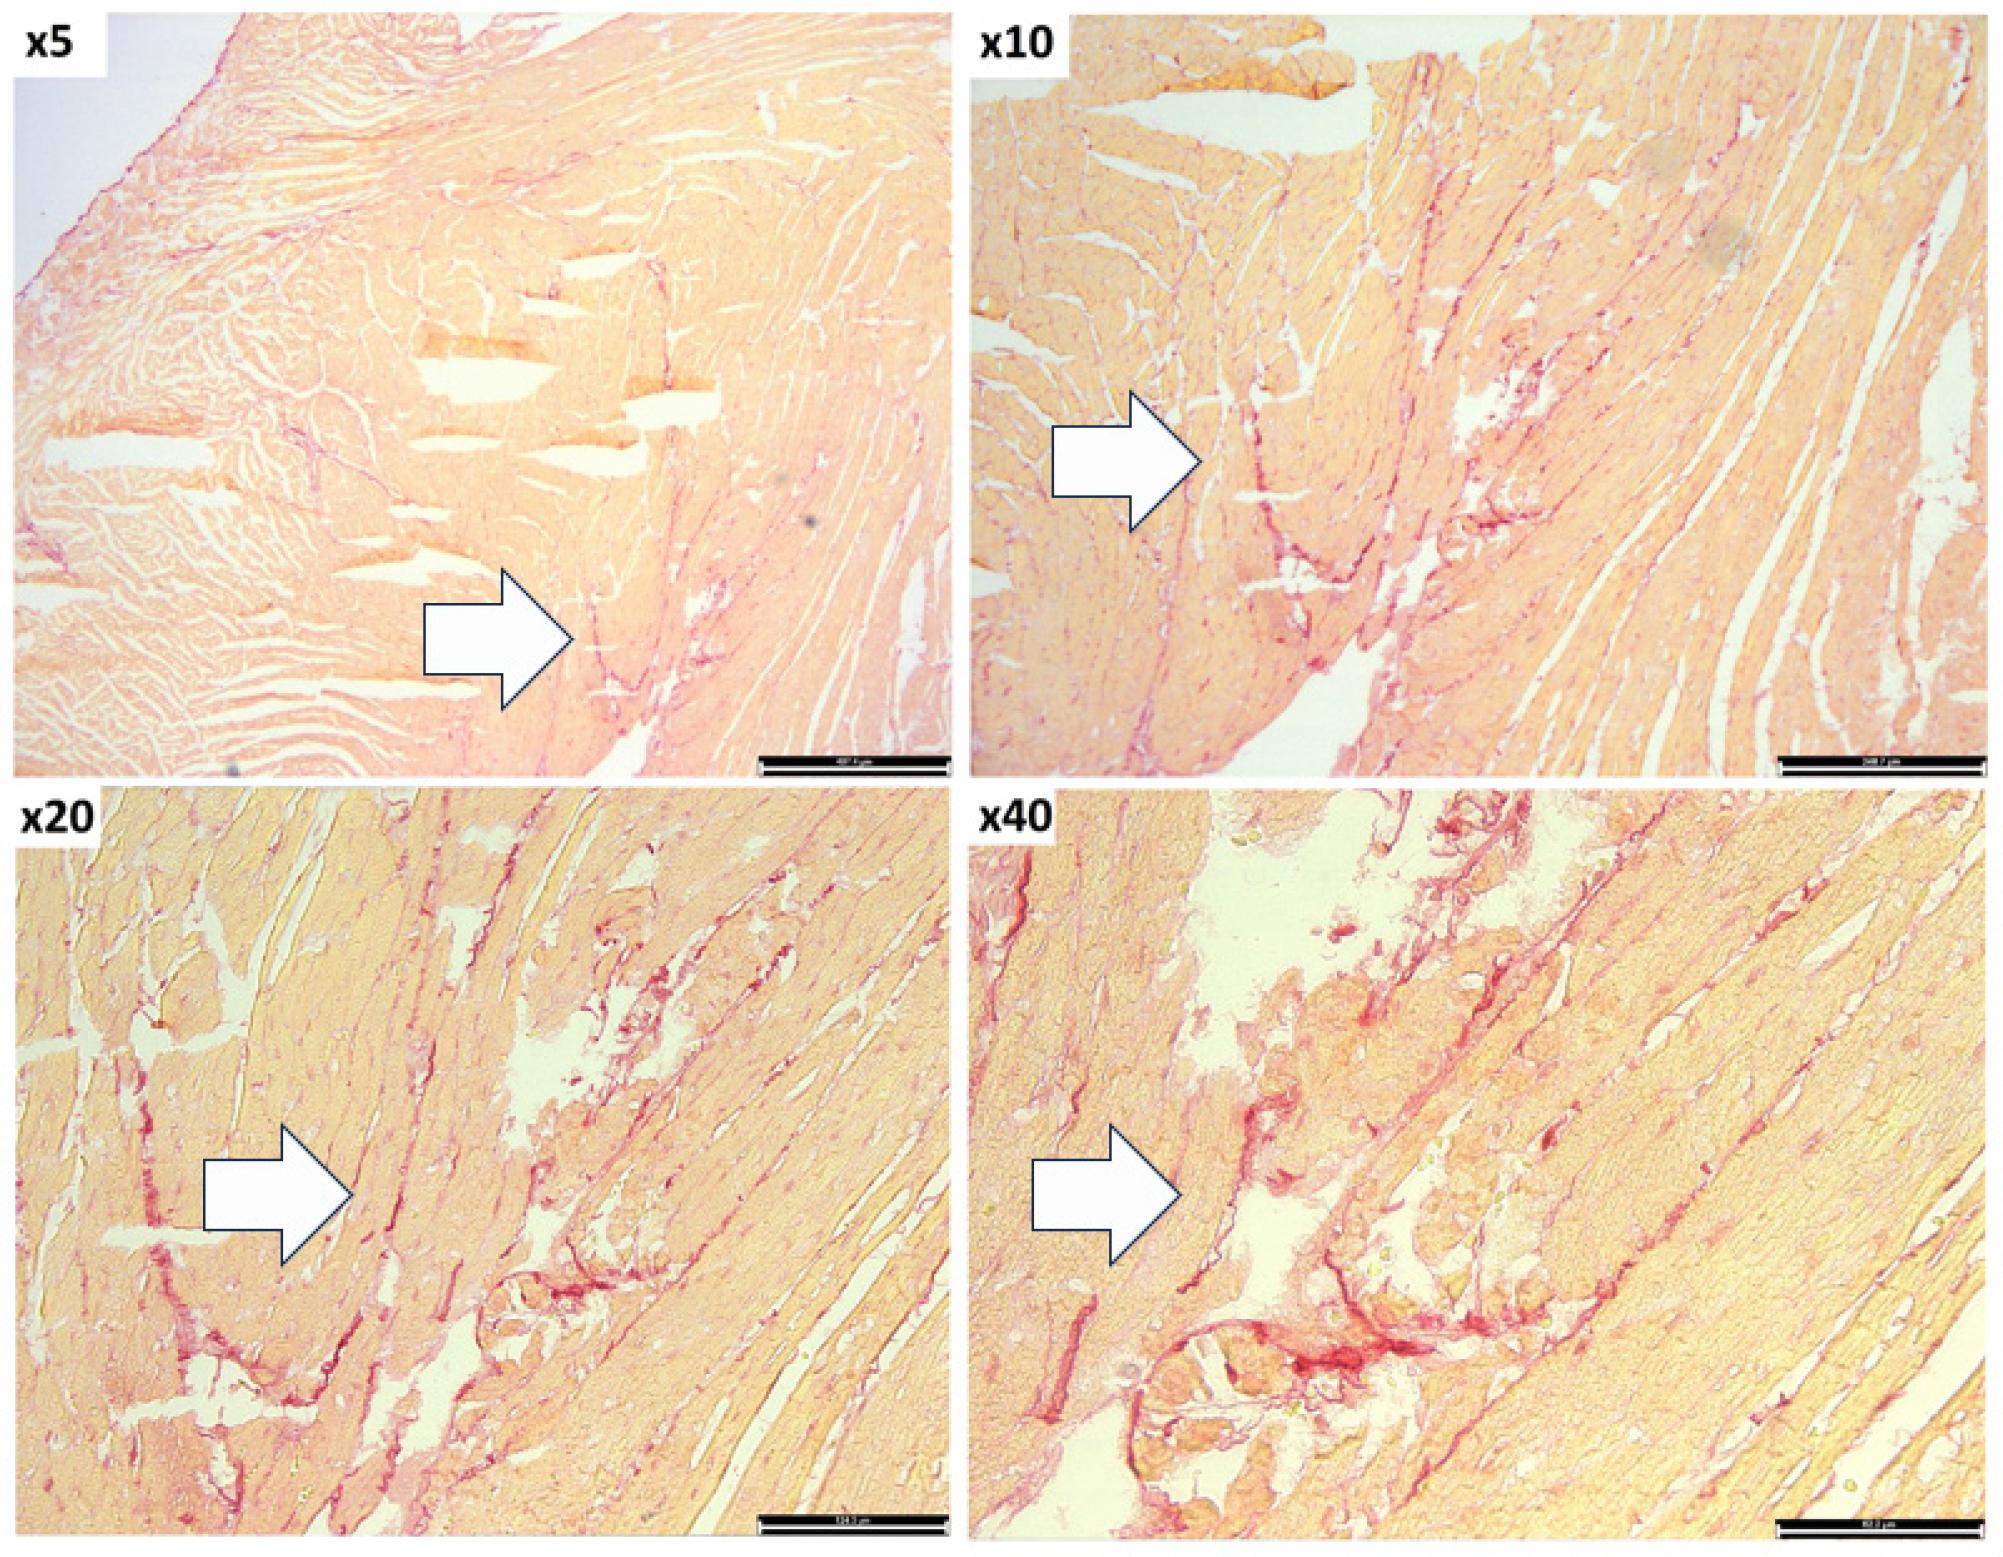
Analysis of fibrosis within myocardium of EAM mice by Picrosirius Red staining. The images were taken at 5x, 10x, 20x and 40x magnification. The cardiomyocytes are stained in light orange and the collagen fibers in red. Arrows indicate the accumulation of collagen fibers.
The impact of EAM on cardiac function has been assessed by echocardiography. This non-invasive technique allows repeated measurements of the left ventricular ejection fraction, end-systolic and end-diastolic volumes, stroke volume and cardiac output. The maximum recommended frequency of echocardiographic examinations is once a week, until harvest, starting on Day 21 post-immunization. In our experiment the echocardiographic measurements were performed on Day 21 after the first immunization, under 2% isofluorane anesthesia, using a VEVO 2100 imaging system (VisualSonics) instrument (Figure 6). The examination revealed a significant drop in left ventricular ejection fraction (EF) in the group that received the α-MHC peptide (48.71 ± 5.50%), compared to the non-immunized control group (54.61 ± 3.32%) and with the group that received only the CFA (55.44 ± 4.05%). Also, examination of cardiac output revealed a significant decrease in the group receiving α-MHC (6.09 ± 1.50%) compared to the group receiving only CFA (7.96 ± 2.17%) (Figure 6). There was a considerable spread in all the recorded echocardiographical parameters, which is to be expected in this model due to differences in heart size at baseline and in the severity of the disease that develops during the duration of the experiment, despite identical immunization at baseline.
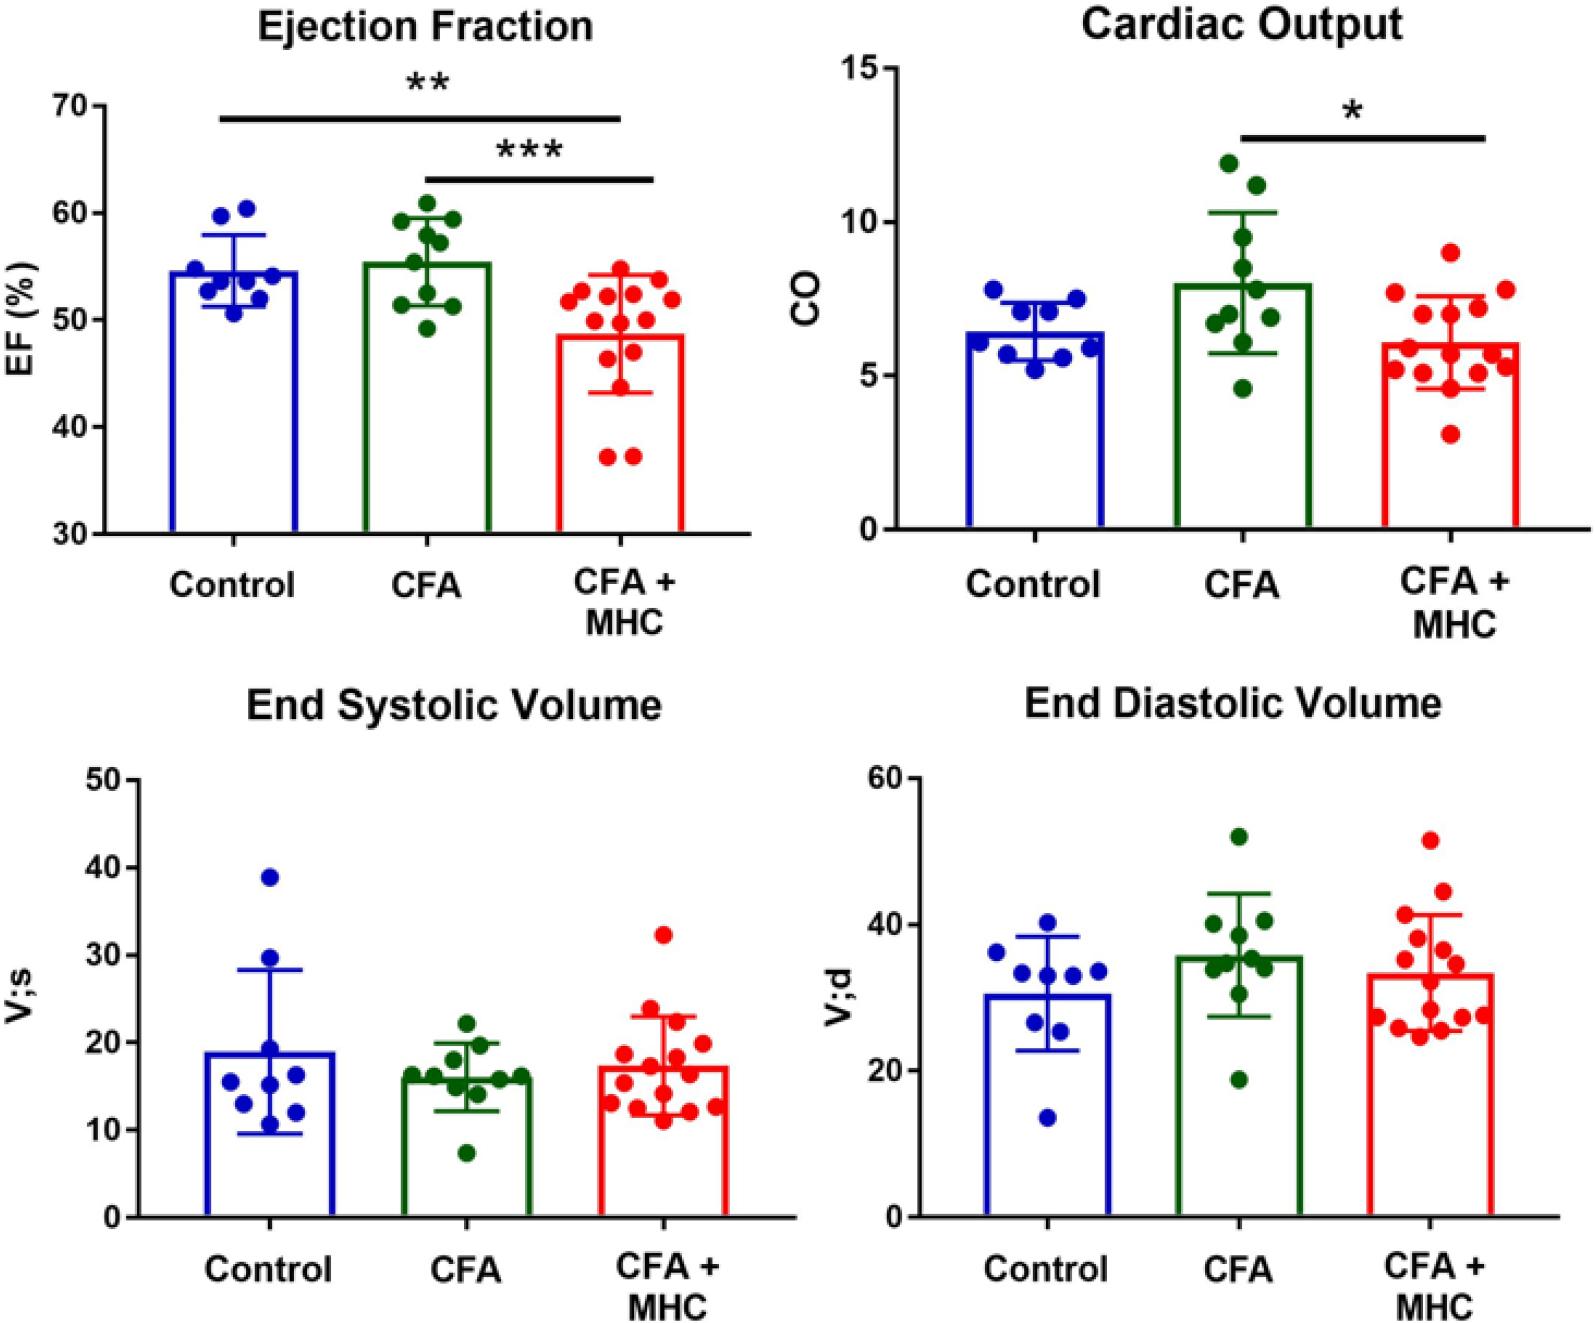
Analysis of cardiac function by echocardiography on Day 21 after disease induction. The mice with induced EAM (N=15) have significantly reduced left ventricular ejection fraction compared to the non-immunized control group (N=9) and to the mice receiving CFA - α MHC (N=10). Cardiac output was also reduced in EAM mice compared to CFA controls. The mice did not suffer left ventricular dilation at this early stage of the disease compared to controls.
To examine immune cell dynamics in EAM and controls, immune cells were isolated from the heart, blood, and spleen and analyzed by flow cytometry. The mice were sacrificed by ketamine-xylazine overdose followed by cervical dislocation and perfusion with 20 mL PBS through the left ventricle to remove residual cardiac blood. The hearts were isolated and the atria were removed. To dissociate and purify cardiac immune cells, the hearts were finely minced using surgical scissors and placed into tubes containing 1 mL digestion mix containing Collagenase I, 450U/mL; Collagenase XI, 125U/mL; DNAase I, 60U/mL; Hyaluronidase, 60U/mL in Ca2+ and Mg2+ free PBS. The hearts were incubated for 45 minutes at 37°C with 450 RPM shaking. Single-cell suspensions were obtained by passing through 70um cell strainers followed by washing. Blood was isolated using cardiac puncture and subjected to red blood cell lysis using ACK lysis buffer for 3 minutes at RT until erythrocytes were no longer apparent. Spleens were passed through 70um cell strainers followed by red blood cell lysis with ACK lysis buffer for 3 minutes at RT. Single-cell suspensions were stained in Mg2+ and Ca2+-free PBS supplemented with 0.5% BSA and 2.5mM EDTA. The following antibodies were used: Ly-6G (1A8, BioLegend), MHC-II (M5/114.15.2, BioLegend), Siglec-F (E50-2440, BD Biosciences), Ly-6C (HK1.4, BioLegend), CD64 (X54-5/7.1, BioLegend), CD11c (N418, BioLegend), CD11b (M1/70, BioLegend), CD115 (AFS98, BioLegend), CD45 (30-F11, BioLegend), CD44 (IM7, BioLegend), CD3 (17A2, BioLegend), CD4 (GK1.5, BioLegend), CD8 (53-6.7, BioLegend), and CD62L (MEL-14, BioLegend). The cells were stained for viability with LIVE/DEAD™ Fixable Aqua (Molecular Probes) for 10 minutes on ice and unspecific binding was prevented using anti-CD16/32 antibody for 5 minutes on ice followed by extracellular antibody staining for 30 minutes on ice. The samples were analyzed on a Gallios flow cytometer (Beckman Coulter) and data were analyzed using FlowJo (Tree Star). The gating strategy for myeloid and lymphoid cell populations is shown in Figure 7A–B and 7D.
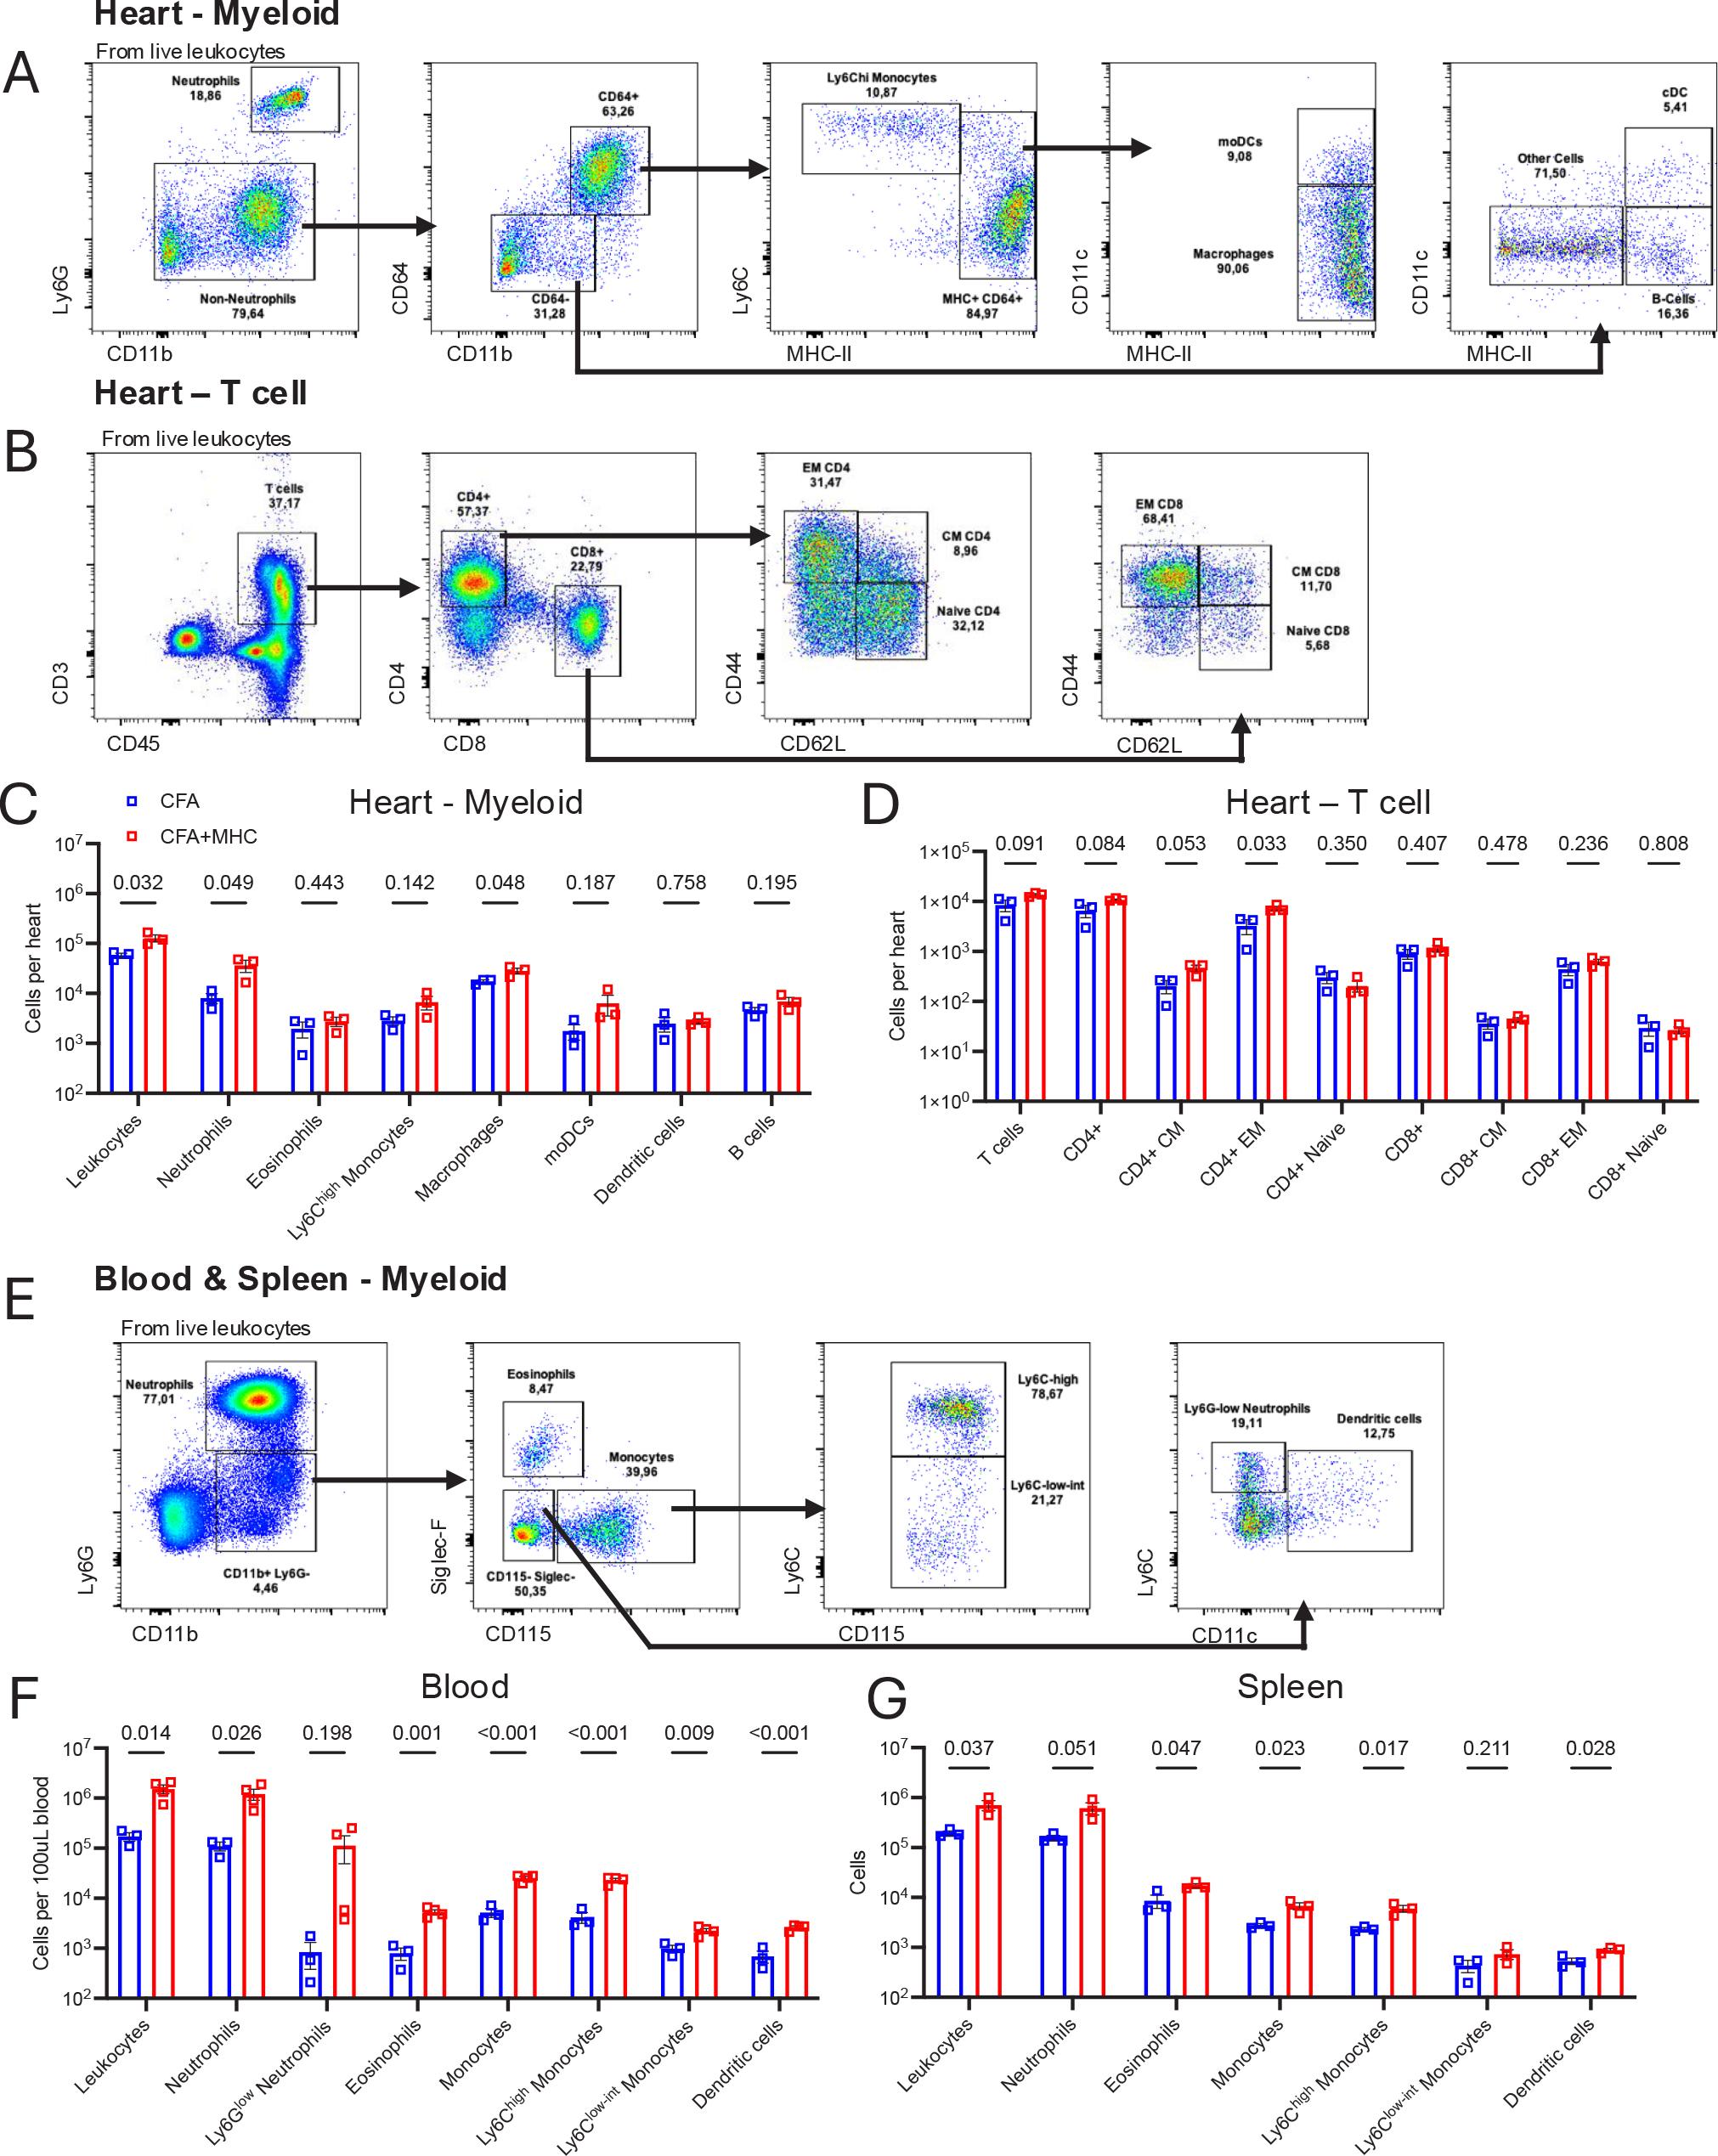
Flow cytometry assessment of immune cell populations in mice with autoimmune myocarditis. (A-B) Gating strategy for myeloid cells and T cells in the heart. (C – D) Quantification of immune cell populations in the heart. (E) Gating strategy for myeloid cells in blood and spleen. (F-G) Quantification of myeloid immune cell populations in heart and spleen. CFA, Complete Freund’s Adjuvant (Control); CFA+MHC, Complete Freund’s Adjuvant + Myosin heavy chain peptide (EAM group), CM; central memory, EM; effector memory, moDCs; monocyte-derived dendritic cells. Statistical testing was performed with Student’s t-test. Data is represented as mean ± S.D. N=3-4 per group.
The hearts of EAM mice contained higher numbers of total CD45+ leukocytes and of the pathogenic myeloid cell populations neutrophils and macrophages compared to CFA controls (Figure 7C). Ly6Chigh monocytes, monocyte derived dendritic cells (moDCs), and B cells showed a non-significant trend for higher numbers in EAM mice. Eosinophils and dendritic cell numbers in the hearts of EAM mice were not altered compared to CFA controls. T cell composition was also evaluated, as EAM is a T-cell-driven disease where CD4+ T cells are the most pathogenic cell subset. EAM mice showed higher levels of total T cells and total CD4+ cells, as well as central memory (CD4+ CM) and effector memory (CD4+ EM) CD4+ T cells compared to CFA mice (Figure 7D). No changes were seen in CD8+ T cells subsets in EAM hearts compared to CFA hearts.
The blood of EAM mice had more total leukocytes, neutrophils, eosinophils, and a trend towards higher Ly6Glow immature neutrophil numbers compared to CFA mice (Fig 7F). Likewise, total monocytes and both Ly6Chigh and Ly6Clow subtypes were more abundant in EAM mice compared to CFA, and dendritic cells were more numerous. Similar increases in total leukocytes, neutrophils, eosinophils, monocytes, and dendritic cells were observed in EAM spleens compared to CFA, although Ly6Glow neutrophils were not observed in the spleen (Figure 7G).
On Day 21 after the first immunization, we demonstrate immune cell infiltration in the heart by histology, increased myeloid and lymphoid cell populations in the heart, blood, and spleen, decreased cardiac function and myocardial fibrosis development in mice with induced EAM compared to non-immunized mice and with the appropriate controls immunized with CFA alone. These findings confirm the induction of EAM by cardiac antigen-specific immunization using the protocol described herein.
EAM is a widely used model of myocarditis. The model allows investigators to examine the processes involved in autoimmune inflammatory heart disease and the events responsible for fibrosis, remodeling, and heart failure. The commercial availability of a peptide derived from the cardiac α-myosin heavy chain allows for the convenient use of this model without the laborious preparation of cardiac myosin. Susceptible strains are white, A/J, and BALB/c, and induction of the EAM model depends on the careful preparation of the activated, autoantigen-loaded emulsion as described above.
The model allows researchers to examine the autoimmune form of heart disease without concern for viral interference and clearance. Another advantage of EAM is the reduced requirement for equipment, laboratory space, and trained personnel, as working with live CB3 virus is strictly regulated.
In this model, the peak of the immune and inflammatory activation occurs around Day 21. The myocardial damage begins around Day 14, leading to progressive loss of cardiac function. The maximum loss of cardiac function, as assessed by echocardiography, is observed around Day 35-42. Consequently, the mice should be sacrificed on Day 21 for the study of immune cell infiltration and immune activation, and on Day 35-42 for functional read-outs and myocardial fibrosis. The most important functional read-outs by echocardiography are cardiac output, and left, as a measurement of cardiac dilation and remodeling.
This model of autoimmune myocarditis serves as a valuable tool for identifying new therapeutic targets and testing new treatments to reduce the inflammation, fibrosis, and functional consequences on the myocardium associated with the disease. Despite identical immunization at baseline, there is a high variability in the severity of the disease that develops during the course of the experiment. This variability has to be taken into consideration when designing experiments. In order to achieve enough statistical power to detect treatment effects, we recommend including 10-15 mice per group. In the example experiment included in the current paper, echocardiography was performed early during disease development and showed only a mild decrease of left ventricular EF and no effects on left ventricular volumes. These effects progress with time and become more evident by Day 35-42. After Day 42, the immune disease pathogenesis is usually quenched by immunoregulatory mechanisms and progression is stopped. A third immunization, around Day 21-35, might be attempted to extend the pathogenic period if more severe disease models are required by the experiment.