
The Biomime (Meril Life Sciences, India) is an ultra-thin (65 μm) cobalt-chromium stent with a hybrid design offering open-cell mid-section for flexibility and closed-cell ends for stability. It elutes sirolimus (1.25 μg/mm2), an antiproliferative drug, over 30-40 days post-implantation. [1, 2]
Ultra-thin (< 70 μm) DES have been shown to improve outcomes compared with second-generation DES due to better deliverability; reduced vessel injury; decreased inflammation and side-branch flow disturbance; and faster endothelialization [2]. They also reduce the risk of in-stent restenosis, thereby decreasing the risk of angiographic and clinical restenosis [2].
The Ultimaster SES (Terumo, Japan) uses the Kaname platform with an abluminal bioresorbable polymer (PDLLA-PCL) coating, delivering sirolimus (3.9 μg/mm) with complete polymer degradation in four months. [3, 4]
Our study aimed to examine the safety and effectiveness of the Biomime sirolimus-eluting stent (SES) versus a thicker-strut Ultimaster SES in cases presenting with ST-elevation myocardial infarction (STEMI) who were subjected to primary PCI (PPCI).
This was a prospective, single-center, randomized, open-label, active-controlled non-inferiority trial conducted at Assiut University Hospital. From October 1, 2020, to September 30, 2022, 370 STEMI patients who were subjected to PPCI were included in the study and followed up on for one year.
Inclusion criteria included cases suffering from STEMI that had been diagnosed according to current guidelines. [5, 6]
This study was executed in compliance with the ethical standards of the institutional and/or national research committee (IRB no: 04-2024-100305) and the guidelines of the 1964 Helsinki Declaration, along with its later amendments or similar ethical standards. All study participants granted their informed consent.
Exclusion criteria included left ventricular ejection fraction (LVEF) of less than 30%; Killip class > I at presentation; extreme vessel tortuosity (≥ 2 consecutive curves of exceeding 180° in one of the major coronary arteries) [6]; lesion angulation exceeding 45°; severe calcification [7, 8]; bifurcation lesions with side-branch diameter exceeding 2 mm; mechanical complications of STEMI; or severe comorbidities, such as end-stage renal disease or malignancy.
Clinical follow-up was conducted at 30 days and one-year post-procedure. Electrocardiograms (ECGs) were obtained before and immediately after re-perfusion, 90 minutes post-flow restoration, and as needed. Echocardiography was performed at discharge and after one year to evaluate LVEF, wall motion score index (WMSI), and degree of mitral regurgitation. Angiographic follow-up was scheduled at one year to assess late lumen loss (LLL), binary restenosis, and minimal lumen diameter (MLD).
Dual antiplatelet treatment (DAPT) composed of aspirin (at a dosage of 75–150 mg daily) and clopidogrel (75 mg daily) or ticagrelor (180 mg/daily) prescribed for one year or longer. Beyond one year, aspirin was recommended indefinitely.
The primary clinical endpoint was target vessel failure (TVF), which is determined by cardiac death (target vessel cannot be excluded); target vessel myocardial infarction (MI); or clinically induced target vessel revascularization (CD-TVR). [2, 9]
Secondary clinical endpoints included Major Adverse Cardiac events (MACE), including myocardial cardiac death, myocardial infarction, and CD-TVR.
Cardiac death was outlined as death due to myocardial infarction, arrhythmia, cardiac failure,
cardiac arrest, procedural complications, or unknown causes. [2] Major bleeding and stent thrombosis (ST) were also secondary clinical endpoints, as established by the Academic Research Consortium (ARC) criteria. [9]
In stent, LLL was the primary endpoint. In-stent and in-segment stenosis, MLD, and restenosis rate (> 50% diameter stenosis) [2] were the secondary angiographic endpoints.
QCA was performed at baseline, following the procedure, in conjunction with the one-year follow-up. It was analyzed using independent core laboratory using automated edge detection. Paired QCA was performed for each target lesion within the stent and nearby segments, including 5-mm margins proximally and distally from the stent. [10]
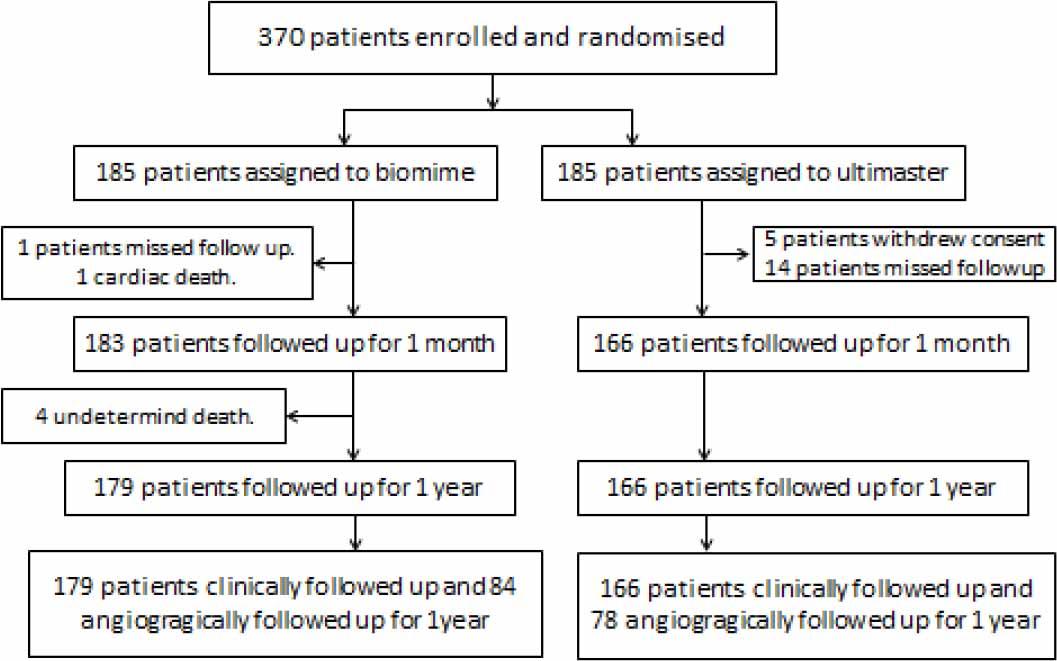
Patient enrollment and disposition.
Sample size calculation was performed via G*Power 3 software. To identify an effect size of 0.5 (expected TVF rates of 7.2% in the Biomime group vs. 3.5% in the Ultimaster group), a minimum of 146 patients (1:1 randomization) was needed, with a non-inferiority margin of 5%, α = 0.01, and 95% power. LLL was expected to be 0.2 ± 0.5 mm for Biomime vs. 0.41 ± 0.5 mm for Ultimaster, requiring 140 patients (70 patients in each group) for angiographic endpoints, with an additional 20% allowance for drop-out.
Statistical analyses were carried out using R software. Continuous variables were compared via a Student’s t-test or Mann-Whitney U test (if not normally distributed). Categorical-variable analysis was carried out via the chi-square test. TVF and MACE-free survival analysis were assessed via the Kaplan-Meier method. A p-value < 0.05 was regarded as statistically significant.
A total of 380 STEMI patients were included and randomly assigned (1:1) to Biomime SES or Ultimaster SES.
No significant difference was noticed between the groups regarding baseline clinical characteristics, ECG findings, the percentage of troponin elevation, the incidence of in-hospital arrhythmias, or echocardiographic parameters, other than a higher WMSI in the Ultimaster group. Moderate mitral regurgitation (grade II/IV) was observed more frequently in the Biomime group (11%) than in the Ultimaster group (4%), resulting in significant differences (P = 0.039). The use of P2Y12 inhibitors was comparable between the two groups.
Proximal lesion location, baseline TIMI flow, and final TIMI flow rates were the same in both groups. Pre-dilatation was performed significantly more often in the Ultimaster group (78%) than in the Biomime group (66%), with a statistically significant difference (P = 0.016). No differences were documented between the groups post-dilatation in maximum inflation pressure or overall stent diameter. However, stent sizes ≤ 2.75 mm were more commonly used in the Ultimaster group than the Biomime one (P < 0.001), and longer stents tended to be used in the Biomime group than in the Ultimaster group (P < 0.001).
Baseline characteristics, ECG, ECHO, and laboratory findings in Biomime and Ultimaster groups
| Biomime (N=183) | Ultimaster (N=166) | P | ||
|---|---|---|---|---|
| Age (years) | 57±11 | 56±11 | 0.390 | |
| Sex | Male | 137(74.9%) | 130 (78.3%) | 0.448 |
| DM | 53 (29.0%) | 60 (36.1%) | 0.152 | |
| HTN | 49 (26.8%) | 55 (33.1%) | 0.195 | |
| Smoking | 101(55.2%) | 86 (51.8%) | 0.527 | |
| Dyslipidemia | 131(71.6%) | 115 (69.3%) | 0.637 | |
| Total ischemic time (hours) | 5.6±3.8 | 5.4±3.1 | 0.600 | |
| Door to balloon (min) | 36±12 | 38±11 | 0.233 | |
| P2Y12 inhibitors | Ticalgrelor | 170 (92.9%) | 161(97.0%) | 0.084 |
| Clopidogrel | 137 (7.1%) | 5 (3.0%) | ||
| GPIIbIIIa inhibitors | 49 (26.8%) | 36 (21.7%) | 0.269 | |
| Site of infarction | Anterior | 95 (51.9%) | 97 (58.4%) | 0.295 |
| Inferior | 60 (32.8%) | 42 (25.3%) | ||
| Inferoright | 14 (7.7%) | 7 (4.2%) | ||
| Inferolateral | 2 (1.1%) | 5 (3.0%) | ||
| Infero-posterior | 8 (4.4%) | 8 (4.8%) | ||
| Posterior | 2 (1.1%) | 2 (1.2%) | ||
| Lateral | 2 (1.1%) | 5 (3.0%) | ||
| ST resolution | 132 (72.1%) | 121 (72.9%) | 0.874 | |
| In-hospital arrhythmias | VT | 1 (0.5%) | 2 (1.2%) | 0.338 |
| VF | 4 (2.2%) | 1 (0.6%) | ||
| AF | 5 (2.7%) | 3 (1.8%) | ||
| Junctional | 1 (0.5%) | 0 (0.0%) | ||
| CHB | 5 (2.7%) | 1 (0.6%) | ||
| None | 167 (91.3%) | 159 (95.8%) | ||
| LVEF | 50±8 | 49±8 | 0.276 | |
| WMSI | 1.42 ±0.2 | 1.47±0.2 | 0.051 | |
| MR | 0 | 124 (67.8%) | 112 (67.5%) | 0.039* |
| I | 38 (20.8%) | 44 (26.5%) | ||
| II | 20 (10.9%) | 6 (3.7%) | ||
| III | 0 (0.0%) | 2 (1.2%) | ||
| IV | 1 (0.5%) | 2 (1.2%) | ||
| Troponin (ng/dl) | 22±22 | 20±19 | 0.450 | |
Data are presented as mean ± SD or frequency (%).
Significant P value < 0.05. DM: diabetes mellitus, HTN: hypertension, GPIIbIIIa: glycoprotein IIbIIIa inhibitors, AF: atrial fibrillation; CHB: complete heart block; LVEF: left ventricular ejection fraction; MR: mitral regurgitation; SD: standard deviation; VF: ventricular fibrillation; VT: ventricular tachycardia; WMSI: wall motion score index.
Baseline pre-stenting measurements, including MLD, percentage diameter stenosis (% DS), and reference vessel diameter (RVD), were the same between both groups. Post-procedure QCA revealed comparable acute luminal gain following stent implantation in both groups. The one-year follow-up showed a non-significant difference in in-stent LLL between the Biomime and Ultimaster groups (0.34 ± 0.4 mm vs. 0.36 ± 0.4 mm, difference [95% CI]: -0.02 [-0.14 to 0.10], P = 0.756, and PNI [P for non-inferiority] < 0.001) as shown in Figure 2’s central illustration. Similarly, the restenosis rate showed nonsignificant differences between both groups, with 14 cases (16.7%) in the Biomime group and 11 cases (14.3%) in the Ultimaster group (RR [95% CI]: 1.154 [0.529 – 2.47], P = 0.677, and PNI = 0.001). These findings support the non-inferiority of the Biomime stent compared to the Ultimaster stent.
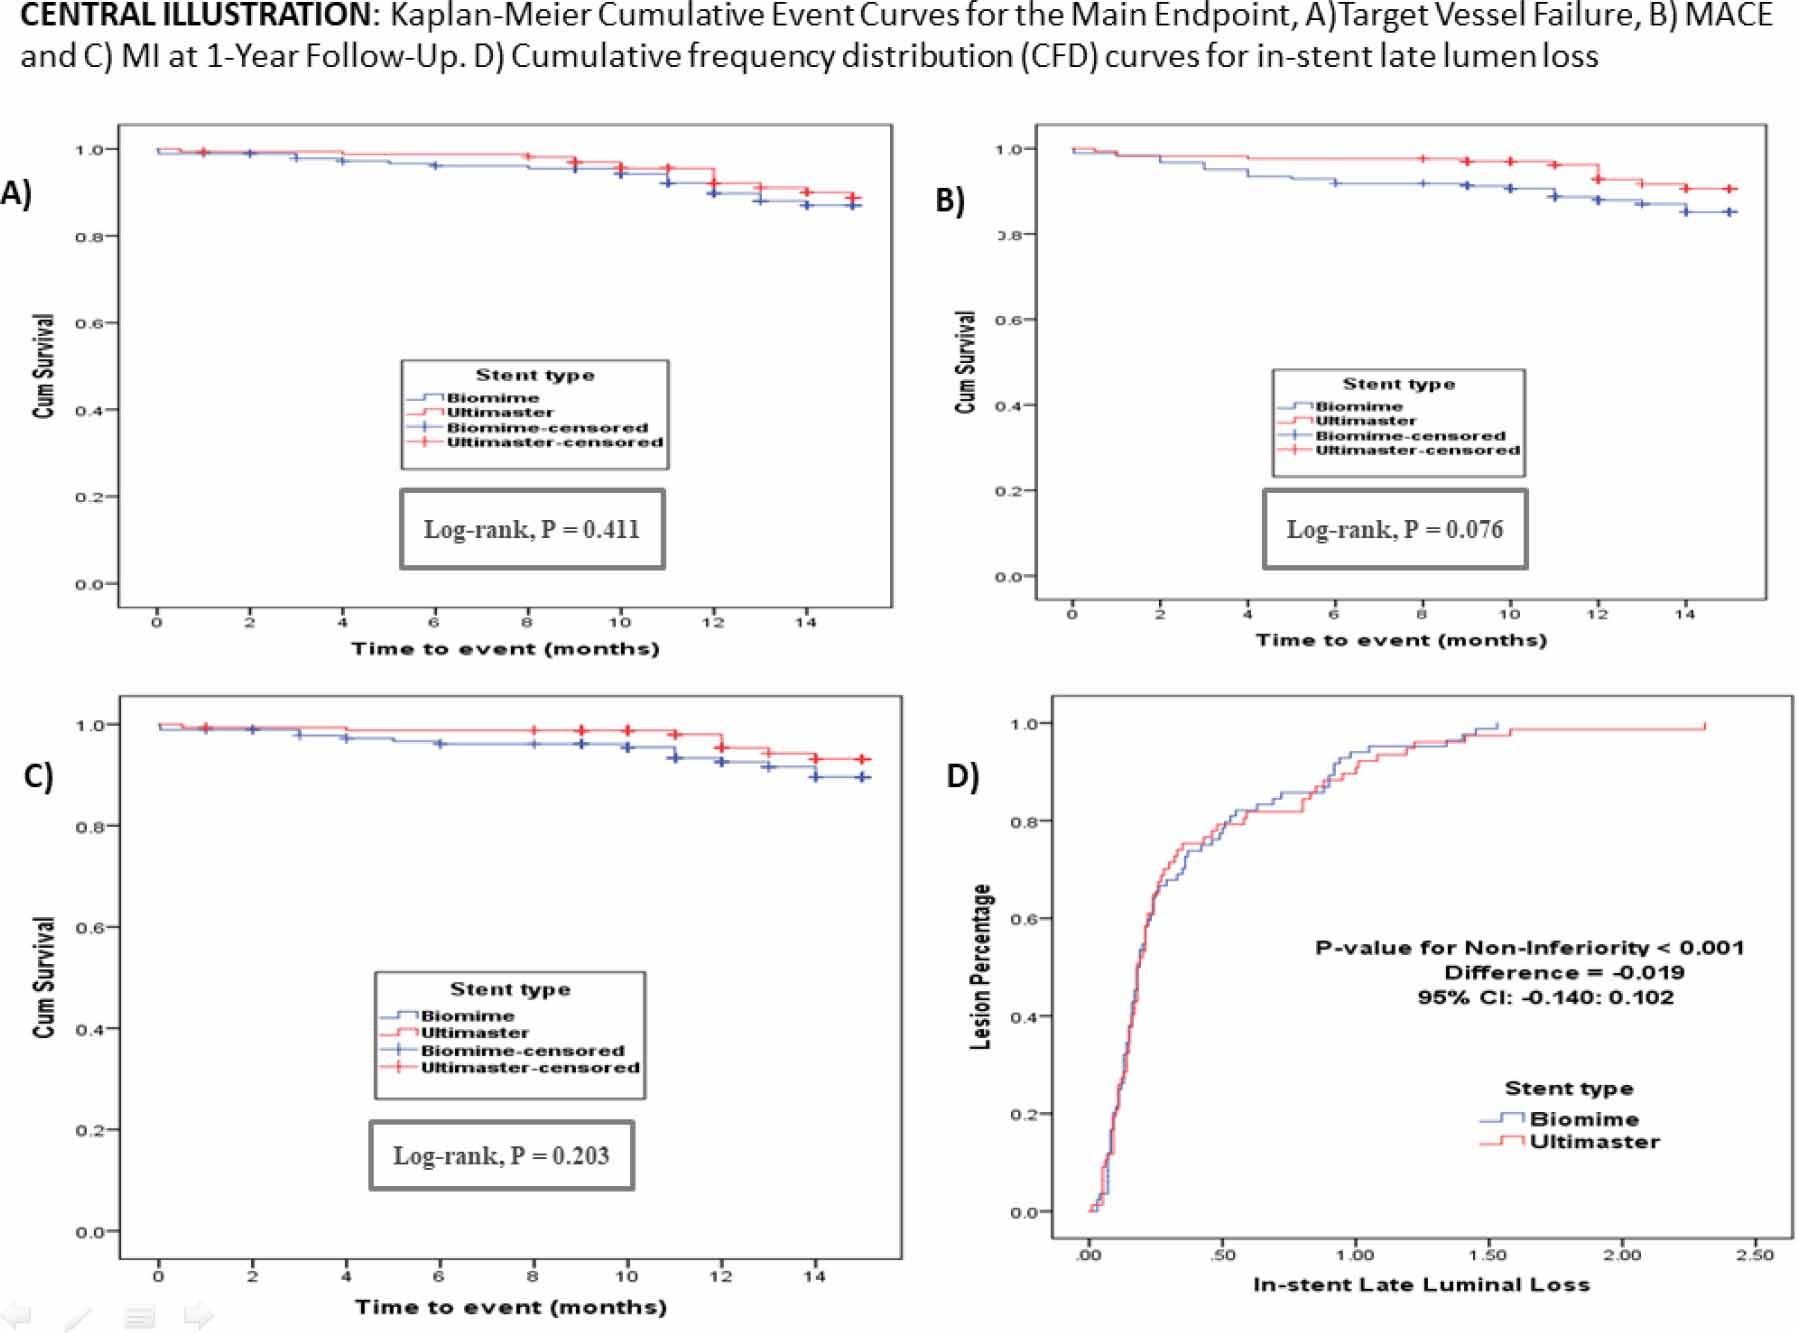
Central illustration: Kaplan-Meier cumulative event curves for the main endpoint. A) Target Vessel Failure, B) MACE, and C) MI at one-year follow-up. D) Cumulative frequency distribution (CFD) curves for in-stent late lumen loss. MACE: major adverse cardiac events, MI: myocardial infarction.
Baseline lesion and procedural characteristics of Biomime and Ultimaster groups
| Biomime (N=183) | Ultimaster (N=166) | P | ||
|---|---|---|---|---|
| Number of diseased vessels | One | 122 (67.0%) | 99 (59.0%) | 0.208 |
| Two | 36 (20.0%) | 46 (28.0%) | ||
| Three | 25 (13.0%) | 21 (13.0%) | ||
| Infarcted related artery | LAD | 93 (50.8%) | 99 (59.6%) | 0.155 |
| LCx | 13 (7.1%) | 19 (11.4%) | ||
| RCA | 68 (37.2%) | 39 (23.5%) | ||
| Diagonal | 1 (0.5%) | 2 (1.2%) | ||
| OM | 4 (2.2%) | 2 (1.2%) | ||
| PDA | 2 (1.1%) | 3 (1.8%) | ||
| Ramus | 2 (1.1%) | 2 (1.2%) | ||
| Site of occlusion | Proximal | 118 (64.5%) | 106 (63.9%) | 0.650 |
| Mid | 56 (30.6%) | 48 (28.9%) | ||
| Distal | 9 (4.9%) | 12 (7.2%) | ||
| Baseline TIMI flow | 0 | 161 (88.0%) | 128 (77.1%) | 0.062 |
| I | 14 (7.7%) | 24 (14.5%) | ||
| II | 4 (2.2%) | 6 (3.6%) | ||
| III | 4 (2.2%) | 8 (4.8%) | ||
| Post procedure TIMI flow | 0 | 1 (0.5%) | 0 (0.0%) | 0.136 |
| I | 5 (2.7%) | 0 (0.0%) | ||
| II | 13 (7.1%) | 12 (7.2%) | ||
| III | 164(89.6%) | 154(92.8%) | ||
| Pre-dilatation | 121 (66.1%) | 129 (77.7%) | 0.016* | |
| Post-dilatation | 36 (19.7%) | 27 (16.3%) | 0.409 | |
| Stent length (mm) | 31.7±7.7 | 28.5±6.9 | <0.001* | |
| Stent diameter (mm) | 3.3±0.4 | 3.2±0.5 | 0.203 | |
| Stent diameter (mm) | 2.25 | 1 (1.0%) | 1 (1.0%) | <0.001* |
| 2.5 | 2 (1.0%) | 10 (6.0%) | ||
| 2.75 | 16 (9.0%) | 37 (22.0%) | ||
| 3.00 | 79 (42.0%) | 45 (27.0%) | ||
| 3.5 | 69 (38.0%) | 52 (31.0%) | ||
| 4.00 | 16 (9.0%) | 21 (13.0%) | ||
| Max. inflation (atm) | 15.2±2.5 | 14.9±2.4 | 0.281 | |
Data are presented as mean ± SD or frequency (%). LAD: left anterior descending; LCx: left circumflex; RCA: right coronary artery; OM: obtuse marginal; PDA: posterior descending artery; TIMI: thrombolysis in myocardial infarction.
At one year, the Biomime stent proved its non-inferiority to the Ultimaster stent with regard to TVF and MACE. The TVF rate showed non-significant increases in the Biomime group (20 patients, 10.9%) compared to the Ultimaster group (14 patients, 8.4%) (RR [95% CI]: 1.296 [0.677–2.482], P = 0.432, and PNI = 0.059). Similarly, MACE appeared in 30 cases (16.39%) in the Biomime group, compared to 18 cases (10.48%) in the Ultimaster group (RR [95% CI]: 1.512 [0.877–2.61], P = 0.133, and PNI < 0.001).
Procedural quantitative measures at baseline, immediately post procedure, and at follow up in Biomime and Ultimaster groups.
| Biomime (n=183) | Ultimaster (n=166) | Diff and (95%CI) | P | ||
|---|---|---|---|---|---|
| Baseline | RVD | 2.79±0.4 | 2.76±0.5 | 0.03 (-0.05–0.05) | 0.599 |
| MLD | 0.79±0.23 | 0.76±0.26 | 0.03 (-0.02–0.09) | 0.186 | |
| DS | 71.03±8.2 | 72.33±8.6 | -1.3 (-3.07–0.48) | 0.151 | |
| Immediately post procedure | |||||
| RVD | 3.21±0.4 | 3.14±0.46 | 0.06 (-0.03–0.15) | 0.166 | |
| MLD | In-stent | 2.57±0.4 | 2.55±0.5 | 0.02 (-0.07–0.12) | 0.653 |
| In-segment | 2.32±0.4 | 2.33±0.5 | -0.01 (-0.11–0.08) | 0.817 | |
| DS | In-stent | 19.77±7.7 | 19.10±9.6 | 0.67 (-1.15–2.49) | 0.470 |
| In-segment | 27.80±7.9 | 26.21±9.9 | 1.59 (-0.29–3.47) | 0.096 | |
| Acute gain | In-stent | 1.78±0.4 | 1.79±0.5 | -0.01 (-0.1–0.08) | 0.796 |
| In-segment | 1.52±0.4 | 1.57±0.5 | -0.05 (-0.14–0.05) | 0.346 | |
| N = 84 | N = 78 | ||||
| Follow-Up | |||||
| RVD | 3.04±0.4 | 3.05±0.4 | -0.01(-0.13–0.12) | 0.940 | |
| MLD | In-stent | 2.24±0.6 | 2.28±0.7 | -0.04 (-0.24–0.16) | 0.685 |
| In-segment | 2.02±0.6 | 2.08±0.6 | -0.06 (-0.25–0.14) | 0.549 | |
| DS | In-stent | 27.5±4.6 | 25.7±16.6 | 1.76 (-3.09–6.36) | 0.473 |
| In-segment | 34.8±14.9 | 32.1±15.9 | 2.77 (-2.13–7.48) | 0.273 | |
| LLL | In-stent | 0.34±0.4 | 0.36±0.4 | -0.02 (-0.14–0.10) | 0.756 |
| In-segment | 0.31±0.4 | 0.35±0.4 | 0.01 (-0.14–0.10) | 0.876 | |
| Re-stenosis | 14 (16.7%) | 11 (14.3%) | 1.154 (0.529–2.47) | 0.677 | |
Data are presented as mean ± SD. CI: confidence interval; RVD: reference vessel diameter; MLD: minimal lumen diameter; DS: diameter stenosis; LLL: late lumen loss.
Clinical endpoints at 30 days and at 12 months in Biomime and Ultimaster groups.
| Biomime (n =183) | Ultimaster (n =166) | P | |
|---|---|---|---|
| 30 days | |||
| All-cause death | 1 (0.5%) | 0 (0.0%) | 0.340 |
| All MI | 2 (1.1%) | 1 (0.6%) | 0.620 |
| Stroke | 0 (0.0%) | 1 (0.6%) | 0.293 |
| Major bleeding | 0 (0.0%) | 0 (0.0%) | ----- |
| Definite stent thrombosis | 2 (1.1%) | 1 (0.6%) | 0.620 |
| Composite (all-cause death, re-MI, stroke, major bleeding, definite ST) | 3 (1.6%) | 2 (1.2%) | 0.733 |
| One year | |||
| All cause death | 5 (2.7%) | 0 (0.0%) | 0.032 |
| Cardiac death | 1 (0.5%) | 0 (0.0%) | 0.340 |
| Undetermined death | 4 (2.2%) | 0 (0.0%) | 0.055 |
| Definite ST | 8 (4.4%) | 3 (1.8%) | 0.171 |
| MI not clearly attributable to a non-target vessel | 4 (2.2%) | 3 (1.8%) | 0.558 |
| Major bleeding | 0 (0.0%) | 1 (0.6%) | 0.293 |
| Heart failure | 4 (2.2%) | 1 (0.6%) | 0.214 |
| CD-TLR | 9 (4.9%) | 9 (5.4%) | 0.832 |
| C-TVR (including CD-TLR) | 9 (4.9%) | 9 (5.4%) | 0.832 |
| Total MACE | 30 (16.39%) | 18 (10.48%) | 0.133 |
| Target Vessel failure | 20 (10.9%) | 14 (8.4%) | 0.432 |
Data are presented as mean ± SD or frequency (%). MI: myocardial infarction; ST: stent thrombosis; CD-TLR: clinically driven-target lesion revascularization; CD-TVR: clinically driven-target vessel revascularization; MACE: major adverse cardiac events.
Both the Biomime and the Ultimaster group showed a slight, but not significant, increase in the incidence of ST at one year. Due to the non-inferiority design of the study, however, results were inconclusive.
The Kaplan-Meier survival curves in Figure 2’s central illustration demonstrate comparable survival outcomes between the two stents. Subgroup analysis favored the use of Ultimaster in small-vessel interventions.
This study compared the novel ultra-thin Biomime SES to the thicker Ultimaster stent in STEMI patients subjected to PPCI. The Biomime sirolimus eluting stent (SES) demonstrated non-inferiority to Ultimaster SES at one year regarding TVF and MACE. Angiographic outcomes, including LLL and restenosis rate, were the same between the two groups. The cumulative rates of all-cause mortality, recurrent infarction, unplanned ischemia-related artery revascularization, stroke, definite stent thrombosis, and major bleeding at one year did not vary significantly between both groups, but numerical differences were observed, with an elevated rate of each in the Biomime group (except for major bleeding).

Subgroup interaction analysis of TVF at one-year follow up (vessel size, age > 70, sex, DM, post-dilatation, max inflation, stent length). DM: diabetes mellitus, LVEF: left ventricular ejection fraction, TVF: target vessel failure.
Our findings align with those of previous trials. For example, the BIOSCIENCE trial showed that STEMI patients receiving the Orsiro Ultra-Thin SES experienced a lower rate of target lesion failure (TLF) than those treated with the Xience EES (3.3% vs. 8.7%, p = 0.024 at 12 months) [11, 12]. In a subgroup assessment of the CENTURY II trial involving approximately 264 high-risk ACS patients, TVF at 24 months occurred in 6.3% of those medicated with Biodegradable Polymer SES (BP-SES), compared to 9.4% of patients treated with a Permanent Polymer Everolimus Eluting Stent (PP-EES). [11, 12]
In the present study, Biomime was non-inferior to Ultimaster with regards to TVF (10.9% versus 8.4%) (RR [95% CI]: 1.296 [0.677–2.482], P = 0.432, and PNI = 0.059).
Subgroup analysis suggested a potential advantage and supported the use of Ultimaster over the Biomime for TVF in small vessels (< 2.75 mm). In contrast, cases managed using the Orsiro Ultrathin Stent had a decreased rate of TLR in small-vessel disease than the other treatment groups, according to the BIORESORT trial [1, 13]. However, no differences were documented in the five-year rate of TLF between ultra-thin-strut and thin-strut DES in the subgroup analysis of the BIOSCIENCE trial. [1, 14]
In the meriT-V trial, although the Biomime group showed a decreased rate of MACE compared to the Xience Everolimus-Eluting Stent group (EESs) (2.98% vs. 7.14%; P = 0.13), but the difference was not statistically significant. [2]
In the current study, MACE rates were higher, but the difference was not of significance (16.39% for Biomime vs. 10.48% for Ultimaster; RR [95% CI]: 1.512 [0.877–2.61], P = 0.13, and PNI < 0.001). Similarly, the BIOSCIENCE trial comparing a biodegradable polymer SES (BP-SES) and DP-EES in PPCI patients found no significant differences in the composite endpoints. [15]
Regarding LLL, the present study demonstrated that Biomime SES (0.34 ± 0.4 mm) were non-inferior to Ultimaster SES (0.36 ± 0.4 mm) (difference [95% CI]: -0.02 [-0.14 – 0.10], P=0.756, and PNI < 0.001). These results are in keeping with findings from the meriT-V trial, which showed similar but numerically lower results. Instent LLL was 0.15 ± 0.27 mm in the Biomime SES group and 0.15 ± 0.29 in the XIENCE EES group (Diff: -0.006 mm; 95% CI: -0.085 to 0.072; p = 0.87; p-value for non-inferiority < 0.0001). [2] ORIENT and BIOFLOW-II trials demonstrated lower LLL values for Orsiro Ultrathin Strut DES compared to second-generation DES. [16, 17]
The definite ST rate in this study at 12 months was 4.4% for Biomime and 1.8% for Ultimaster stents (RR [95% CI]: 2.42 [0.653–8.96], P = 0.171). While this rate is higher numerically (but not to a statistically-significant degree) than the rate reported in some other trials, such as the MASTER and EXAMINATION trials [4, 18], a potential imbalance in lesion complexity and use of longer stents may have contributed to the higher rate of ST in the Biomime group.
Study limitations included the absence of intravascular imaging techniques such as intravascular ultrasound (IVUS) and optical coherence tomography (OCT) due to limited resources. The safety and efficacy of these stents in bifurcation lesions also remain untested in this STEMI population. Finally, non-standardized post-dilatation protocols may have influenced outcomes.
In STEMI cases undergoing PPCI, the Biomime SES showed non-inferiority to the Ultimaster SES regarding TVF and MACE at the one-year follow-up. LLL and restenosis rates were similar in both groups. Thus, Biomime stents offer a suitable option for STEMI patients undergoing PPCI. Longer-term follow-up will be essential to assess very late risks associated with Biomime stents.