
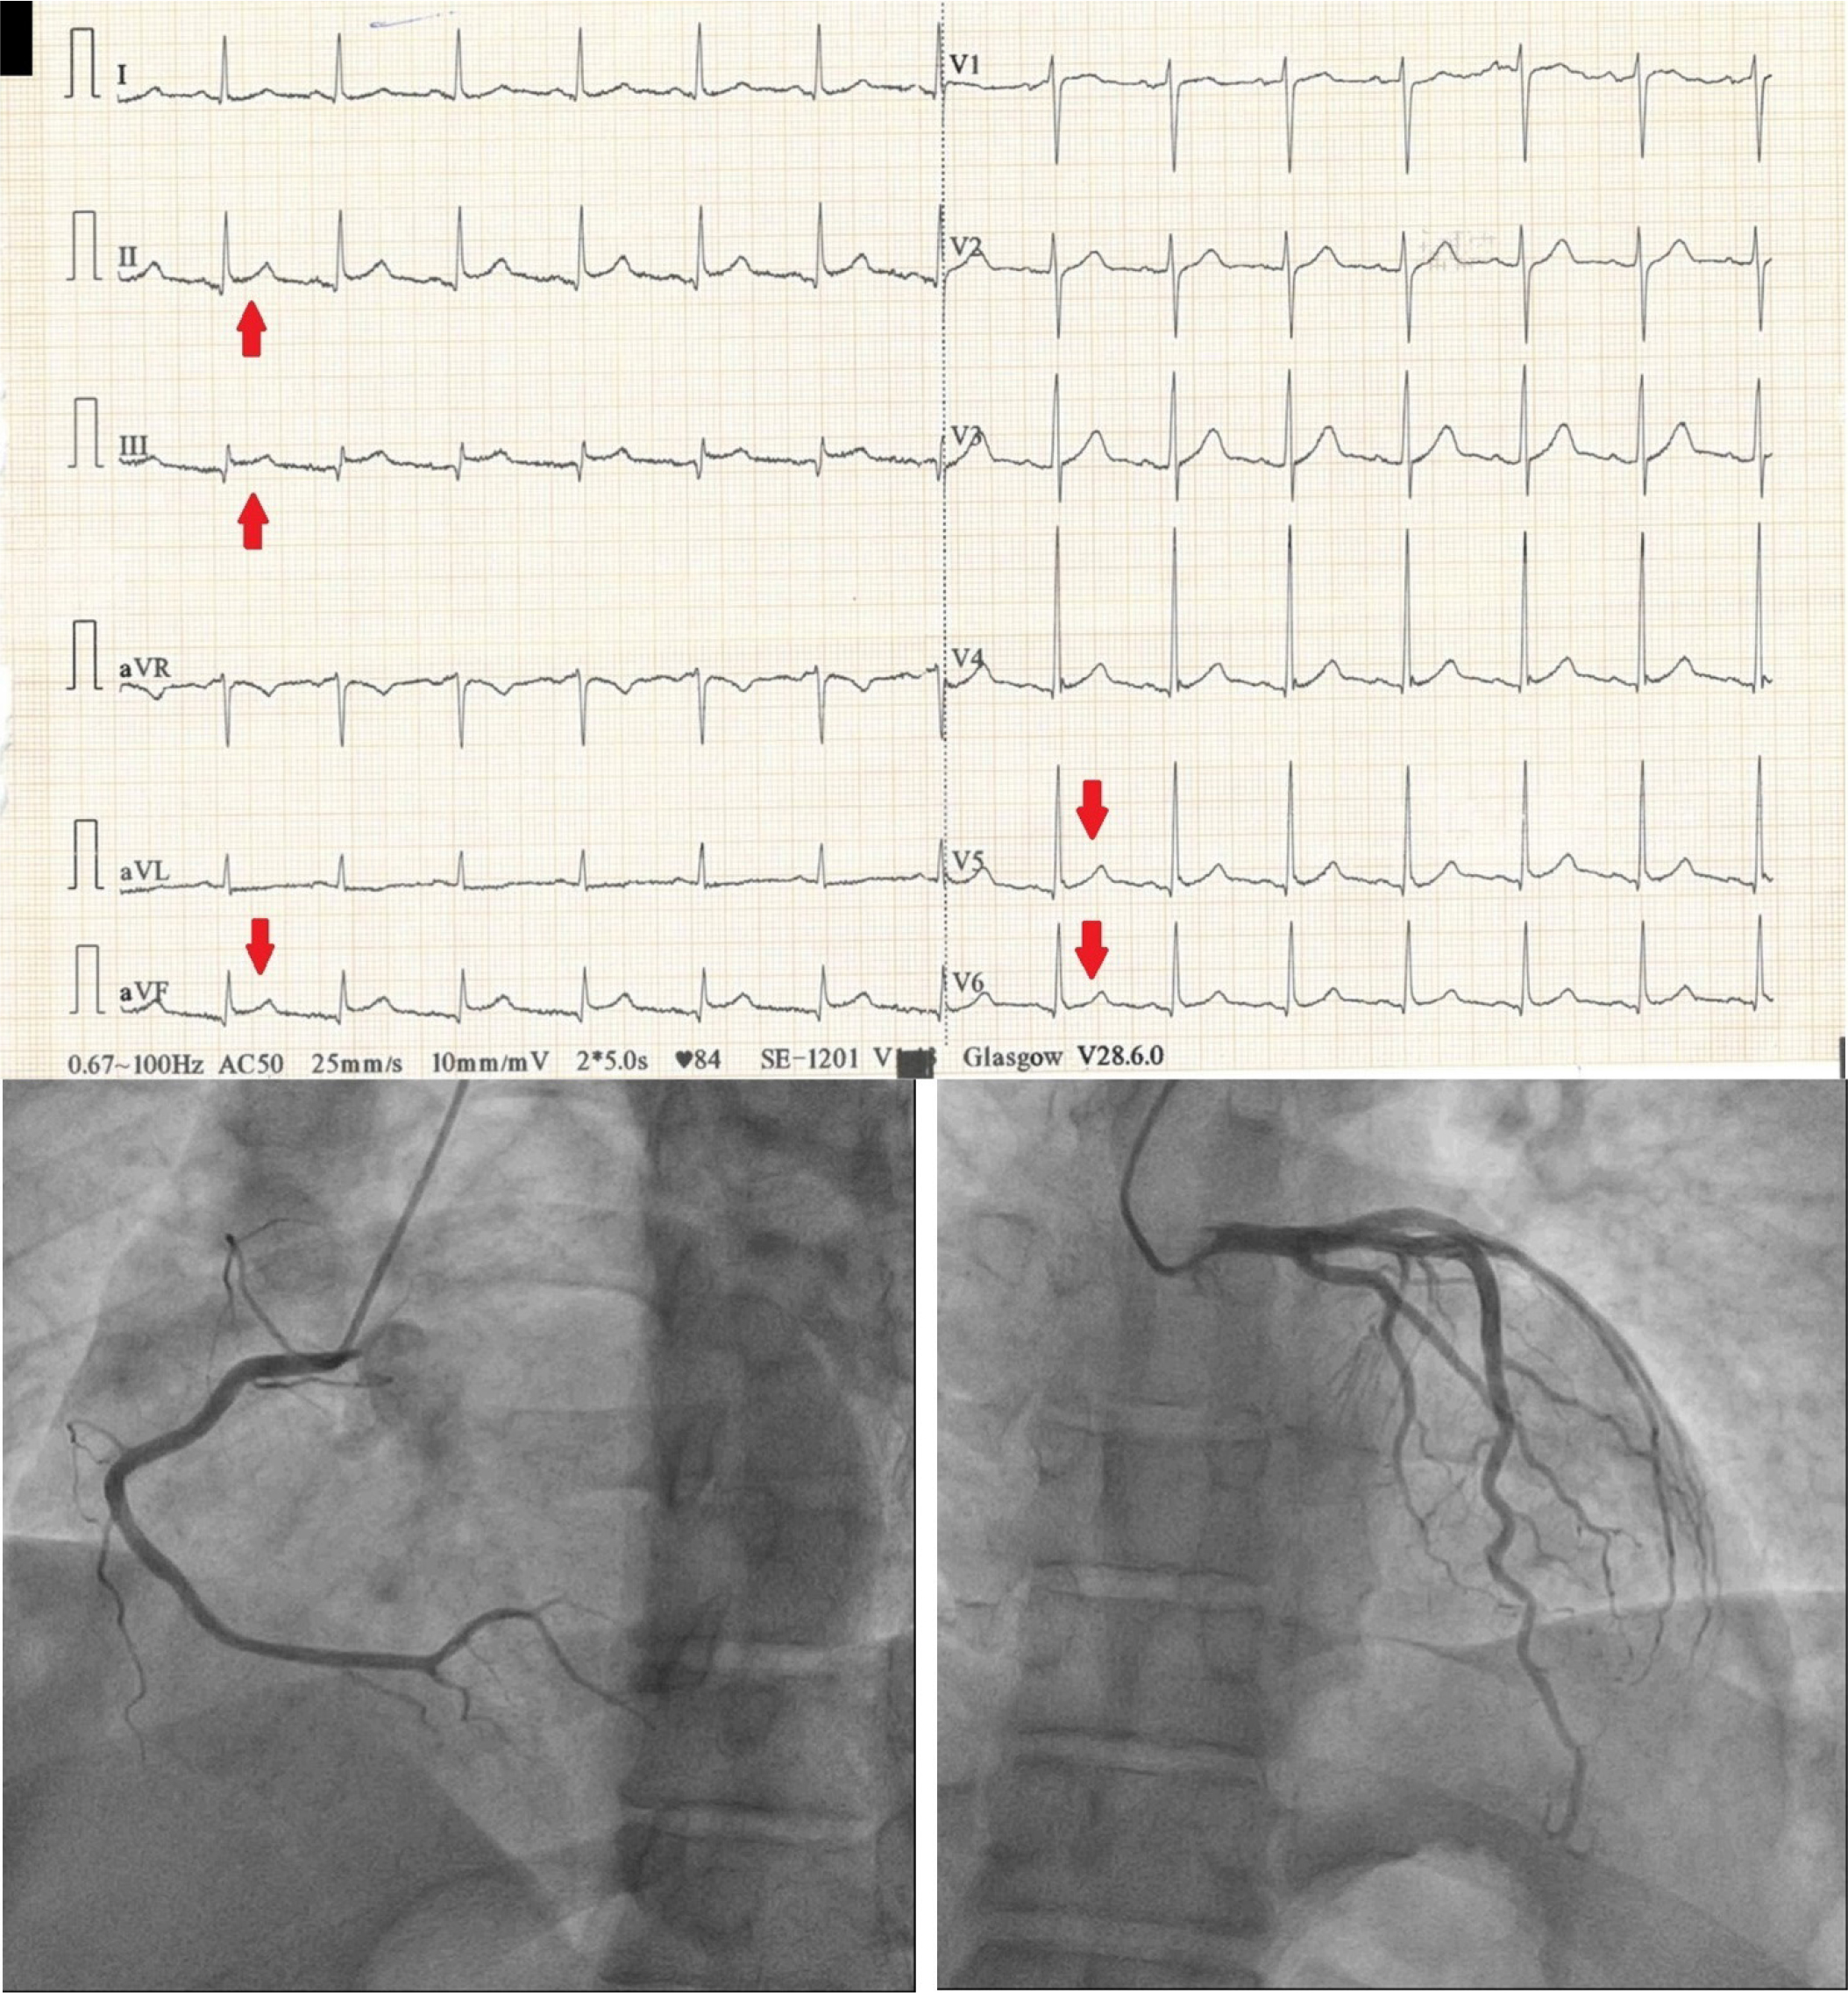
Figure 1
38- year old patient presenting to the E.R. with recent onset chest pain. ECG shows ST elevation in DII, DIII, aVF V5 and V6 (red arrows), suggesting a inferolateral STEMI. Patient undergoes coronary angiogram which reveals normal coronary arteries with no significant stenosis.
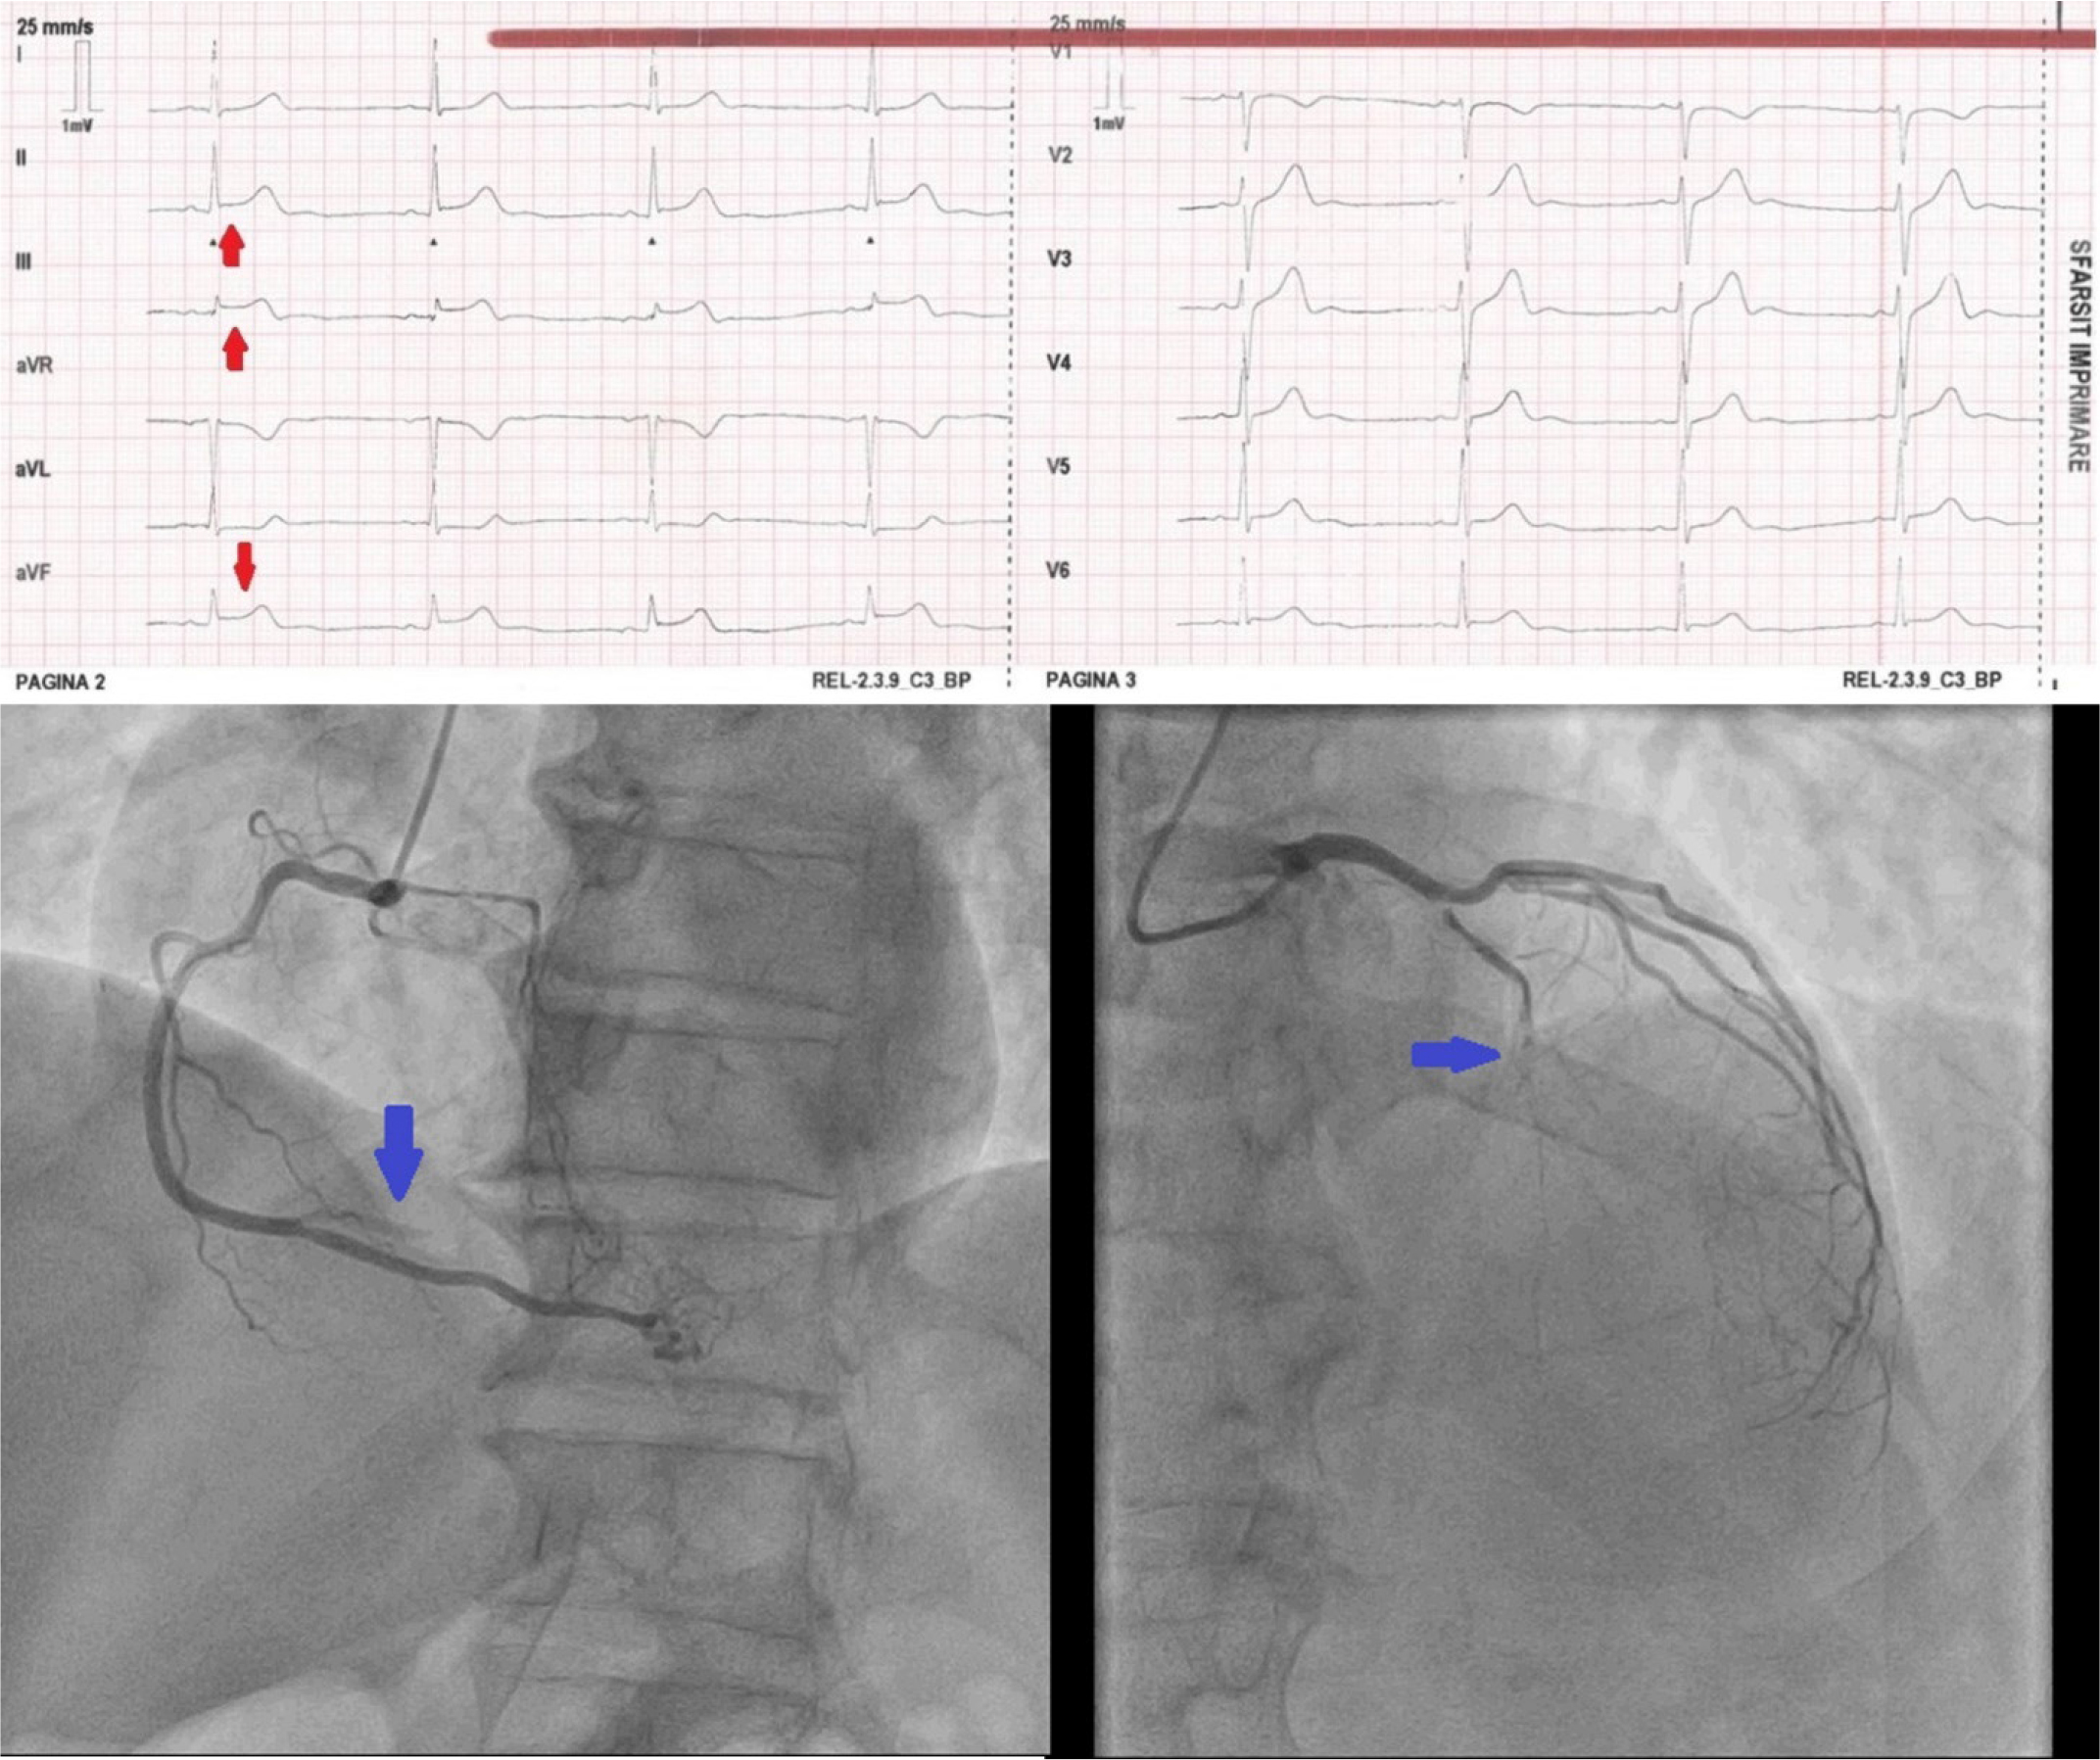
Figure 2
63-year old patient presenting with a day old chest pain. ECG shows ST elevation in inferior leads DII, DIII, aVF (red arrows) consistent with an inferior STEMI. Angiogram shows acute occlussion on the right coronary artery (blue arrow – left image) and chronic occlussion of the left anterior descending coronary artery (blue arrow – right image).
Table 1
Biomarkers in MINOCA.
| Biomarkers | Mechanisms | Changes in MINOCA | Effect on prognosis |
|---|---|---|---|
| C-reactive protein (CRP) 5 6, 73 | Vascular and myocardial inflammation | In MINOCA vs. MI-CAD | Elevated risk of mortality and MACE |
| Tumor necrosis factor α (TNF-α) 53 |
| In MINOCA vs MI-CAD | Unknown |
| Interleukin-6 (IL-6) 21, 54 |
| In CMVD | Elevated risk of recurrent myocardial infarction |
| Interleukin-1 (IL-1) 55, 56 |
| In MINOCA | Unknown |
| Visfatin 58 |
| In MINOCA | Unknown |
| Placental growth factor (PIGF) 58 |
| In MINOCA | Unknown |
| Fractalkine 58 |
| In MINOCA | Unknown |
| Fibrinogen-on-albumin ratio (FAR) 74 |
| - | Higher risk of MACE and hospitalization for heart failure |
| sVCAM-1 55 |
| In MINOCA vs MI-CAD | Progression of atherosclerosis |
| Soluble urokinase-type plasminogen activator receptor (suPAR) 80 |
| In MINOCA vs. healthy control | Increase in MACE and all-cause deaths. |
| Uric acid 79 |
| - | Higher risk of MACE and heart failure |
| Lipoprotein(a) 69, 70 |
| In MINOCA vs MI-CAD | Increase in MACE |
| Ratio of neutrophils, monocytes, lymphocytes, platelet to HDL (NHR, MHR, LHR, PHR) 75 |
| Increase in MACE | |
| Systemic inflammation response index (SIRI) 76 | - | - | Higher rates of MACE |
| Neutrophil-to-lymphocyte ratio (NLR) 77 |
| In MINOCA | Increased risk of all-cause mortality |
| White blood cell count to mean platelet count ratio (WMR) 78 |
| - | Higher rates of MACE |
| Neutrophil-to-platelet ratio 78 |
| - | Higher rates of MACE |