Figure 1
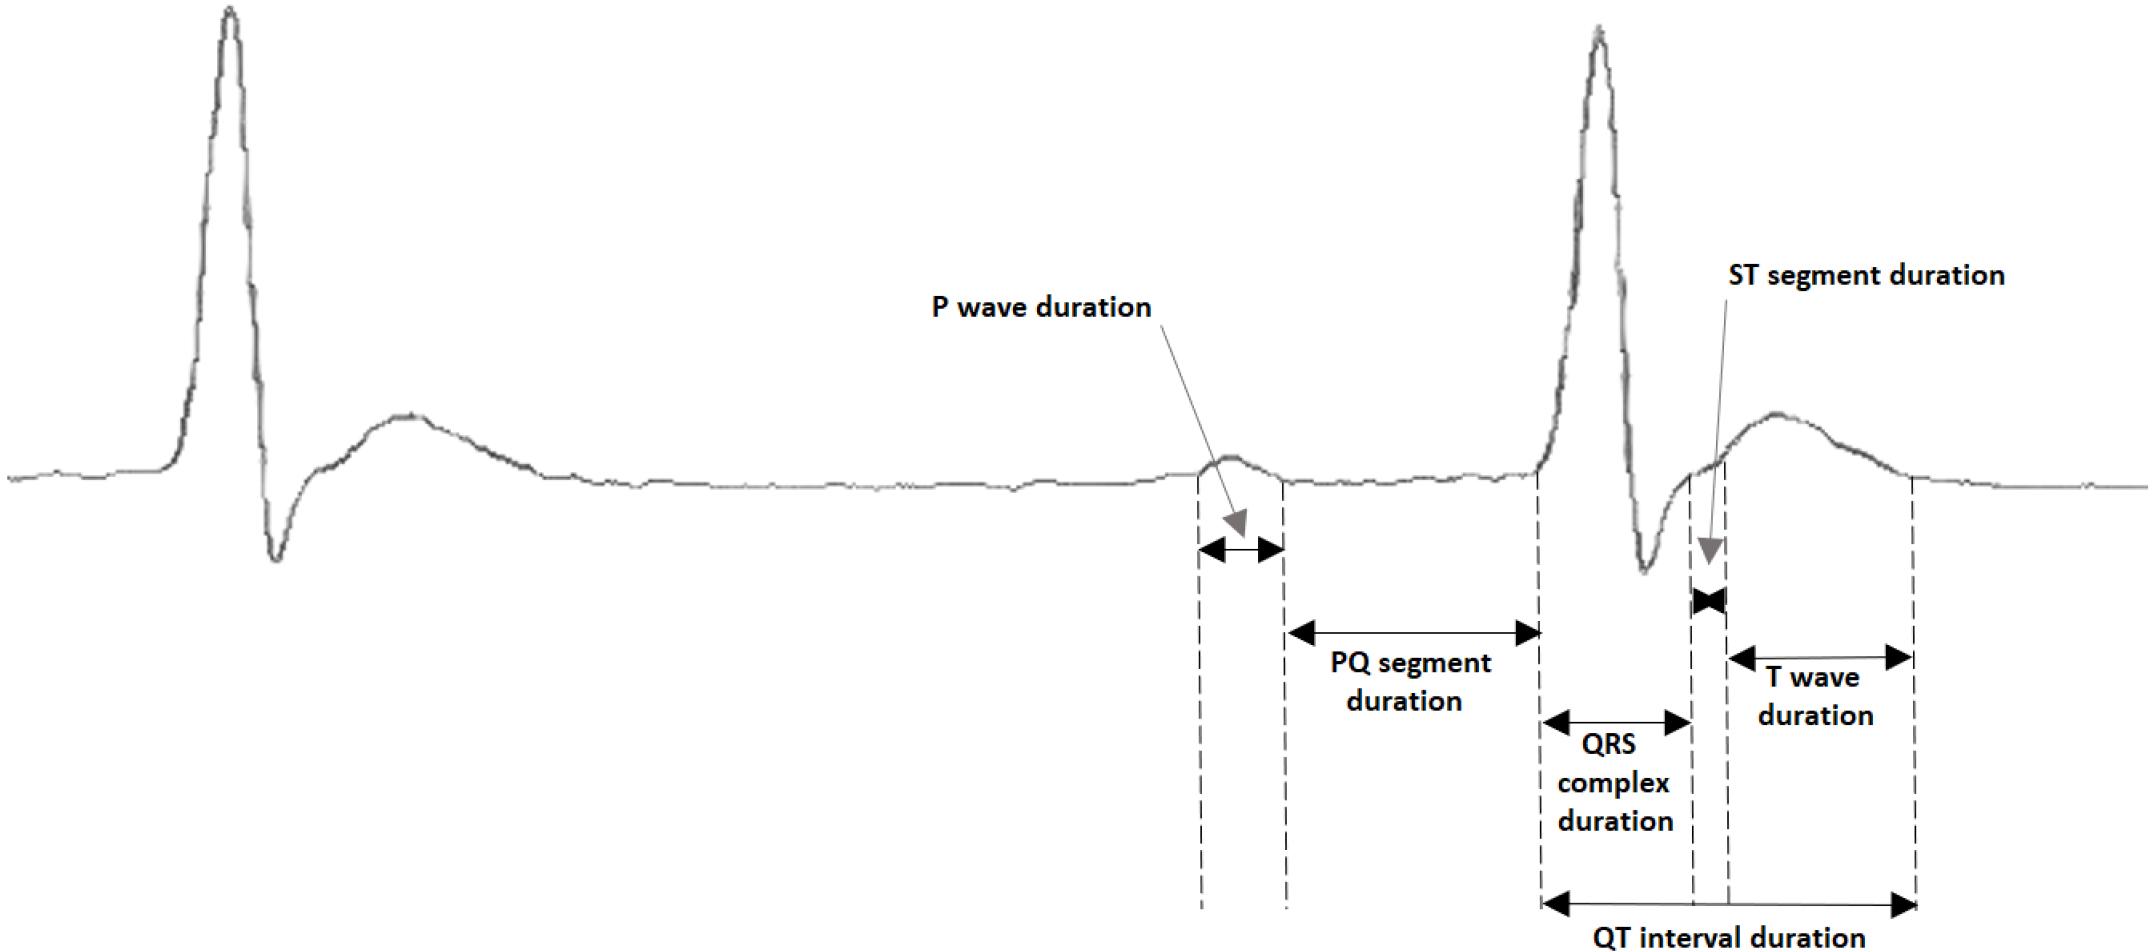
Figure 2
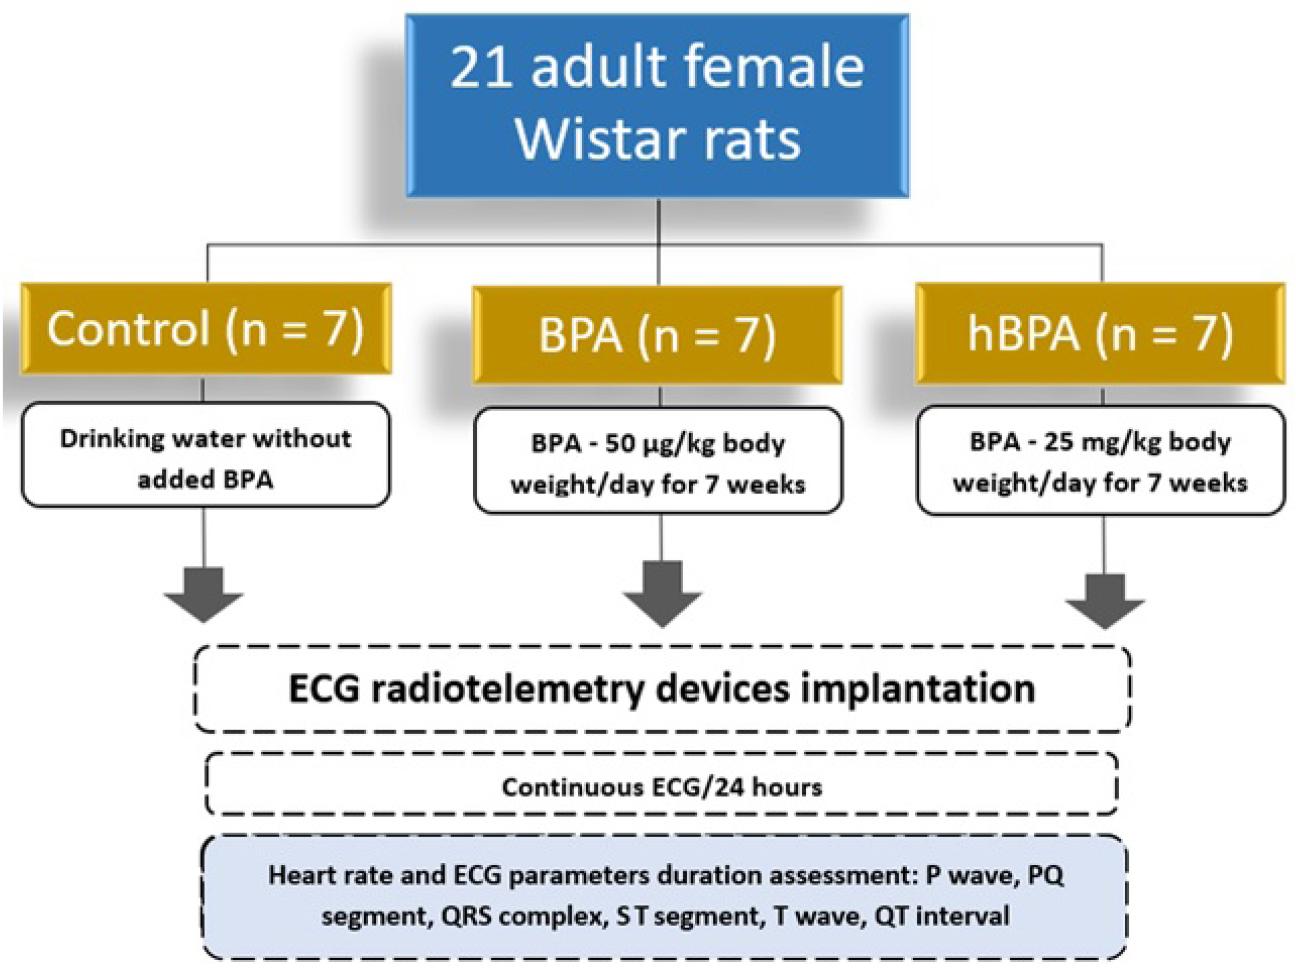
Figure 3
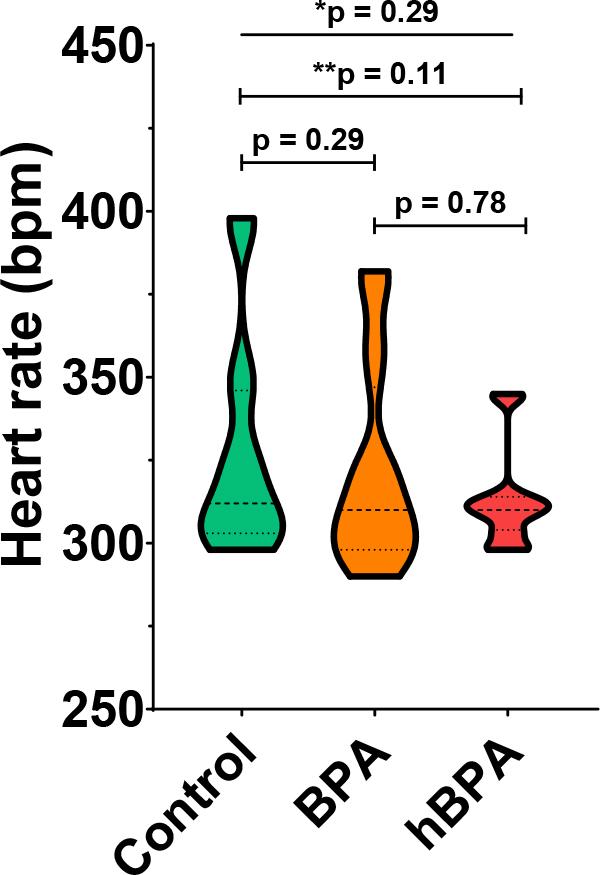
Figure 4
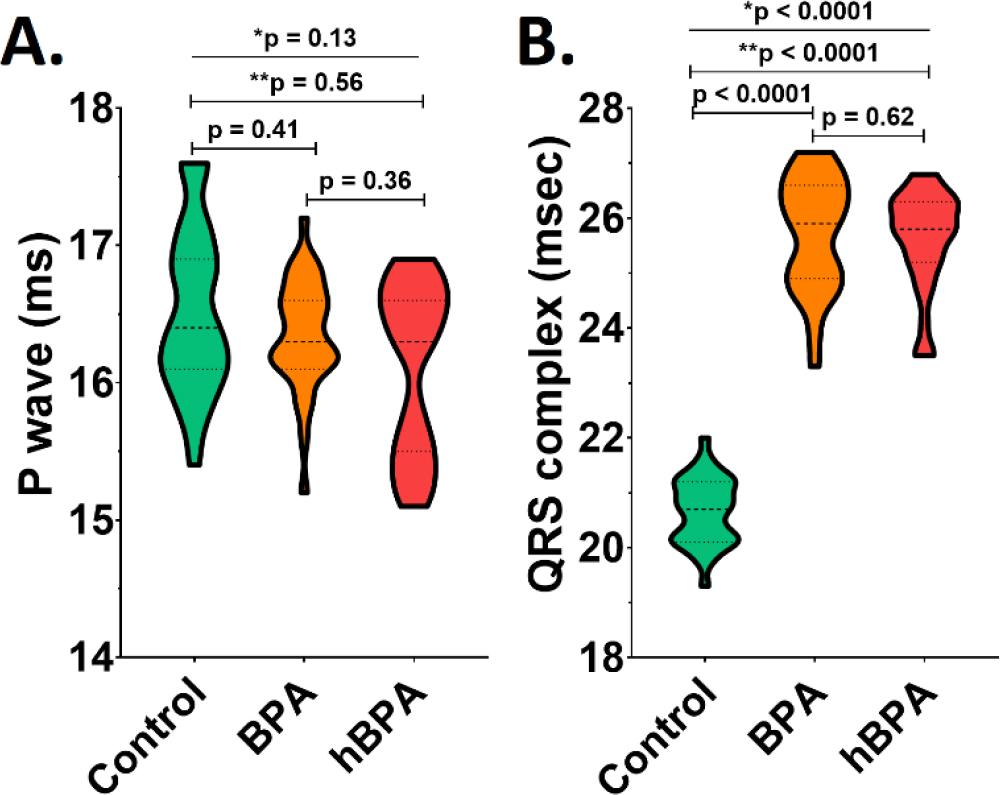
Figure 5
Figure 6
Figure 7
© 2025 Vasile-Bogdan Halaţiu, Dan-Alexandru Cozac, Ioana Alkora Balan, Marcel Perian, Valeriu Revenco, Vitalie Moscalu, Alina Scridon, published by Romanian Society of Cardiology
This work is licensed under the Creative Commons Attribution 4.0 License.