
Cardiac resynchronization therapy (CRT) emerged in the 1990s as an innovative and promising strategy for treating heart failure (HF) with reduced ejection fraction in patients’ refractory to medical treatment (1,2,3). Based on the premise of improving ventricular synchrony through artificial stimulation, this therapy is now under scrutiny. Over the years, CRT indications were expanded to patients with preserved or slightly reduced ejection fractions, aiming to avoid the deleterious effects of right ventricular apex pacing. This discovery broadened its utility, offering new indications. However, CRT involves ectopic stimulation with abnormal apex-to-base activation, raising philosophical concerns.
Since its inception, CRT faced technical challenges, particularly with coronary sinus catheter placement, controversial indications, and inconsistencies in post-device optimization. Consequently, many non-responders to this therapy were reported, and these numbers remained high despite numerous strategies proposed to resolve this issue. This has been compounded by a lack of standardization in application criteria (2,3).
In recent years, conventional CRT has been questioned, and new alternatives have emerged. Physiological stimulation of the conduction system has evolved, with changes in implantation sites and the development of tools to “facilitate” implantation. Clinically, the premise is to avoid desynchronizing patients before considering resynchronization, addressing both electrical and mechanical aspects (2).
The 12-lead electrocardiogram (ECG) has accompanied CRT’s evolution, serving as the conventional record of cardiac electrical activity. It is used to preselect HF patients as candidates for the therapy, identifying classical criteria for achieving the best response by improving ventricular activation synchrony and thus enhancing ejection fraction. Alongside CRT advancements, new tools for measuring electrical synchrony have also emerged. These methods revealed that some patients are not electrically desynchronized despite presenting left bundle branch block, and criteria like QRS width have lost relevance given the potential for significant desynchrony in patients with narrow QRS complexes.
The objective of this review is to explore the utilities of the ECG and new tools for measuring electrical synchrony that accompany CRT and physiological stimulation. This includes their role in preselection, during the chosen procedure, and in post-procedure optimization for the follow-up of patients with HF (to electrically resynchronize them) and for patients with chronic pacing (to avoid desynchronization).
In 1990, biventricular (BiV) pacemakers were introduced into clinical practice to treat myocardial dysfunction associated with left bundle branch block. Since then, Cardiac resynchronization therapy (CRT) has undergone notable evolution in both its technical development and the understanding of the pathophysiology of electrical and mechanical dyssynchrony (1). Additionally, over the last 20 years, several prospective, randomized, controlled trials have helped establish and expand CRT indications for both heart failure (HF) patients with reduced ejection fraction (HFrEF) and those with preserved ejection fraction (HFpEF) requiring chronic pacing. The latter approach has been gradually replaced by conduction system stimulation (4).
The combination of a high percentage of non-responders and the technical complexity of CRT has limited its use in daily practice, paving the way for alternative pacing strategies.
Two key trials, COMPANION (2004) and CARE-HF (2005), demonstrated CRT’s beneficial effects on hospitalizations and survival. Remaining doubts about CRT’s mortality benefits were resolved through multiple studies showing reduced morbidity and mortality with this therapy. These findings indicate that the greatest benefits are observed in patients in NYHA class III/IV with symptoms, despite optimal medical treatment, with a left ventricular ejection fraction (LVEF) ≤35%, QRS duration ≥150 ms, or 120–149 ms accompanied by echocardiographic dyssynchrony criteria.
HF can be categorized into three phenotypes based on LVEF measurements:
<40%: HF with reduced ejection fraction (HFrEF)
40-49%: HF with mildly reduced ejection fraction (HFmrEF)
≥50%: HF with preserved ejection fraction (HFpEF)
CRT is most significantly useful in patients with HFrEF and LVEF ≤35%. These patients constitute approximately 50% of the total HF population. Table 1 summarizes the main CRT indications proposed by the European Society of Cardiology in 2021 (4).
Recommendations of CRT in sinus rhythm
| RECOMMENDATIONS | Class | Level |
|---|---|---|
| CRT is recommended in patients in sinus rhythm with symptomatic HF, LVEF less than 35%, R-wave width longer than 150 ms and LBBB morphology, despite optimal medical treatment (reduction of symptoms and morbimortality) | I | A |
| CRT must be considered in patients in sinus rhythm, symptomatic HF, LVEF less than 35%, QRS width between 130 and 149 ms with LBBB morphology despite optimal medical treatment (reduction of symptoms and morbimortality) | II a | B |
| CRT is recommended in patients in sinus rhythm with symptomatic HF, LVEF less than 35%, QRS over 150 ms and morphology DIFFERENT than LBBB, despite optimal medical treatment (reduction of symptoms and morbimortality) | II a | B |
| CRT must be considered for patients in sinus rhythm, symptomatic HF, LVEF less than 35%, QRS width between 130 and 149 ms with morphology DIFFERENT than LBBB despite optimal medical treatment (reduction of symptoms and morbimortality) | II b | B |
| Patients with narrow QRS candidates to CRT, AV node ablation | II b | C |
| Patients with AF and HF candidates to CRT when LVEF less than 35% in FC IIII-IV with optimal treatment, QRS width less than 130 ms with a strategy assuring adequate BiV capture (90-95%). AV node ablation could be added with this purpose | II a | B |
| CRT is recommended instead of RV pacing for patients with HFrEF (less than 40%) in any functional class, with indication of ventricular pacing and with high degree AV block, with the purpose of reducing morbidity. This includes patients with AF | I | A |
Two key elements are evaluated from an electrocardiographic perspective in patients considered for CRT: The presence of typical left bundle branch block (LBBB) or intraventricular conduction delay and the duration and morphology of the QRS complex. These characteristics, combined with other factors such as LVEF and functional class, determine the likelihood of a positive response to therapy.
Patients with an LVEF below 35%, functional class III-IV, and a typical LBBB pattern, especially with a QRS duration greater than 150 ms, derive the most benefit from CRT, making the indication Class I, Level of Evidence A (CI-A). The benefits decrease—and the indication shifts to Class IIa—when the QRS duration is less than 130 ms.
The definition of true LBBB appears to be the main starting point for selecting CRT candidates. Although there is no universally accepted standard for defining LBBB, classical criteria identify certain parameters associated with a favorable CRT response. For patients with non-true LBBB or without LBBB, other electrocardiogram (ECG) predictors include QRS fractionation, S wave in lead V6, intrinsic deflection delay, or non-invasive estimates of Q-LV timing.
QRS duration ≥120 ms.
rS or QS pattern in leads V1-V2.
R waves with “notching” or fragmentation in leads I, aVL, V5-V6.
Intrinsic deflection delay in V5-V6 ≥50 ms.
ST-T changes opposite to the main QRS axis.
Absence of lateral Q wave due to the absence of the septal vector.
Other proposed criteria in the literature include:
The main axis direction of the QRS complex.
Intrinsic deflection duration.
The aVR/aVL ratio or the “Verekei index.”
Cross-correlation index between leads II and V6.
Presence of an S wave in V6.
However, these additional criteria are less reproducible and more labor-intensive.
Although the ECG is fundamental in selecting CRT candidates, the lack of standardized criteria over the years has often complicated its use. Moreover, questions have arisen about CRT response based on QRS width. Findings from MADIT-CRT, REVERSE, and RAFT trials suggest that CRT can benefit all patients with LBBB, regardless of QRS duration, and that a clear QRS cutoff point to exclude nonresponders cannot be established. In contrast, CRT benefits in non- LBBB patients are mainly observed when the QRS is 150 ms or longer.
While these criteria have been classically described, they are currently undergoing constant revision as evaluated by our group and other researchers (3).
Based on the difficulties described, different methods have been proposed to measure electrical synchrony. One of the most widely used by different groups worldwide is Synchromax ®, a device that allows for noninvasive, on-line measurement of electrical synchrony. By connecting the device to the classic 12-lead ECG leads, Synchromax ® captures the signals (mainly lead II and V6) that correlate the lateral wall and the IV septum, processes them and averages them using cross-correlation, resulting in a Synchrony Index and an Electrical Synchrony Curve (Figure 1a) (7,8). Crosscorrelation is a measure of the similarity of two signals as a function of the offset of one from the other. In intrinsic conduction, simultaneous QRS complexes from different leads tend to minimize the phase between them. That is, the R peaks tend to align spatially. However, when conduction pathways are impaired, leads projecting onto fibrotic or nonconducting myocardium show delayed spikes, in addition to changes in morphology that affect their similarity to the healthy situation. This is the basis for the cross-correlation analysis chosen for the Synchromax ® system.
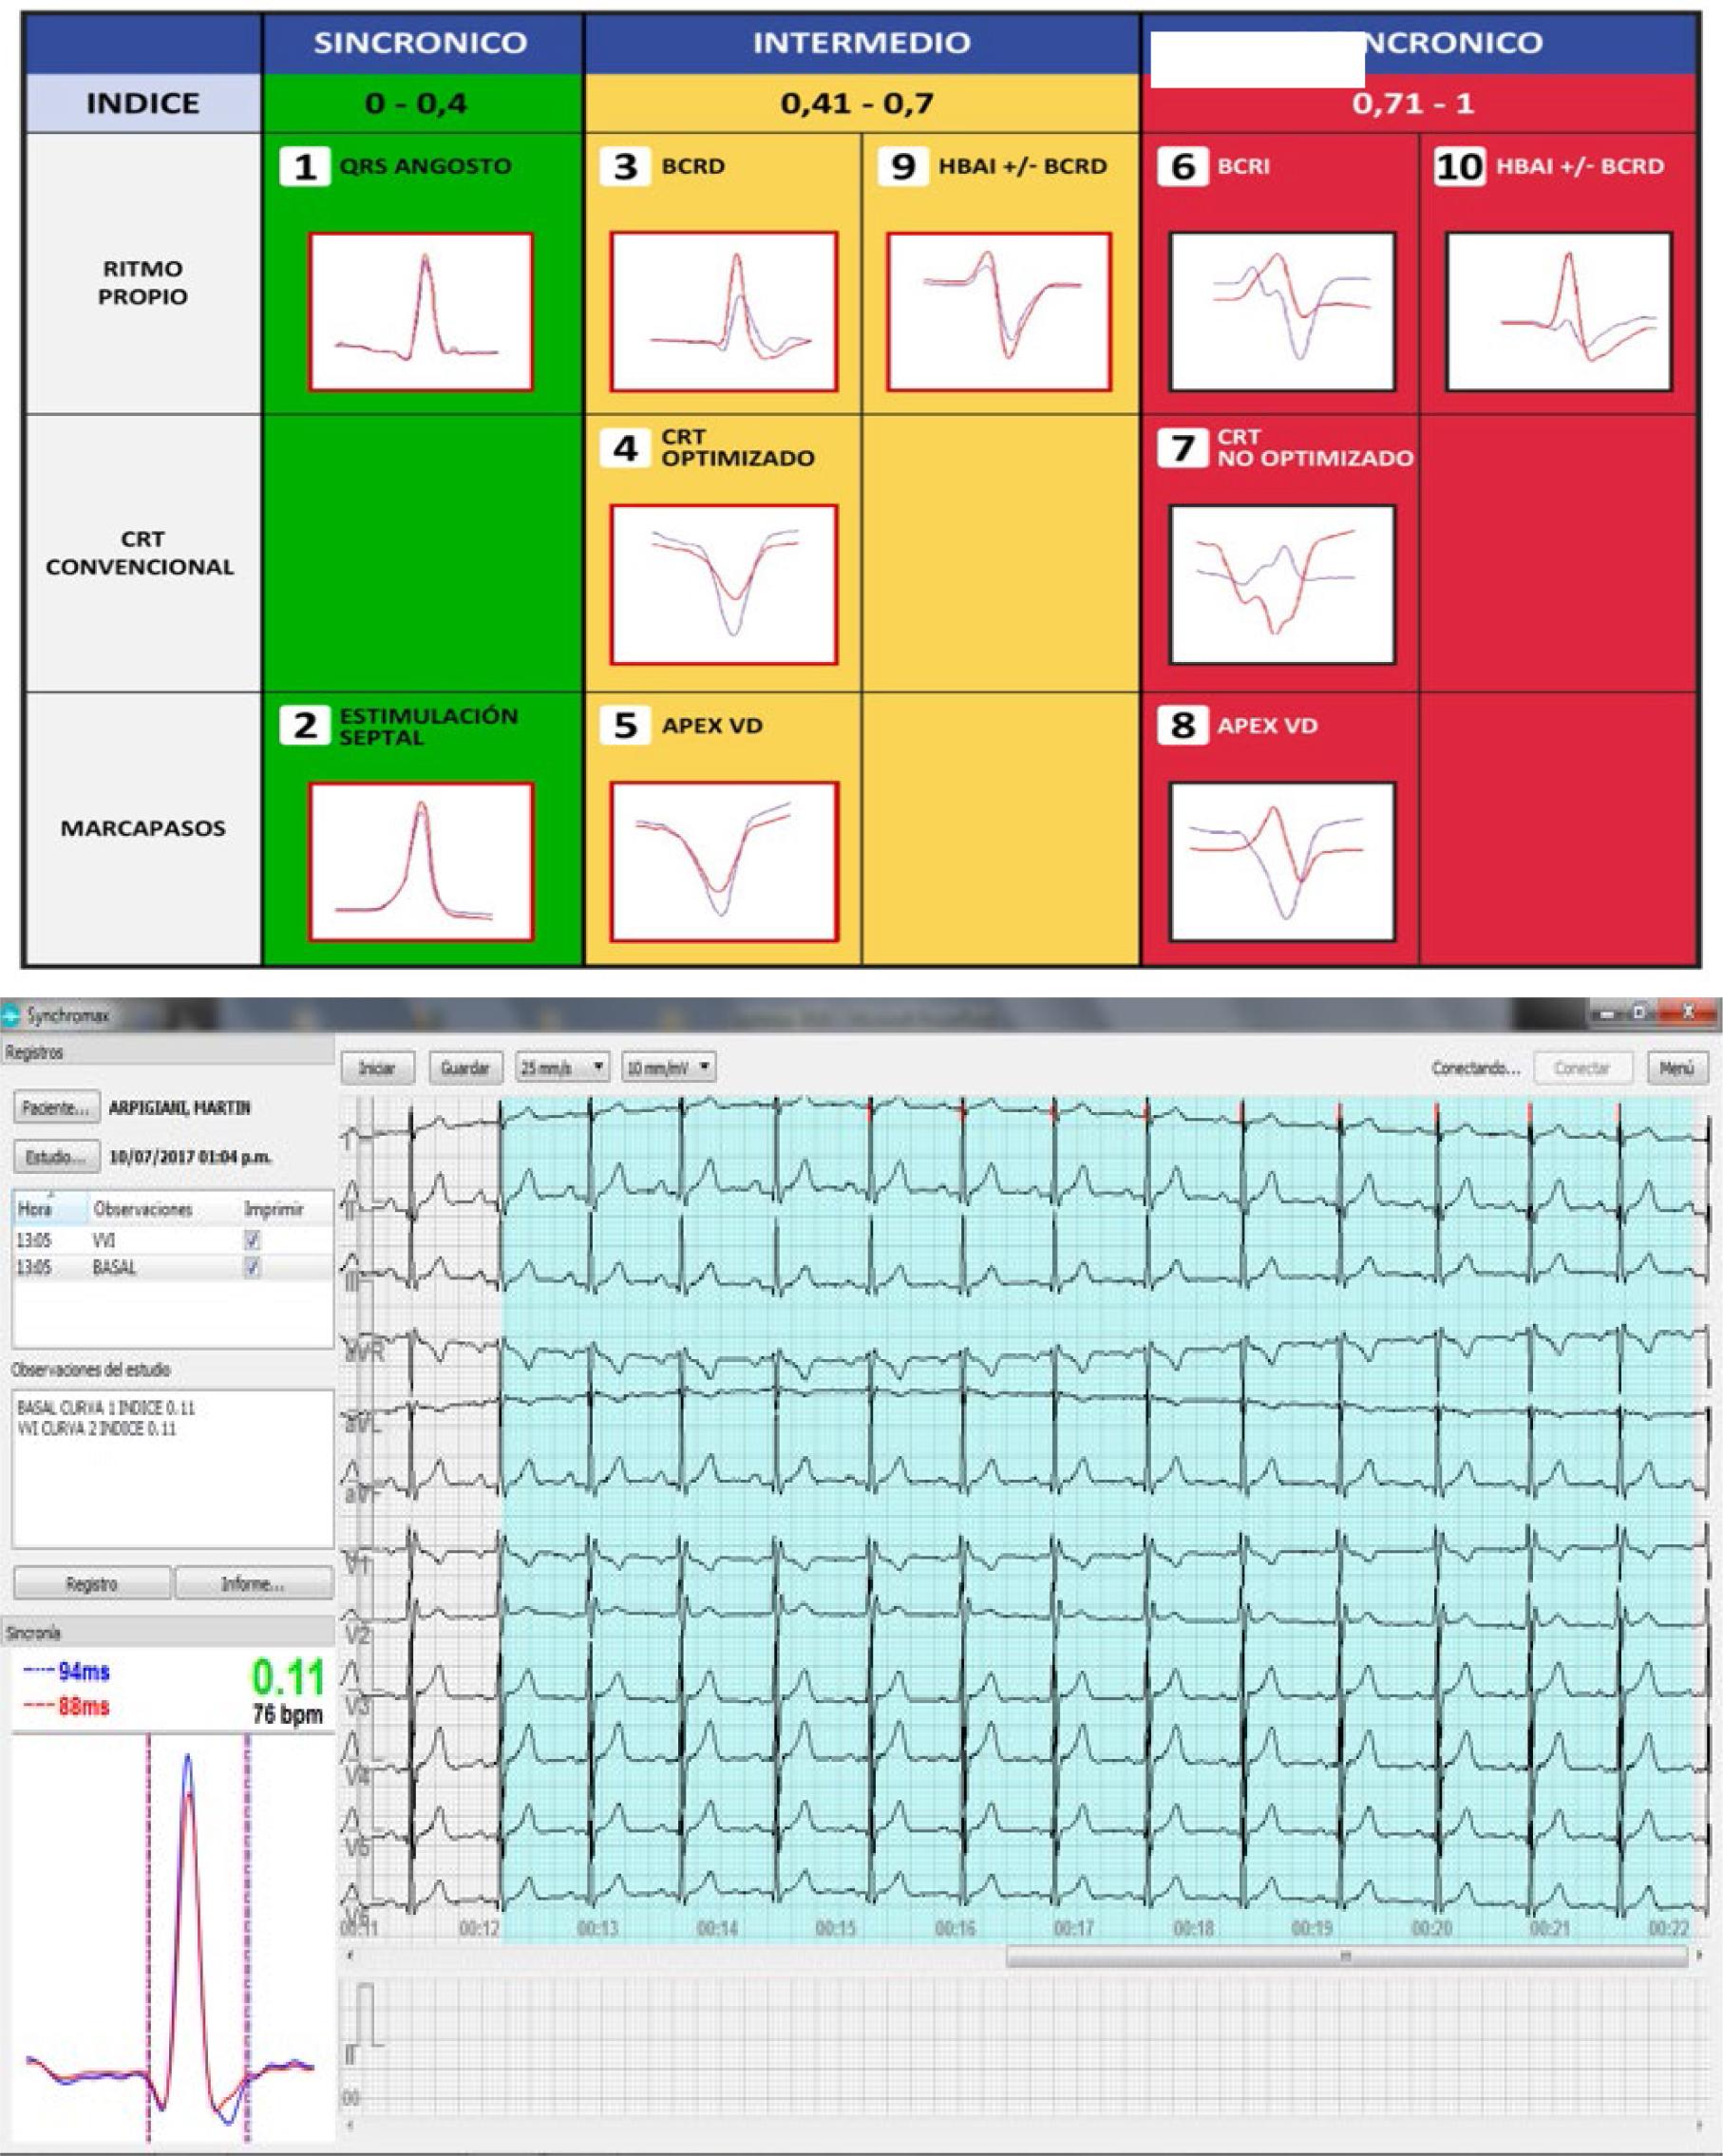
a and b. a. Left panel: Chart of electrical synchrony evaluation by Synchromax® method. Curves are divided according to the synchrony index value: between 0 and 0.4 are synchronous; between 0.41 and 0.7 are intermediate; and between 0.71 and 1 are dyssynchronous. Note the different curves in each column. b. Right panel: Screen delivered by the device for electrical synchrony evaluation
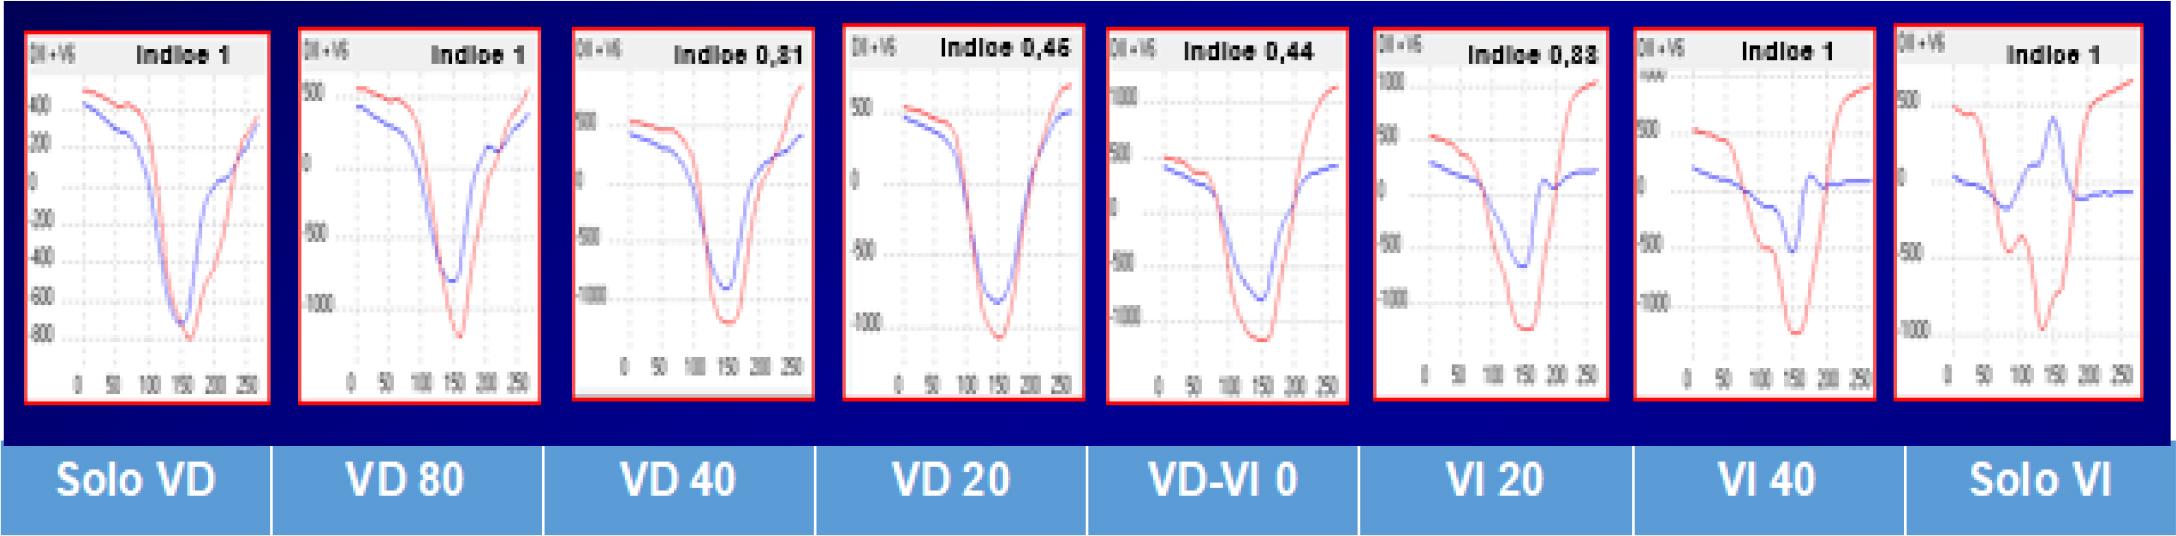
Online electrical synchrony evaluation by Synchromax ® method in patients with CRT. Post-implant optimization. Different synchrony curves and indexes are evident after V-V interval programming
All possible permutations of two leads in the set I-II-V1-V6 were analyzed. Only the pair that provided the best fit, II-V6, was left for further analysis. ECG recordings were bandpassed with a Butterworth filter (4th order, 0.5 - 80 Hz), power line interference was attenuated by means of a notch filter (Butterworth, 4th order, 50 Hz), and the points reference values were found by means of a delineator based on a wavelet transform. Interlead characteristics were extracted during depolarization, therefore only QRS segments from both leads were used, with II_qrs and V6_qrs being the corresponding QRS segments within a time window of 182 ms. Cross-correlation was then applied to segments II_qrs and V6_qrs. Characterization of the resulting correlation signal gave rise to the following parameters: 1) Maximum correlation amplitude (CorA) between Lead IIqrs and V6_ qrs; 2) Correlation width (CorW) measured at 70% of the maximum CorA, relating the average QRS widths; 3) The correlation change (CorS) measured at the peak time of the cross-correlation signal (phase); 4) The QRS duration (QRSd) measured from the peak to the last QRS offset when stimulated; and 5) Area under V6_qrs (A). All these ECG parameters plus QRS duration, age, and sex were tested as predictors in a mixed linear model to assess their association with left ventricular free wall activation measured invasively by coronary sinus mapping (8,16,17).
The output of this model is a dyssynchrony index (DIn) ranging from 0 to 1. In addition, electrical synchrony curves (ESCs) are generated. These curves were classified according to a DIn, giving rise to eight different morphologies. An electrical synchrony chart was generated based on the different curves and the electrical synchrony indices (Figure 1b). Obviously, these are frequent models but there are as many curves as ECG tracings (7,8,9).
The usefulness of the device in the preselection of patients who are candidates for CRT was demonstrated in different studies carried out by various working groups worldwide.
In one of them, different types of LBBB and their potential relationship with the dissimilar response to CRT were evaluated. There were 61 patients with LBBB who were candidates for CRT included. Using the electrical synchrony measurement method, it was concluded that 29.5% were not electrically asynchronous. This could explain a group of non-responders to CRT. In addition, the QRS width was not useful for evaluating electrical synchrony (Figure 3 and 4) (9,18).
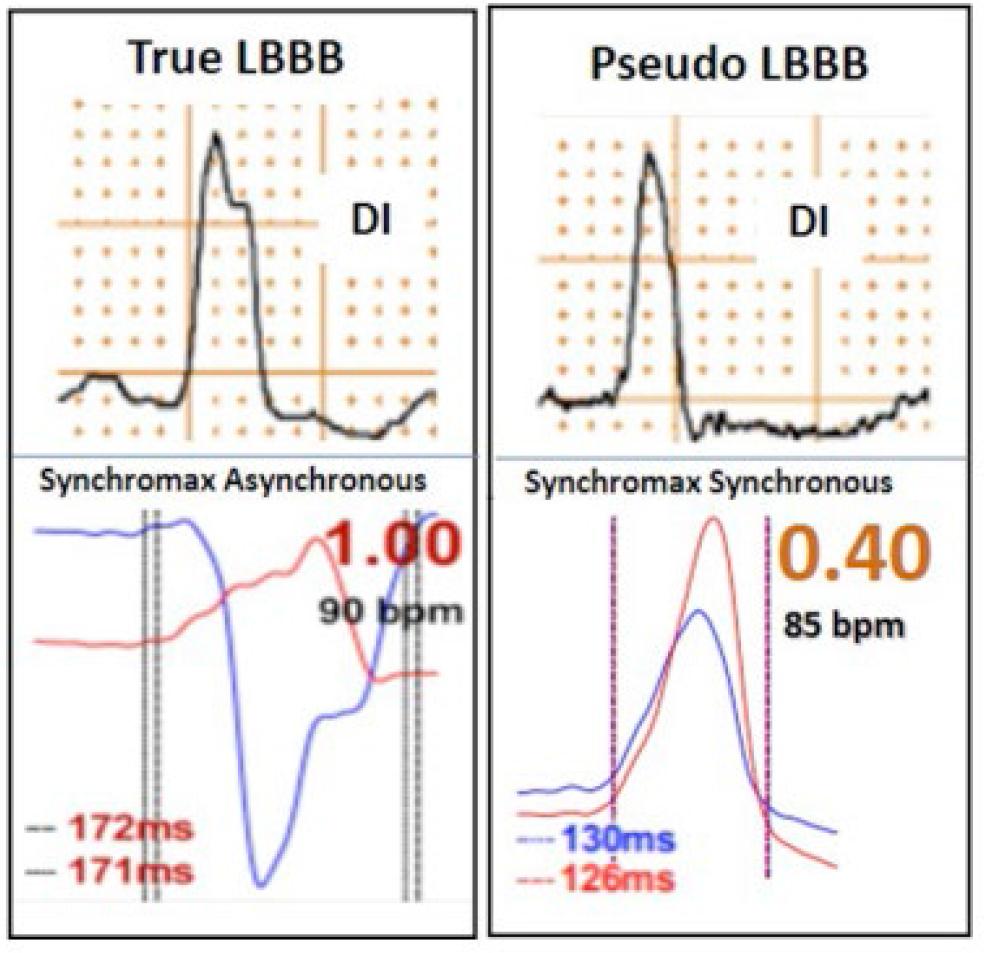
Synchromax curves in true left bundle branch block (LBBB) (index 1) and pseudo LBBB (index 0.4)
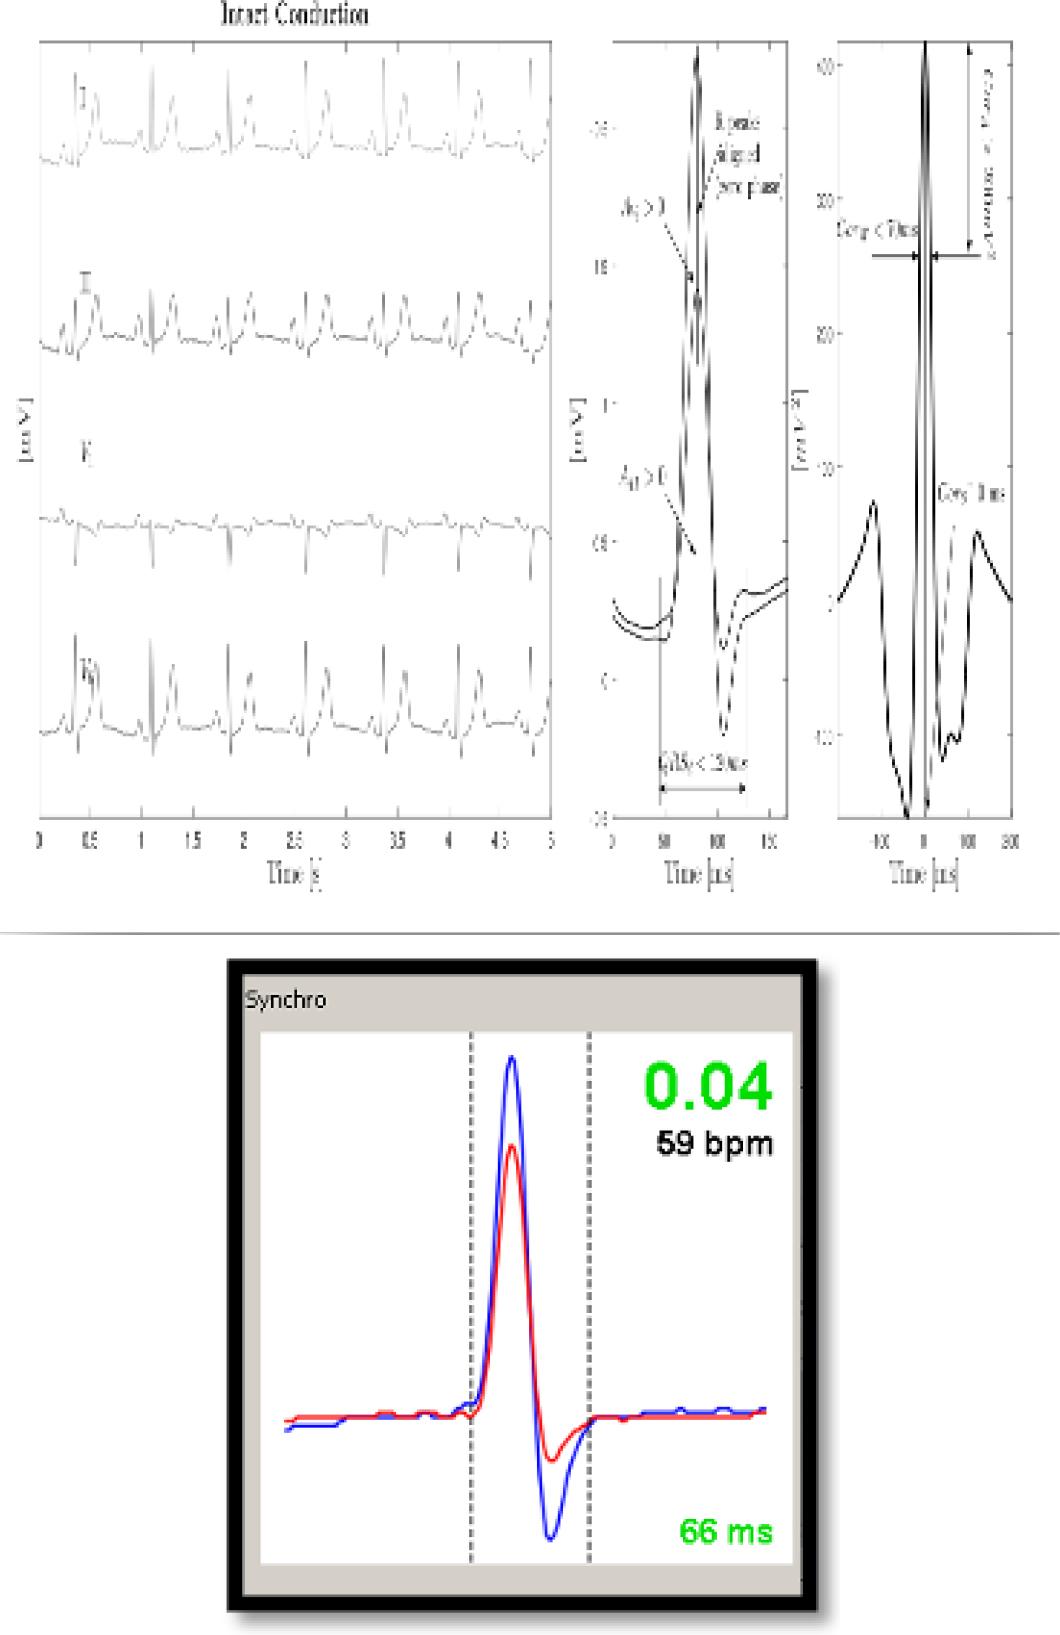
a and b. a. Cross correlation time and amplitude between DII and V6. Parameters evaluated:
- -
Maximum QRS amplitude correlation
- -
QRS width correlation 70% amplitude
- -
Correlation of changes to the peak of the signal.
- -
QRS duration from spike to last QRS
- -
Area under QRS V6 with cross-correlation between II and V6 b. Synchrony index.
This work gave rise to other studies where synchronous and dyssynchronous left bundle branch blocks were evaluated. This raises the possibility that LBBB that are synchronous at baseline are non-responders to CRT, since there would be no possibility of improvement in synchrony with BiV stimulation (9,10).
Recent research allows us to assert that not only LBBB produces dyssynchrony in interventricular activation. The association of RBBB with left anterior hemiblocks (LAH) generates a marked dyssynchrony, although not due to a delay in the activation of the lateral wall of the LV as occurs in LBBB, but due to opposite directions of activation flow, which is why traditional CRT in right bundle branch blocks associated with hemiblocks could never improve the evolution of these patients with HF, since it does not correct the activation defect inherent to them. It should be noted that this dyssynchrony is independent of the QRS width (10).
On the other hand, 30 to 60 % of patients with LBBP present the same dyssynchrony reaffirming this condition. Recent research of our group demonstrated paradoxical septum movement in this condition.
Regarding the usefulness of the ECG during CRT device implantation, the literature has not provided sufficient evidence to make an objective recommendation. However, noninvasive electrical synchrony measurement using the Synchromax® method enables the selection of the electrical synchrony curve and index that are closest to optimal during the procedure. Using the device simplifies the procedure by providing an objective, real-time measurement of electrical synchrony to ensure the correct positioning of the catheters for each patient. This is particularly beneficial for patients with conditions such as marked fibrosis, which may affect the procedure.
After implantation, two parameters in the patient’s ECG with CRT need to be evaluated: The duration and morphology of the stimulated QRS complex. In theory, the duration of the QRS complex during CRT is a determinant of therapeutic response; the narrower it is, the better the prognosis. Some authors have proposed programming the device to initially stimulate only the left ventricle (LV) while shortening the RV-LV interval to achieve the shortest QRS duration. The industry is also developing automatic algorithms for this purpose (6).
To assess the contribution of LV stimulation, the morphology of the QRS in the precordial leads should be evaluated. During BiV stimulation, the QRS complex most commonly exhibits a dominant R wave in leads V1-2, which suggests a LV contribution. However, a dominant R wave in lead V1 is not diagnostic of BiV stimulation, as RV-only stimulation may occasionally produce the same pattern. Therefore, adequate evaluation of BiV stimulation should include assessments of RV-only and LV-only stimulation. A negative QRS complex in lead V1 warrants further investigation, although it does not necessarily indicate inadequate CRT. This finding could result from lead misplacement, displacement, or inappropriate placement of the LV lead (e.g., in the middle or anterior cardiac vein) (14).
In one study, the response to CRT was analyzed in relation to the ECG during BiV pacing. The analysis showed that the presence of BiV fusion on the ECG—manifested as a new or increasing R wave in leads V1 and V2—was significantly related to the probability of reverse remodeling, even after adjusting for the degree of myocardial scarring. More recently, an analysis of QRS morphology during BiV pacing in leads V1-2 identified three distinct patterns: a. A fusion complex with an increased R wave, independent of QRS duration.b. A QS pattern with normalized QRS duration. c. A QS pattern with increased QRS duration.
Although group b represented a relatively small subset of patients in the study, these individuals experienced the greatest benefit from reverse remodeling. In this group, the pacing wavefronts from the RV and LV appeared to be opposite, resulting in QRS normalization through the cancellation of activation waves. Conversely, another study did not identify a dominant R wave in lead V1. Instead, it found that a dominant negativity in leads I and aVL correlated more strongly with acute hemodynamic improvement following AV and VV optimization.
The literature on the prognostic value of QRS duration during CRT remains controversial. This variability may be partly explained by studies where QRS duration was not a significant factor in patients with a type 1 QRS pattern in lead V1. However, in patients with a QS pattern in lead V1 and normalized QRS duration, a better prognosis was observed (14).
After implantation of a CRT device, optimization is essential to achieve the desired therapeutic objectives. Synchromax® is a valuable and straightforward tool for this purpose. By programming different V-V intervals and achieving an interplay between them, electrical synchrony can be evaluated in real time. This approach enables the objective determination of the optimal interval for electrical synchrony tailored to each patient. Chart 2 illustrates the online evaluation process with modifications to the V-V intervals to achieve the best synchrony index and curve (11).
As a result of the limitations observed over years of CRT use, new methods of stimulation have been developed, leading to the expansion of the concept of physiological stimulation (PS). PS is defined as any form of cardiac stimulation aimed at restoring or preserving synchrony in ventricular contraction.
PS can be achieved by activating the intrinsic conduction system through conduction system pacing (CSP), which includes His bundle stimulation (HBS) and left bundle branch area (LBBA) stimulation. Alternatively, it can be achieved through CRT itself via BiV stimulation.
His pacing (HP) involves the direct stimulation of the His bundle to activate the native conduction system. Depending on the location and results of the stimulation, HP can be:
Selective HP: Isolated recruitment of the His bundle.
Nonselective HP: Recruitment of both the local septal myocardium and the His bundle.
LBP (excitation of the left bundle branch) is a ventricular stimulation technique designed to activate all or part of the left bundle branch fascicular system. Similar to HP, the responses may vary based on the location and stimulation results, including
Selective LBP: Direct stimulation and isolated recruitment of left bundle branch (LBB) fibers.
Nonselective LBP: Direct stimulation and recruitment of both local myocardium and LBB fibers.
Deep Septal Stimulation: Stimulation without direct recruitment of LBB fibers (12).
During the implantation of the electrodes, it is essential to confirm the capture of the conduction system, which can be a challenge. The 12-lead ECG is useful to differentiate the capture of the conduction system and the surrounding myocardium, to accurately establish the pacing thresholds and to appropriately program the pacing outputs. Over the years, different criteria have been incorporated in order to unify and define the pacing of the conduction system, thus homogenizing these concepts.
The ECG allows assessment and analysis of pacing morphologies to confirm QRS narrowing and conduction system capture, including correction of blocks, differentiation of nonselective HBP from right ventricular septal (para-Hisian) pacing. An electrophysiologic recording system and/or a pacing system analyzer to record His bundle and left branch electrograms may be helpful in identifying conduction system capture. ECG-based criteria are listed in Table 2. To differentiate nonselective HBP from RV septal pacing, the ECG-based criteria of absent QRS notching in leads I, V1, V4–V6 and the RWPT (R wave peak time of V6) of 100 ms were associated with 100% specificity. RWPT measurement is assessed from the pacing artifact to the peak of the R wave. A change in V6 RWPT of 0.12 ms between the stimulus and the RWPT and between His and the V6 RWPT has been shown to have a sensitivity of 99.1% and a specificity of 100% to confirm the lack of His capture (12).
His selective and no selective criteria. CHUNG et al., 2023 HRS, APHRS, LAHRS, guideline on cardiac physiologic pacing
| Baseline | Normal QRS duration | His-Purkinje conduction disease | |
|---|---|---|---|
| With correction | Without correction | ||
| Selective HBP |
|
|
|
| Nonselective HBP |
|
|
|
Adapted with permission from Vijayaramanet aL.12 BBB = bundle branch block; HBP = His bundle pacing; H-QRS = His-QRS interval; RV = right ventricle/ven- tricular; S-QRS = stimulus to QRS onset interval; V6 RWPT = R-wave peak time in Lead V6.
| Pacing type | Criteria |
|---|---|
| Left ventricular septal pacing |
|
| Left bundle branch area pacing |
|
Left bundle branch area pacing includes both LV septalpacing and left bundle branch pacing.
RWPT and LVAT here should be assessed starting from the stimulation artifact rather than from the inferred QRS onset. CT = computerized tomography; HBP = His bundle pacing; LBB = Left bundle branch; LBBB = left bundle branch block; LBBP = Left bundle branch pacing; LBBAP = left bundle branch block area pacing; LV = left ventricle/ventricular; LVAT = Left ventricular activation time; RWPT = R-wave peak time; V6 RWPT = R-wave peak time in lead V6.
Left bundle branch pacing criteria are assessed by 12-lead ECG. They are described in Table 3. These electrocardiographic criteria, as well as those proposed for selective and non-selective His capture, have been agreed upon, but have not yet stood the test of time. Selective His pacing is in frank decline, due to high chronic thresholds, oversensing and low R-wave amplitude. Left bundle branch pacing, which is emerging as a new pacing modality, presents complications and difficulties, and is not entirely synchronous. The third proposed alternative is non-selective His (or para-Hisian) pacing guided by electrical synchrony, which could be proposed as a safe, reproducible, and simple alternative (12).
Left bundle branch capture criteria
| Pacing type | Criteria |
|---|---|
| Left ventricular septal pacing |
|
| Left bundle branch area pacing | 1. Evidence of LV septal pacing added to any of the following left branch capture criteria:
Left bundle capture criteria
|
| Left bundle branch area pacing | 2. Evidence of LV septal pacing added to any of the following left branch capture criteria:
Left bundle capture criteria
|
Our group developed a non-invasive electrical synchrony-guided implantation technique using conventional screw-in catheters. The technique was evaluated in different studies. In one of them, its objective was to evaluate the safety and usefulness of the method of implanting cardiodefibrillators and pacemakers in para-Hisian positions guided by noninvasive evaluation of electrical synchrony using conventional screw-in catheters for pacemakers and defibrillators. There were 386 patients evaluated in a center in Argentina. All had an indication for ventricular stimulation. Electrical synchrony was evaluated with Synchromax in all patients during implantation. Curves and corresponding indices were analyzed. A type 2 curve with an index less than 0.4 was considered synchronous. A type 8 curve was considered dyssynchronous with an index greater than 0.7 according to the Synchromax curve chart. The number of attempts, thresholds, and displacements were analyzed. The technique consisted of performing a J-shaped curve and a small counter-curve perpendicular to the previous one at the tip of the stylet. An average of 1.9 attempts were needed. The average thresholds were 1.1 mV. Five patients evolved with an increase in the threshold that did not require lead repositioning. The displacement rate was 1.8% (7 patients). The type 2 curve with an index less than 0.4 was achieved in 95.8% of the implants. Few attempts were needed and the thresholds were similar to those used with the conventional implant technique in the right ventricular apex (13).
The variables commonly used in conventional ECG have undergone numerous modifications over the years, with consensus evolving drastically. For this reason, our group has developed a useful and simple alternative to assess electrical synchrony, which shows a good correlation with mechanical synchrony. Physiological pacing has also changed significantly over the years. The latest results indicate that an ideal stimulation method has yet to be identified.
Moreover, there is a philosophical controversy surrounding leadless pacemakers, which remains an unresolved issue as it contradicts the principles of physiological pacing. Nonetheless, some of our researchers have already begun evaluating electrical synchrony using Synchromax® in leadless pacemaker implants (15).
In a recent (2023) consensus, the European Heart Rhythm Association (EHRA) recognizes the need for a device that, using the ECG signals, helps physicians attempting Conduction System Pacing (12).
The possibility could be evaluated of adopting this tool as a standard method to assess cardiac electrical synchrony before, during, and after the implant of any device.