Figure 1
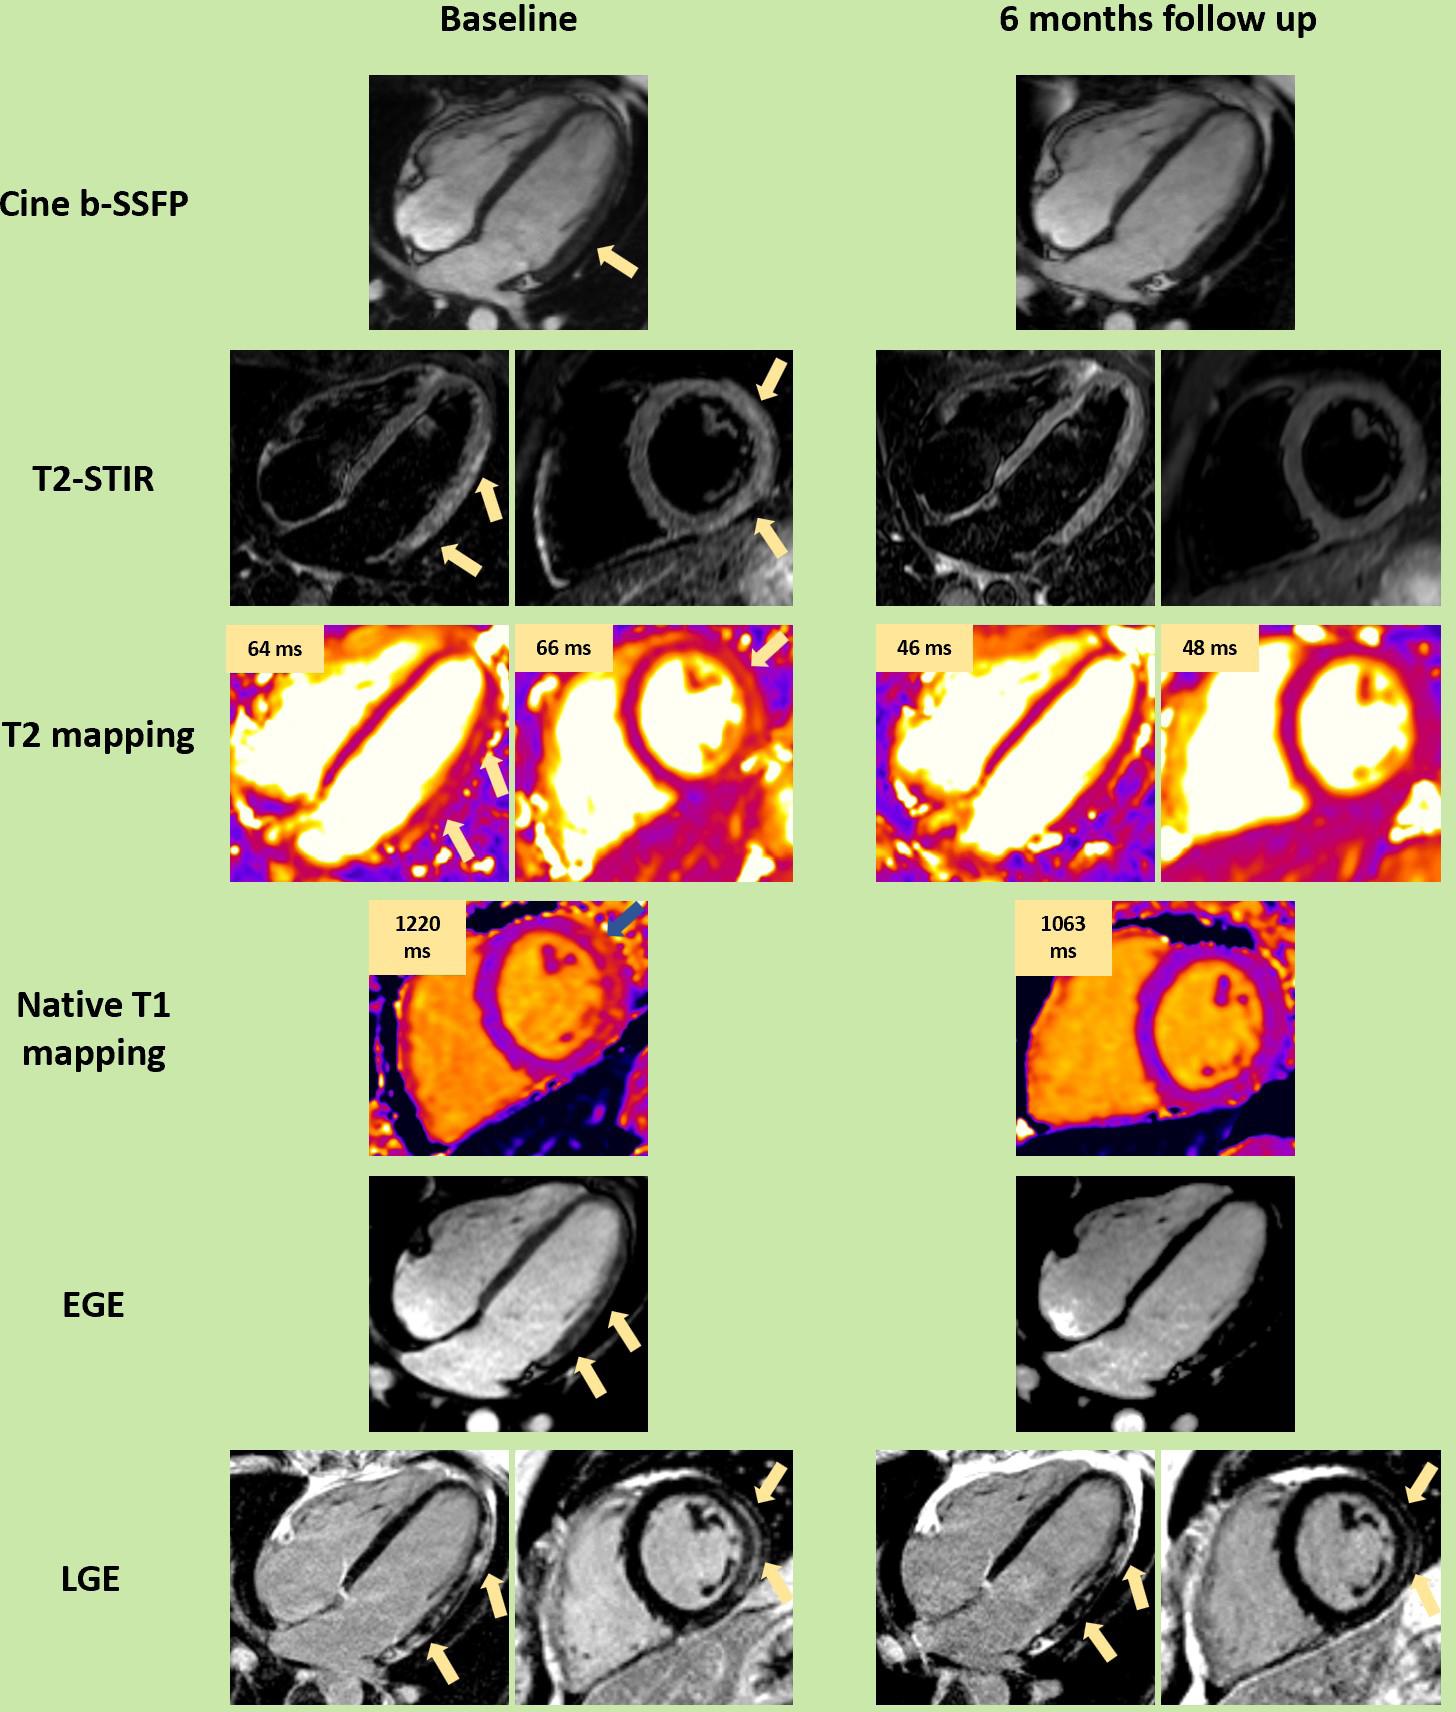
Figure 2
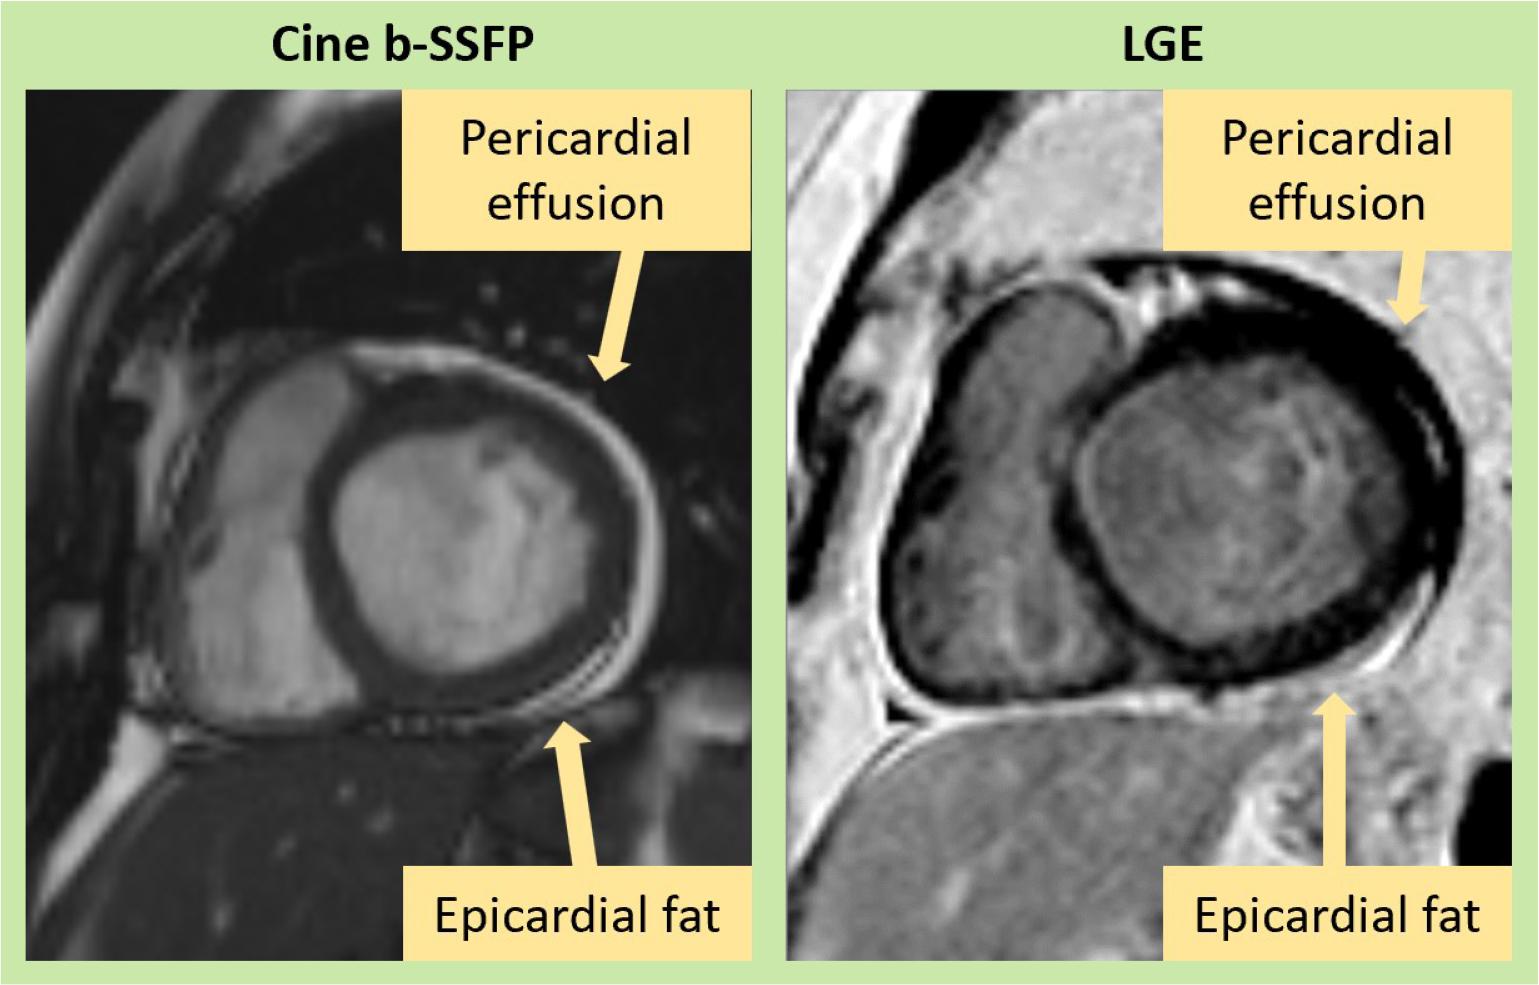
Figure 3
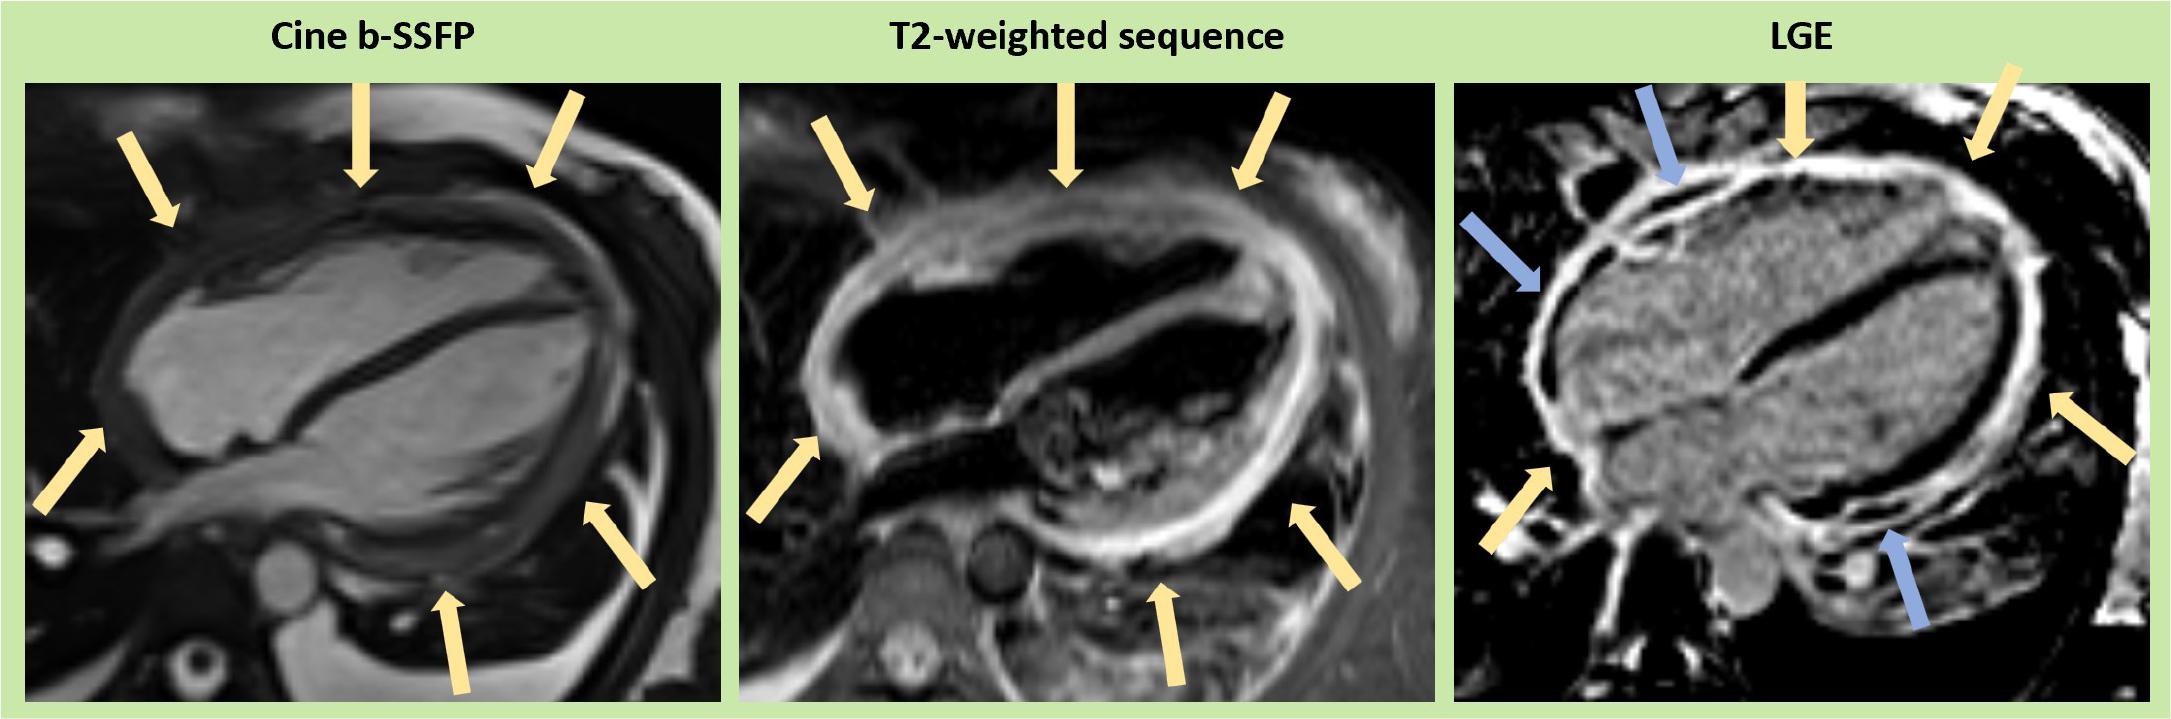
Figure 4
Updated recommendations of CMR criteria of myocardial inflammation_ ECV (extracellular volume), EGE (early gadolinium enhancement), LGE (late gadolinium enhancement), LV (left ventricle), SI (signal intensity)
| Original Lake Louise Criteria (Any 2 out of 3) | Updated Lake Louise Criteria (2 out of 2) | Diagnostic Targets |
| Main criteria | T2-based imaging | Myocardial edema |
| EGE | T2 relaxation time | ↑T1 – edema, hyperemia/capillary leak, necrosis, fibrosis |
| Supportive criteria | Pericardial effusion in cine images or | Pericardial inflammation |