Myocardial inflammation, caused by various factors like viruses, autoimmune diseases, or toxins, is a significant cause of chest pain and other symptoms. Cardiac Magnetic Resonance (CMR] imaging plays a crucial role in diagnosing and managing this condition, offering noninvasive insights that can guide treatment, especially in differentiating between ischemic and nonischemic etiologies. While biopsy remains the definitive method for identifying specific causes, CMR is invaluable in detecting myocardial inflammation and predicting outcomes. The European Society of Cardiology [1] and American Heart Association [2] endorse CMR for assessing myocarditis, highlighting its importance in both diagnosis and prognosis.
CMR imaging is highly sensitive to the tissue changes associated with myocardial inflammation, such as edema, hyperemia, myocyte injury, and fibrosis (Figure 1). These changes reflect the severity of inflammation and vary based on the underlying cause and individual factors. While CMR can detect these inflammatory changes, it typically cannot pinpoint the specific etiology of the inflammation. However, it serves as a valuable tool for assessing the extent of tissue damage and may help identify patterns or differences among patient subgroups based on their clinical presentation.
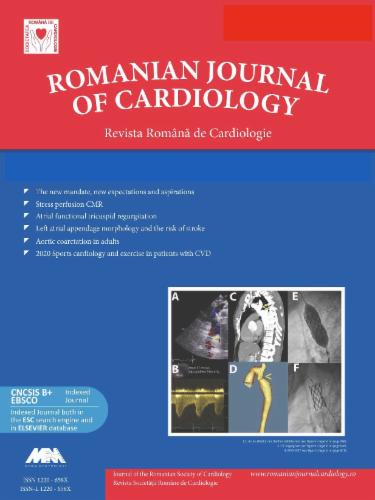
Contrast-enhanced cardiac magnetic resonance imaging of a patient with acute myocarditis at baseline and 6-month follow-up. High signal intensity in the basal and mid-to-apical lateral wall on cine and T2-STIR sequences (yellow arrows) corresponding to focally elevated myocardial T2 and native T1, indicating myocardial edema. The same myocardial segments also showed patchy, subepicardial high signal intensity on both EGE and LGE sequences (yellow arrows), revealing myocardial hyperemia, and myocyte necrosis and fibrosis, respectively. At the 6-month follow-up scan, a complete resolution of myocardial edema was observed on both T2-STIR and T2 mapping, though only a partial resolution of myocyte injury was seen on native T1 mapping and LGE (yellow arrows). All images were acquired using a 1.5 T scanner, with normal T1 ranging between 970 and 1050 ms and normal T2 between 40 and 51 ms. b-SSFP, balanced steady-state free precession, EGE (early gadolinium enhancement), LGE (late gadolinium enhancement), STIR (Short Tau Inversion Recovery).
Tissue edema is a key indicator of inflammation in soft tissues, and its presence is a common feature in clinically significant inflammation. In CMR imaging, the increased water content from edema leads to prolonged T1 and, more notably, T2 relaxation times in the myocardium. Edema is visible as regional or global signal hyperintensity on T2-weighted images, and T2 mapping can directly measure the water-induced prolongation of T2 relaxation time. Although T1 relaxation time also increases due to edema, it is less specific for active inflammation, as it can also occur in fibrotic areas where free water accumulates. Additionally, myocardial edema can result from venous congestion, such as in cases of acute decompensated heart failure.
In addition to increased free water content, inflammation also causes hyperemia, increased vascular permeability, and an expansion of the extracellular space. CMR techniques that target these changes include T1-weighted spin echo images taken before and shortly after (early gadolinium enhancement, EGE) administering an extracellular gadolinium-based contrast agent (GBCA). Since gadolinium acts as an extracellular contrast agent, its distribution volume increases in inflamed tissue, leading to greater contrast enhancement compared to noninflamed myocardium. However, it remains uncertain whether this enhancement specifically reflects hyperemia or merely indicates the expansion of the extracellular space.
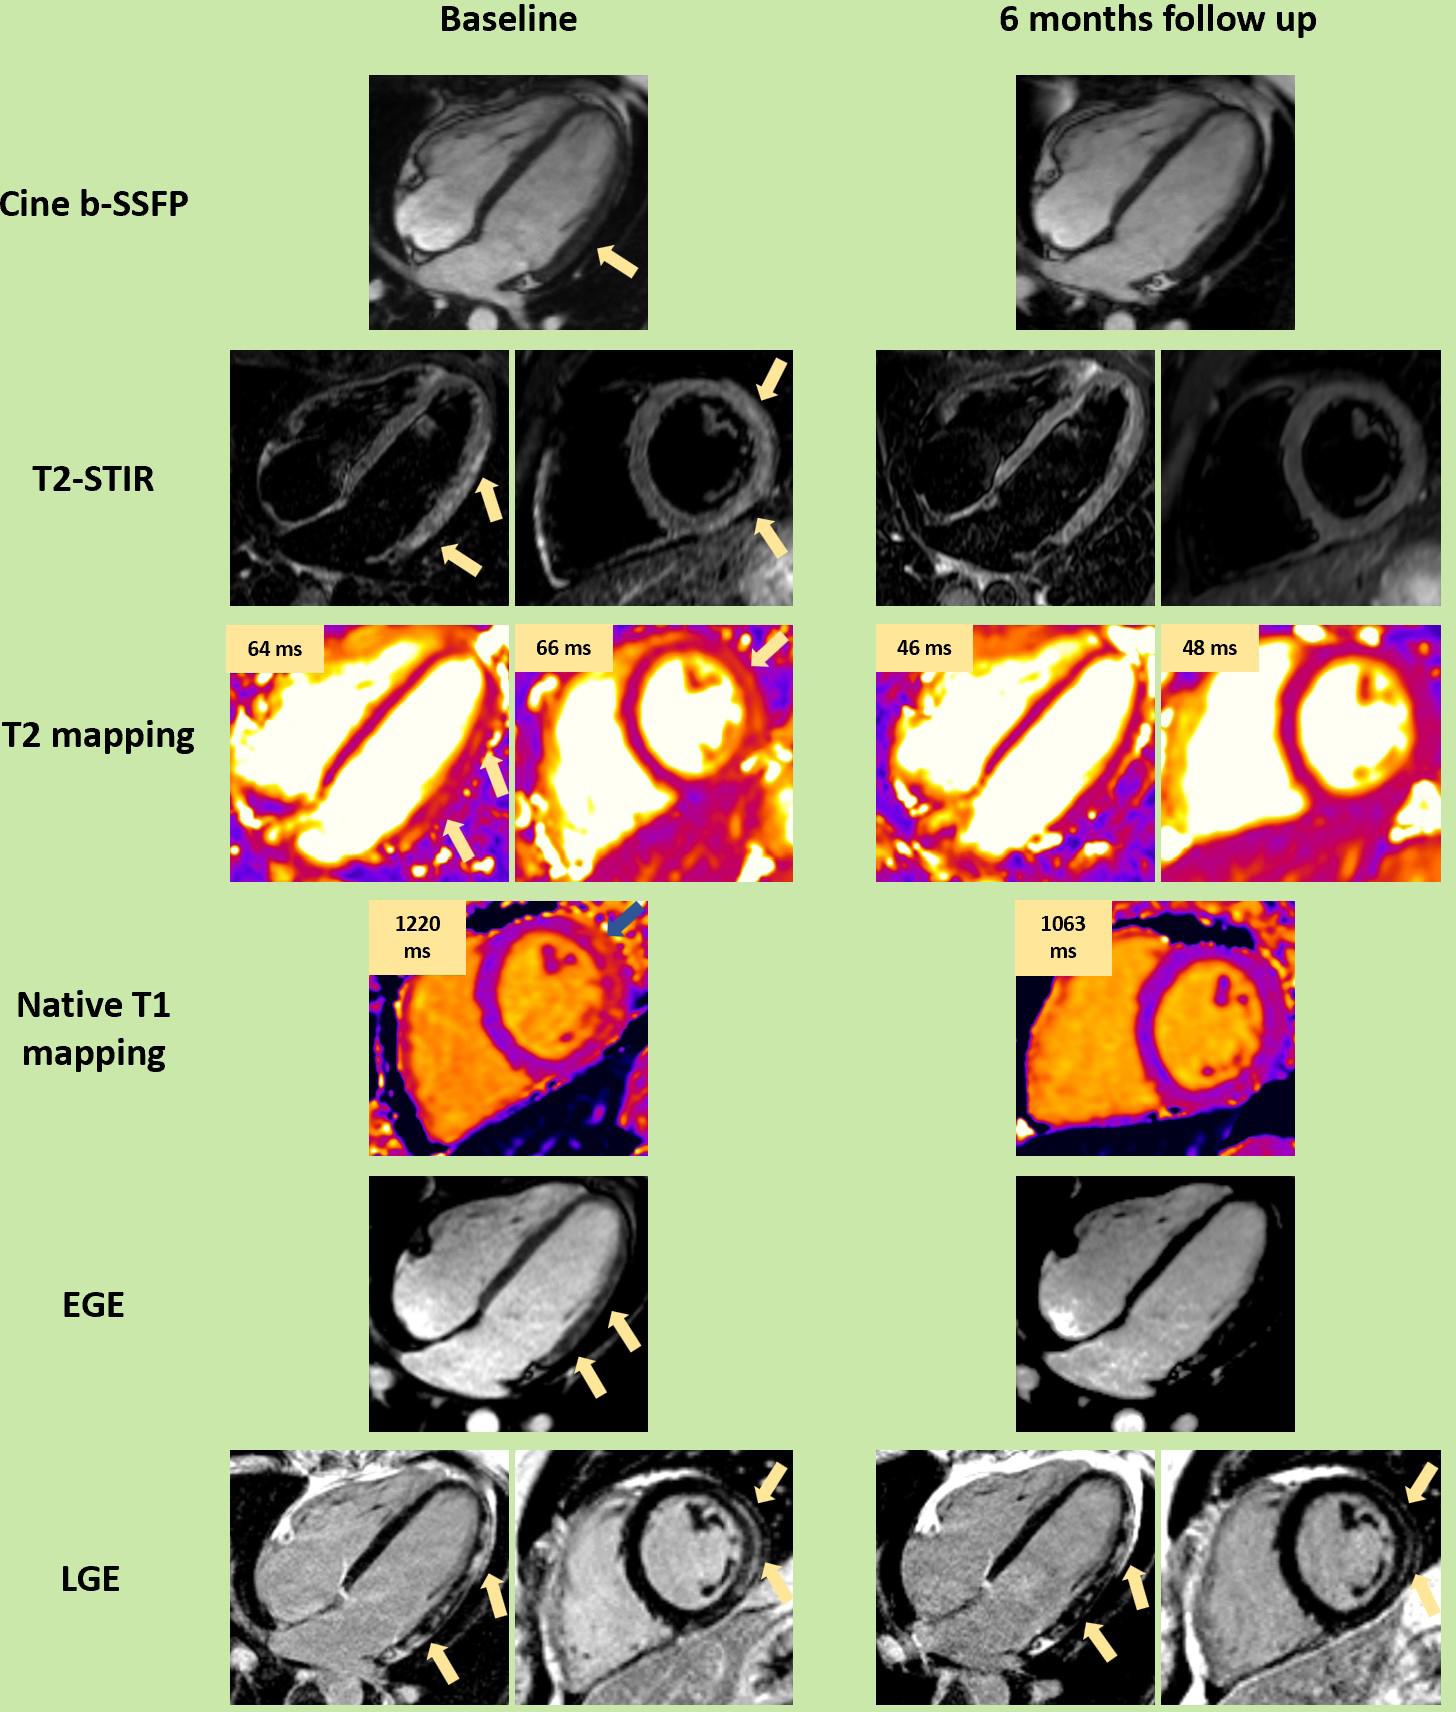
When inflammation becomes severe enough to cause myocyte injury, leading to necrosis, fibrosis, and scarring, there is a significant increase in the volume of distribution for GBCA, as the contrast agent infiltrates the intracellular space of damaged or nonviable myocytes. Late gadolinium enhancement (LGE) imaging has revealed common patterns of such injuries, making it a crucial tool for identifying the “signature pattern” of nonischemic inflammatory injury and distinguishing it from other myocardial diseases. Myocarditis lesions typically appear patchy, subepicardial, and midwall, often affecting the basal to mid-inferolateral walls, unlike ischemic lesions that involve the subendocardium. However, in severe cases, these high-signal intensity regions can extend to the subendocardium, becoming transmural. It is crucial to distinguish these lesions from the epicardial fat which can be frequently seen near the basal lateral wall (Figure 2).
Contrast-enhanced cardiac magnetic resonance imaging of a patient with dilated cardiomyopathy and heart failure revealing trace circumferential pericardial effusion and a small area of epicardial fat adjacent to the basal inferior and inferolateral walls, with high signal intensity on the LGE-PSIR sequences. b-SSFP (balanced steady-state free precession), LGE (late gadolinium enhancement).
Dysfunction, a hallmark of inflammation, is present in myocarditis but can be localized, with unaffected surrounding myocardium compensating by increasing contractility, making the dysfunction less noticeable. Severe injury often affects the subepicardial layer, leaving other layers’ contraction intact. Wall motion abnormalities can result from various conditions, and the ejection fraction may remain normal even with significant T2 or LGE abnormalities. Therefore, ventricular dysfunction is neither highly sensitive nor specific for detecting myocardial inflammation. However, a recent and rapid decline in ventricular function, when non-inflammatory causes are excluded, could suggest myocarditis. Overall, functional abnormalities support but do not definitively indicate myocardial inflammation.
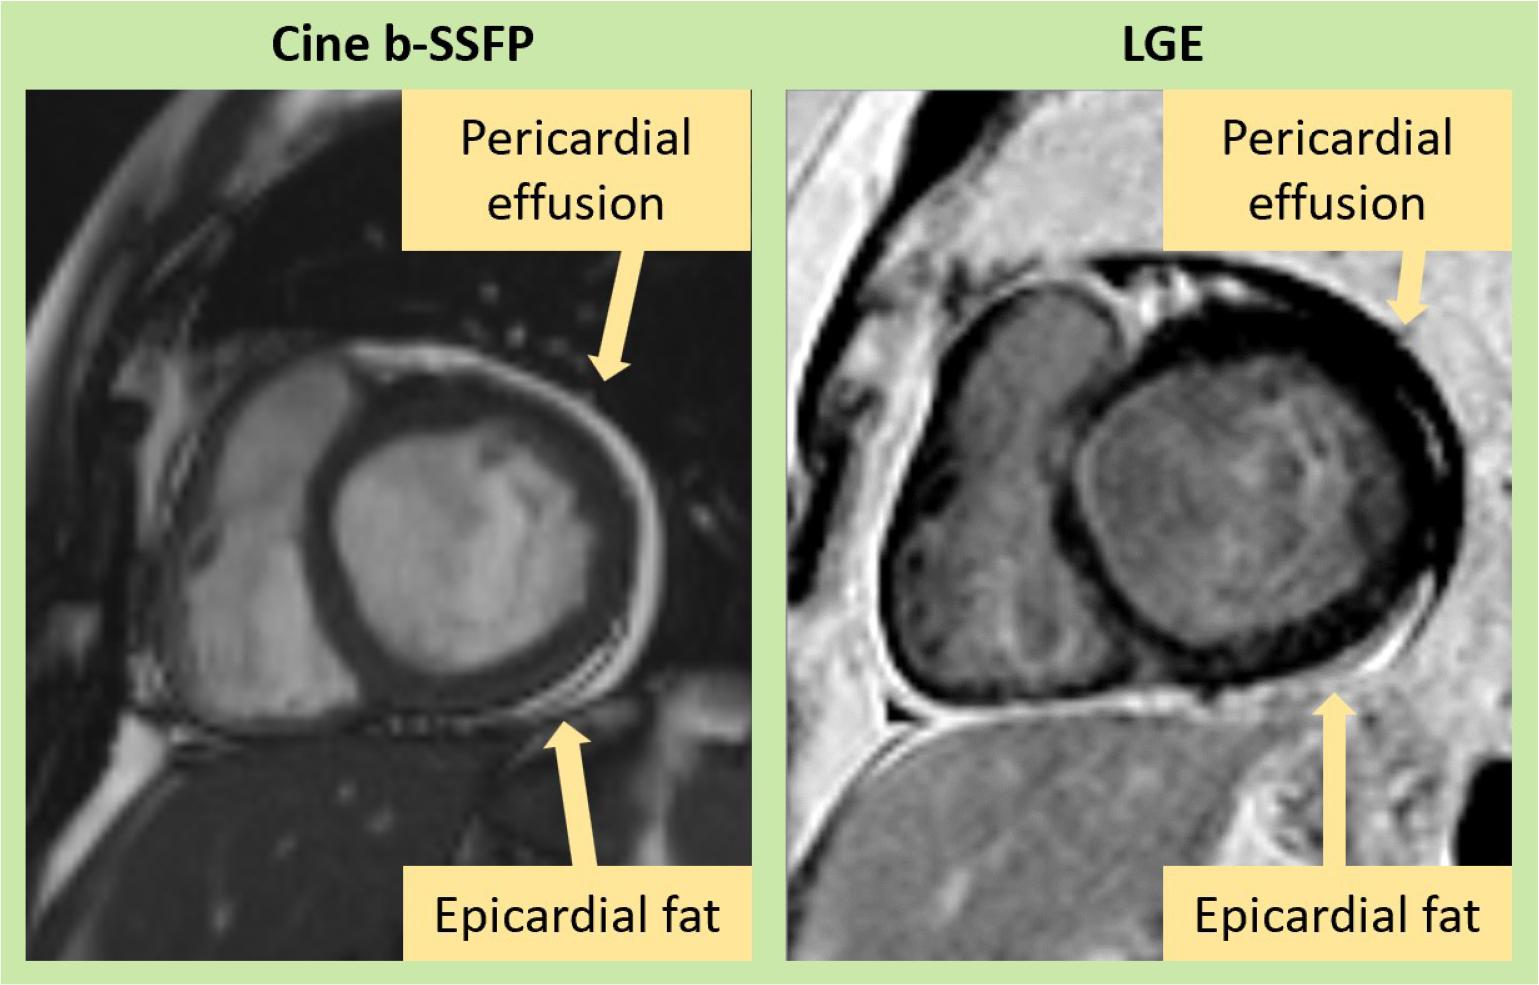
Myocardial inflammation can often be linked to pericardial involvement, and the reverse is also true. However, the presence of pericardial effusion alone isn’t definitive proof of pericarditis, as it could simply indicate coexisting heart failure. Active pericardial inflammation is more likely when there is thickening of the pericardial layers seen on high-resolution fast spin echo T1 images, hyperintensity on T2-weighted images, T2 or T1 mapping, or abnormal pericardial LGE (Figure 3). These pericardial abnormalities, when present, serve as supportive criteria for diagnosing inflammation.
Contrast-enhanced cardiac magnetic resonance imaging of a patient with acute pericarditis showing significant thickening of the pericardial leaflets on Cine sequences (yellow arrows), high signal intensity on T2-weighted sequences (yellow arrows), and pericardial hyperenhancement on the LGE sequences (yellow arrows). This is associated with a trace pericardial effusion, which appears as low signal intensity between the two pericardial leaflets (blue arrows). b-SSFP (balanced steady-state free precession), LGE (late gadolinium enhancement).
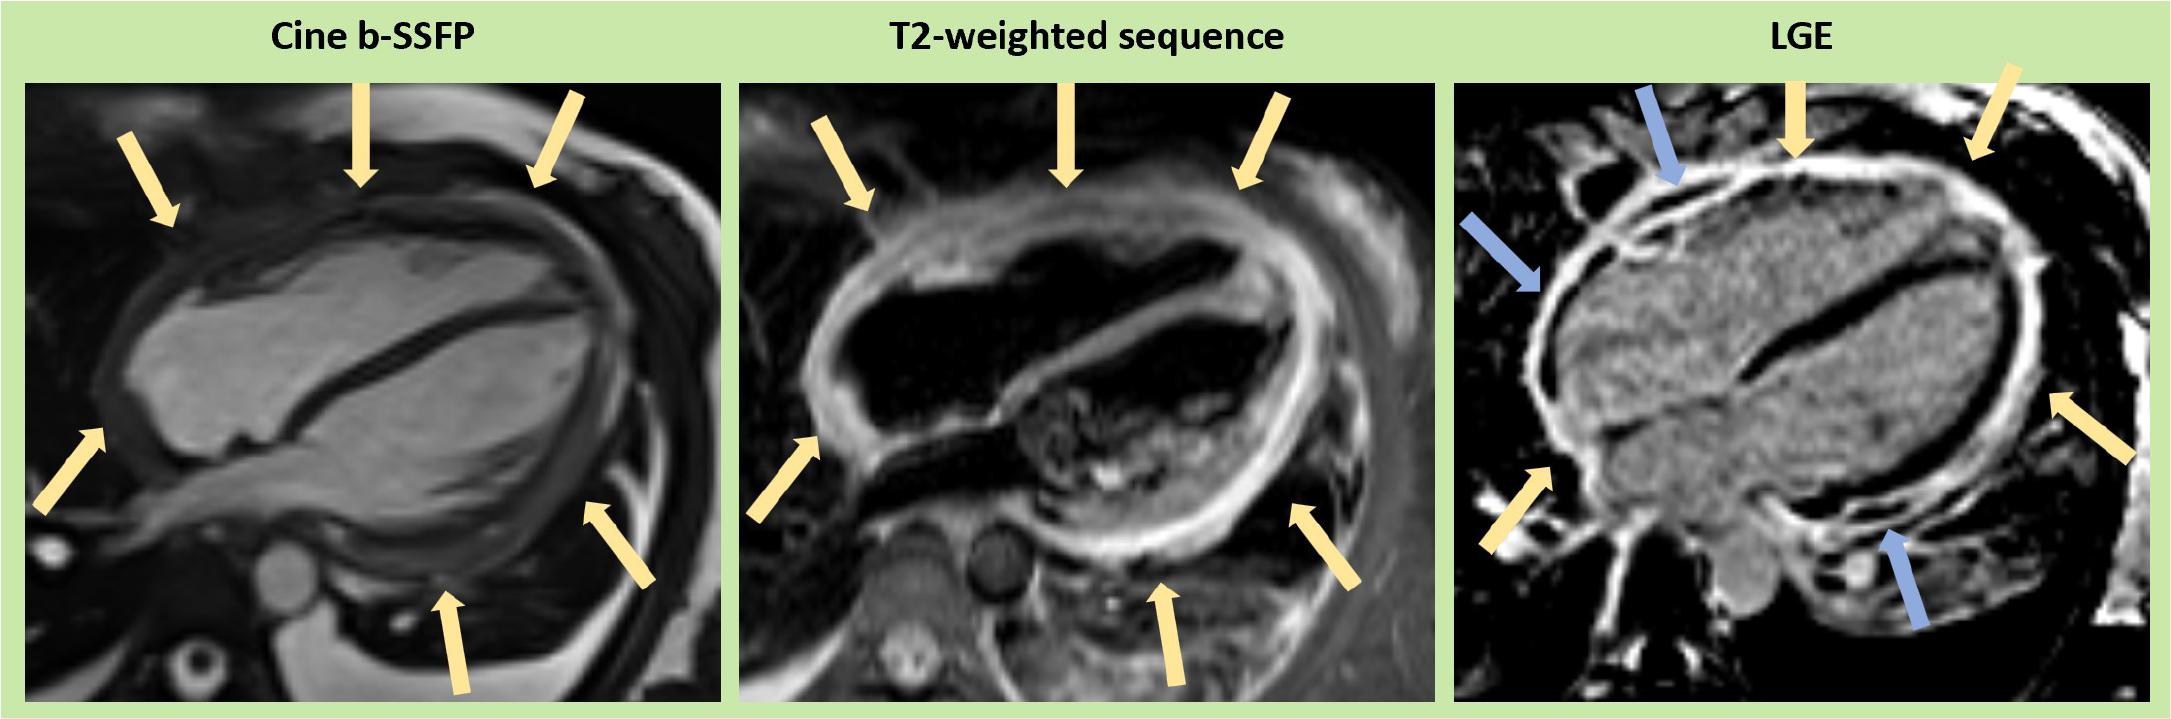
Beyond typical viral myocarditis, myocardial inflammation can arise from diverse etiologies, including autoimmune diseases, hypersensitivity reactions, infiltrative disorders, and acute ischemic events (Figure 4). Autoimmune conditions such as systemic lupus erythematosus, rheumatoid arthritis, and sarcoidosis often involve the myocardium due to immune-mediated inflammation. Hypersensitivity myocarditis, triggered by drugs (e.g., antibiotics, chemotherapy agents) or toxins, typically presents with eosinophilic infiltration on histopathology. Infiltrative cardiomyopathies like amyloidosis or hemochromatosis can also provoke inflammatory responses due to the deposition of abnormal proteins or iron within the myocardium. Additionally, acute ischemic myocardial injury, often secondary to coronary artery occlusion or microvascular dysfunction, may result in inflammation of the peri-infarct region, mimicking or compounding other inflammatory conditions. Non-infectious myocarditis, such as idiopathic giant cell myocarditis, is characterized by a fulminant inflammatory response often requiring prompt immunosuppressive therapy. CMR plays a crucial role in distinguishing these etiologies, using advanced tissue characterization techniques to differentiate among inflammation, fibrosis, ischemia, and infiltrative processes.
Contrast-enhanced cardiac magnetic resonance imaging (CMR) of four patients with myocardial inflammation. First row: A 15-year-old patient presenting with chest pain and elevated serum troponin levels. Cine (b-SSFP) sequences in 4-chamber (native, A) and short axis at the papillary muscle level (post-contrast, B) views during diastole revealed a nondilated LV with normal systolic function. T2w-STIR sequences (4-chamber, C; short axis, D) show patchy, near-circumferential high signal intensity (yellow arrows) corresponding to elevated T2 on T2 mapping (E, F) and elevated T1 on T1 mapping (G, H). Post-contrast imaging reveals extensive circumferential epicardial LGE, especially in the basal and mid-segments (I, J). A follow-up scan at 6 months showed complete resolution of myocardial edema but persistent LGE. Genetic testing identified a pathogenic variant in the desmoplakin (DSP) gene. Second row: A 46-year-old patient presenting with acute decompensated heart failure. Cine (b-SSFP) sequences (4-chamber native, A; short axis post-contrast, B) during systole and diastole, respectively, revealed biventricular hypertrophy, moderate systolic dysfunction, and some pericardial fluid. T2w-STIR sequences (C, D) showed no areas of high signal intensity, but parametric mapping revealed globally elevated native T2 (E, F) and T1 (G, H), particularly in the septum. Diffuse transmural LGE with abnormal gadolinium kinetics were noted (I, J), suggestive of cardiac amyloidosis. Third row: A 52-year-old patient with risk factors presenting with chest pain, ST-segment elevation, and elevated serum troponin. Emergency coronary angiography revealed normal coronary arteries. CMR cine (b-SSFP) sequences in 2-chamber (A, B) and short-axis views (C, D) during diastole and systole show akinesia in the mid-anterior wall (yellow arrows). T2 mapping reveals elevated T2 in the mid-anterior and anterolateral walls on short axis (F) and 4-chamber views (E), corresponding to elevated T1 in the same regions (G, H, blue arrows). Transmural ischemic LGE is seen in the mid-anterior and anterolateral walls (I, J, yellow arrows), with dense microvascular obstruction in the subendocardial area (blue arrows), characteristic of acute myocardial infarction. After a closer review of the coronary angiography, a proximal occlusion of the first diagonal branch was identified. Fourth row: A 27-year-old patient presenting with an electrical storm. After stabilization, CMR was performed. Cine (b-SSFP) sequences in the 4-chamber (A) and short-axis views (B) during diastole revealed normal biventricular size and function but focal LV hypertrophy in the basal anterolateral wall (yellow arrow). High signal intensity is noted on T2w-STIR sequences (C, D, yellow arrows), corresponding to elevated T2 (E, F) and T1 (G, H) on parametric mapping. Extensive patchy LGE is present in multiple LV segments (I, J), predominantly in the basal-to-mid anterior wall (yellow arrows) and extending to the RV free wall (blue arrows), creating a characteristic “shepherd’s crook” appearance at the RV insertion point. These findings strongly suggest cardiac sarcoidosis, confirmed by 18-F FDG PET scan and endomyocardial biopsy. b-SSFP (balanced steady-state free precession), CMR (cardiac magnetic resonance), EGE (early gadolinium enhancement), LGE (late gadolinium enhancement), LV (left ventricle), STIR (Short Tau Inversion Recovery), RV (right ventricle).
In 2009, the Lake Louise Criteria were established as a consensus for using Cardiovascular Magnetic Resonance (CMR) to diagnose myocardial inflammation [3]. These criteria focused on three key diagnostic targets in myocardial tissue: edema, hyperemia, and necrosis or scarring, assessed through T2-weighted, EGE, and LGE CMR images. A diagnosis of acute myocarditis was suggested when two out of these three criteria were met (Table 1), with an initial diagnostic accuracy of 78% (67% sensitivity and 91% specificity). Over time, these criteria have been widely used and validated, with recent meta-analyses confirming their effectiveness, reporting good diagnostic accuracy.
Updated recommendations of CMR criteria of myocardial inflammation. ECV (extracellular volume), EGE (early gadolinium enhancement), LGE (late gadolinium enhancement), LV (left ventricle), SI (signal intensity)
| Original Lake Louise Criteria (Any 2 out of 3) | Updated Lake Louise Criteria (2 out of 2) | Diagnostic Targets |
| Main criteria | T2-based imaging | Myocardial edema |
| EGE | T2 relaxation time | ↑T1 – edema, hyperemia/capillary leak, necrosis, fibrosis |
| Supportive criteria | Pericardial effusion in cine images or | Pericardial inflammation |
However, CMR tissue characterization based on signal intensities has limitations. As inflammation becomes more diffuse, especially as myocarditis progresses from acute to subacute, T2 and EGE signals may become more uniform, making it harder to detect specific lesions. Diffuse changes may still be identified by increased global signal intensity ratios, but coexisting conditions like skeletal muscle inflammation or noninflammatory cardiomyopathies can lead to false negatives or misinterpretations. Advances in mapping T1 and T2 relaxation times have shown promise, prompting a reevaluation of the Lake Louise Criteria based on current evidence.
Diagnostic accuracy for detecting acute myocardial inflammation can be significantly enhanced by combining edema-sensitive CMR (such as T2-weighted images or T2 mapping) with at least one additional T1-based tissue characterization technique [4]. Based on current clinical evidence, the 2018 Consensus Group recommends that in patients with a high clinical pre-test probability, a CMR scan strongly suggests acute myocardial inflammation if there is at least one positive criterion in each of the following two categories: a T2-based marker for myocardial edema and a T1-based marker for associated myocardial injury (Table 1).
Since edema is a key feature of acute or active inflammation, detecting a specific marker for edema – whether through T2-weighted images or T2 mapping – is crucial. T2 mapping is a reliable method for identifying myocardial edema and can serve as an alternative to T2-weighted CMR images.
LGE is effective in detecting acute myocyte necrosis, focal fibrosis, scarring, and some degree of acute extracellular edema. Native T1 relaxation time is prolonged by various factors, including intracellular or extracellular edema, hyperemia, capillary leak, and areas of myocyte necrosis and fibrosis. Similarly, the extracellular volume (ECV) may expand due to extracellular edema, hyperemia, capillary leak, and in necrotic or fibrotic regions.
In conclusion, current evidence supports using CMR as a noninvasive tool to detect acute myocardial inflammation. In evaluating a patient with suspected myocarditis, having both a positive T2-based marker and a T1-based marker increases the specificity of diagnosing acute myocardial inflammation. A diagnosis may still be supported by the presence of just one of these markers in the appropriate clinical context, though with reduced specificity.