
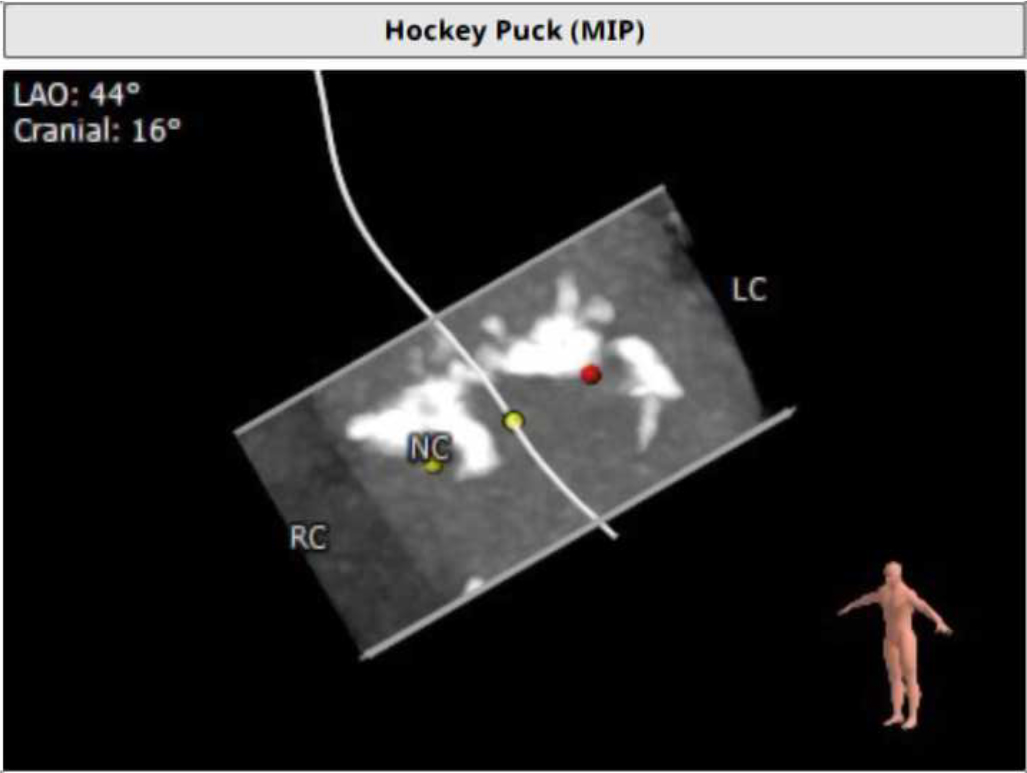
Figure 1
Hockey puck view that enhances aortic valve calcifications.
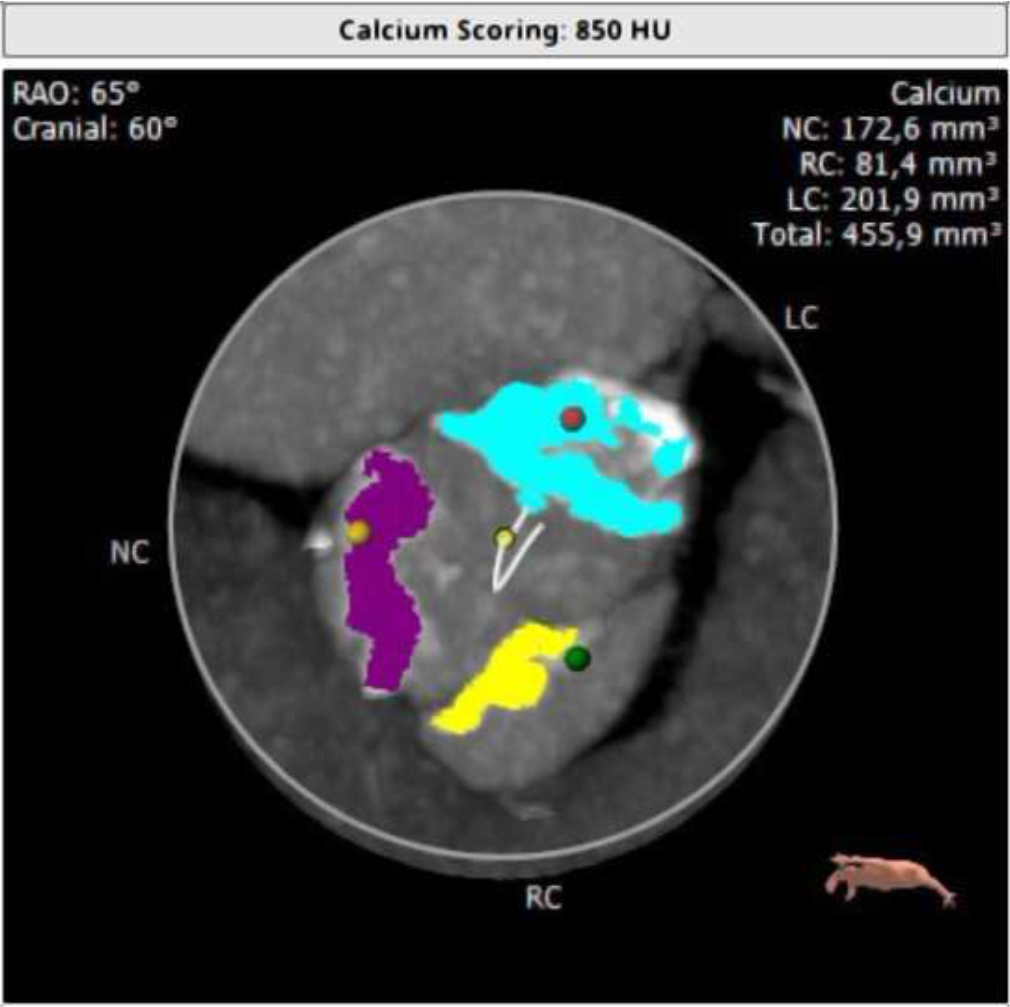
Figure 2
Distribution of aortic valve calcification with volume quantification (3mensio evaluation on contrast-enhanced CT). The total calcium volume was 455.9 mm3 using a threshold of 850 HU, with prevalence of calcium on left coronary cusp (201.9 mm3) and noncoronary cusp (172.6 mm3).
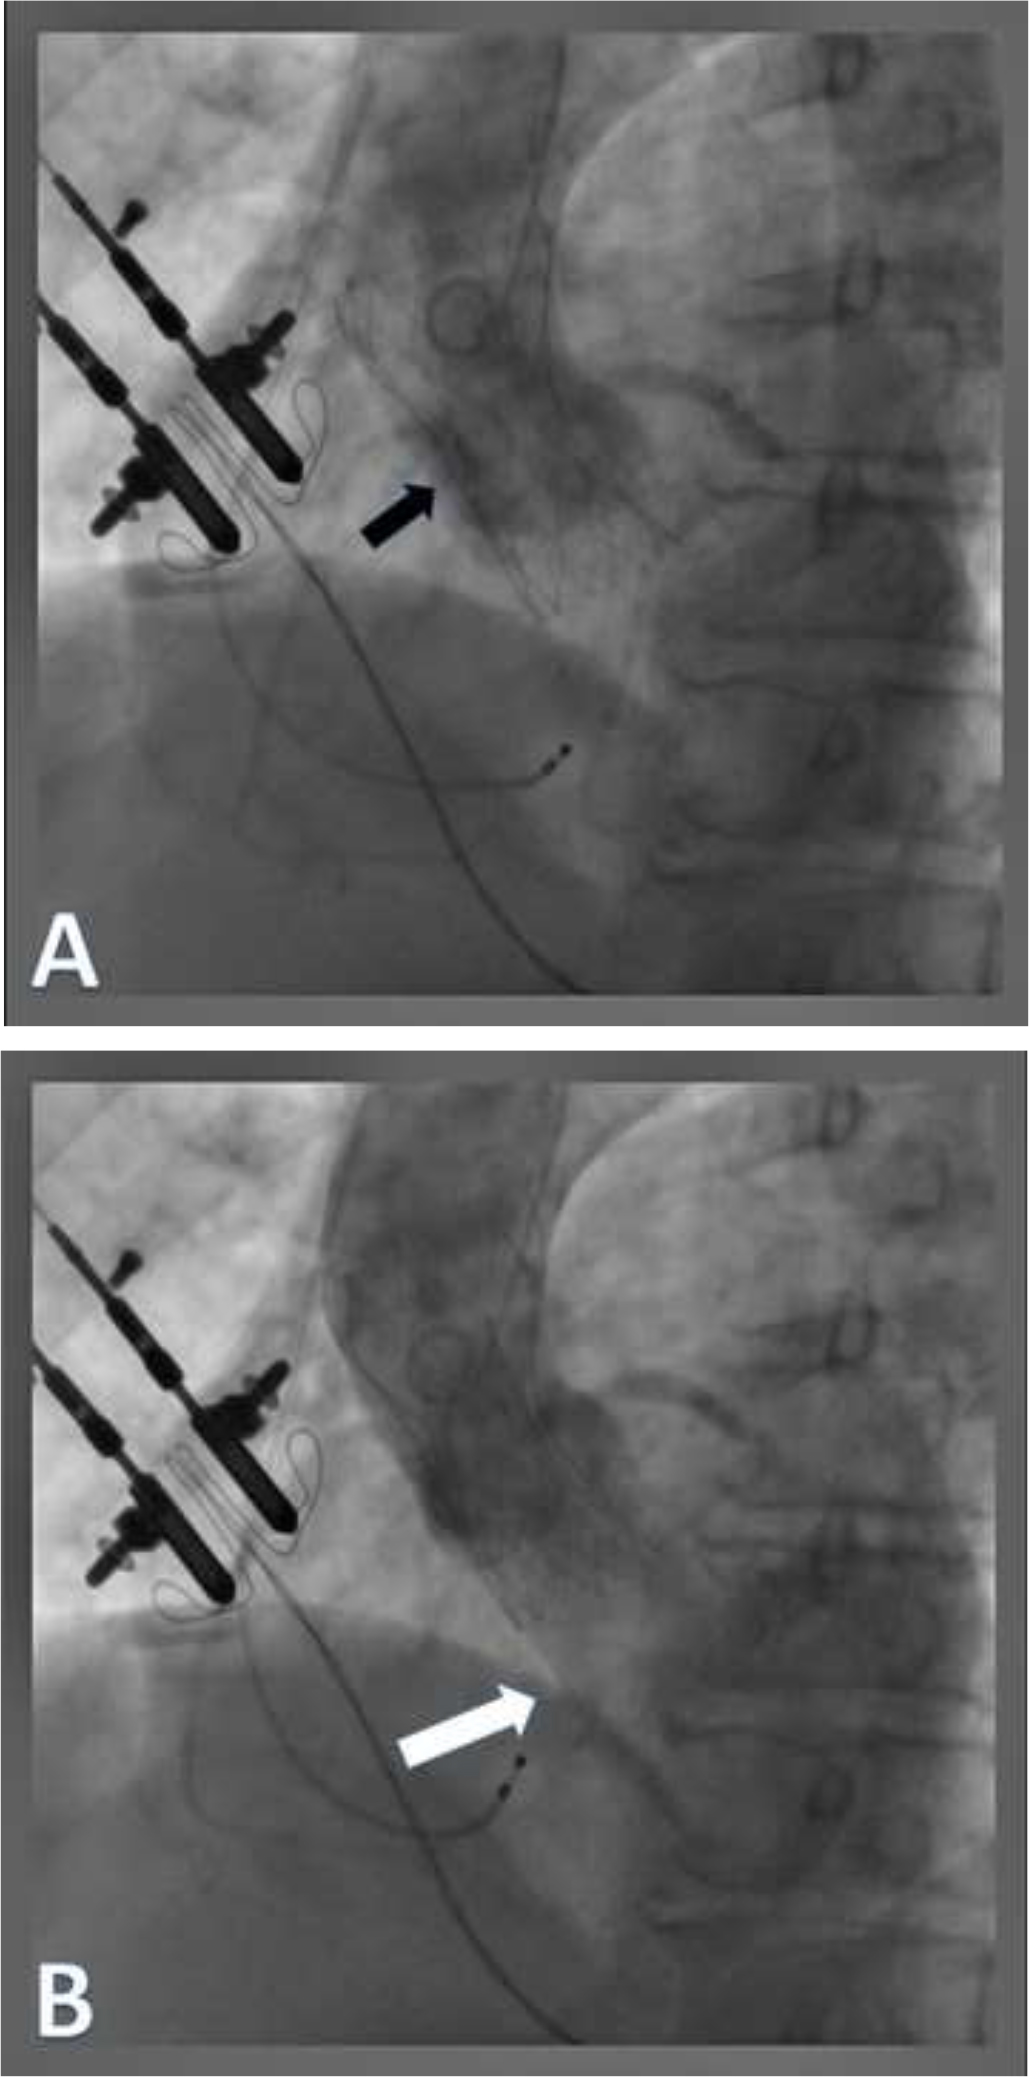
Figure 3
Angiographic view after implantation of Portico aortic valve bioprosthesis (black arrow). A: Systolic frame. B: Diastolic frame showing severe (grade 4) central aortic regurgitation (white arrow).
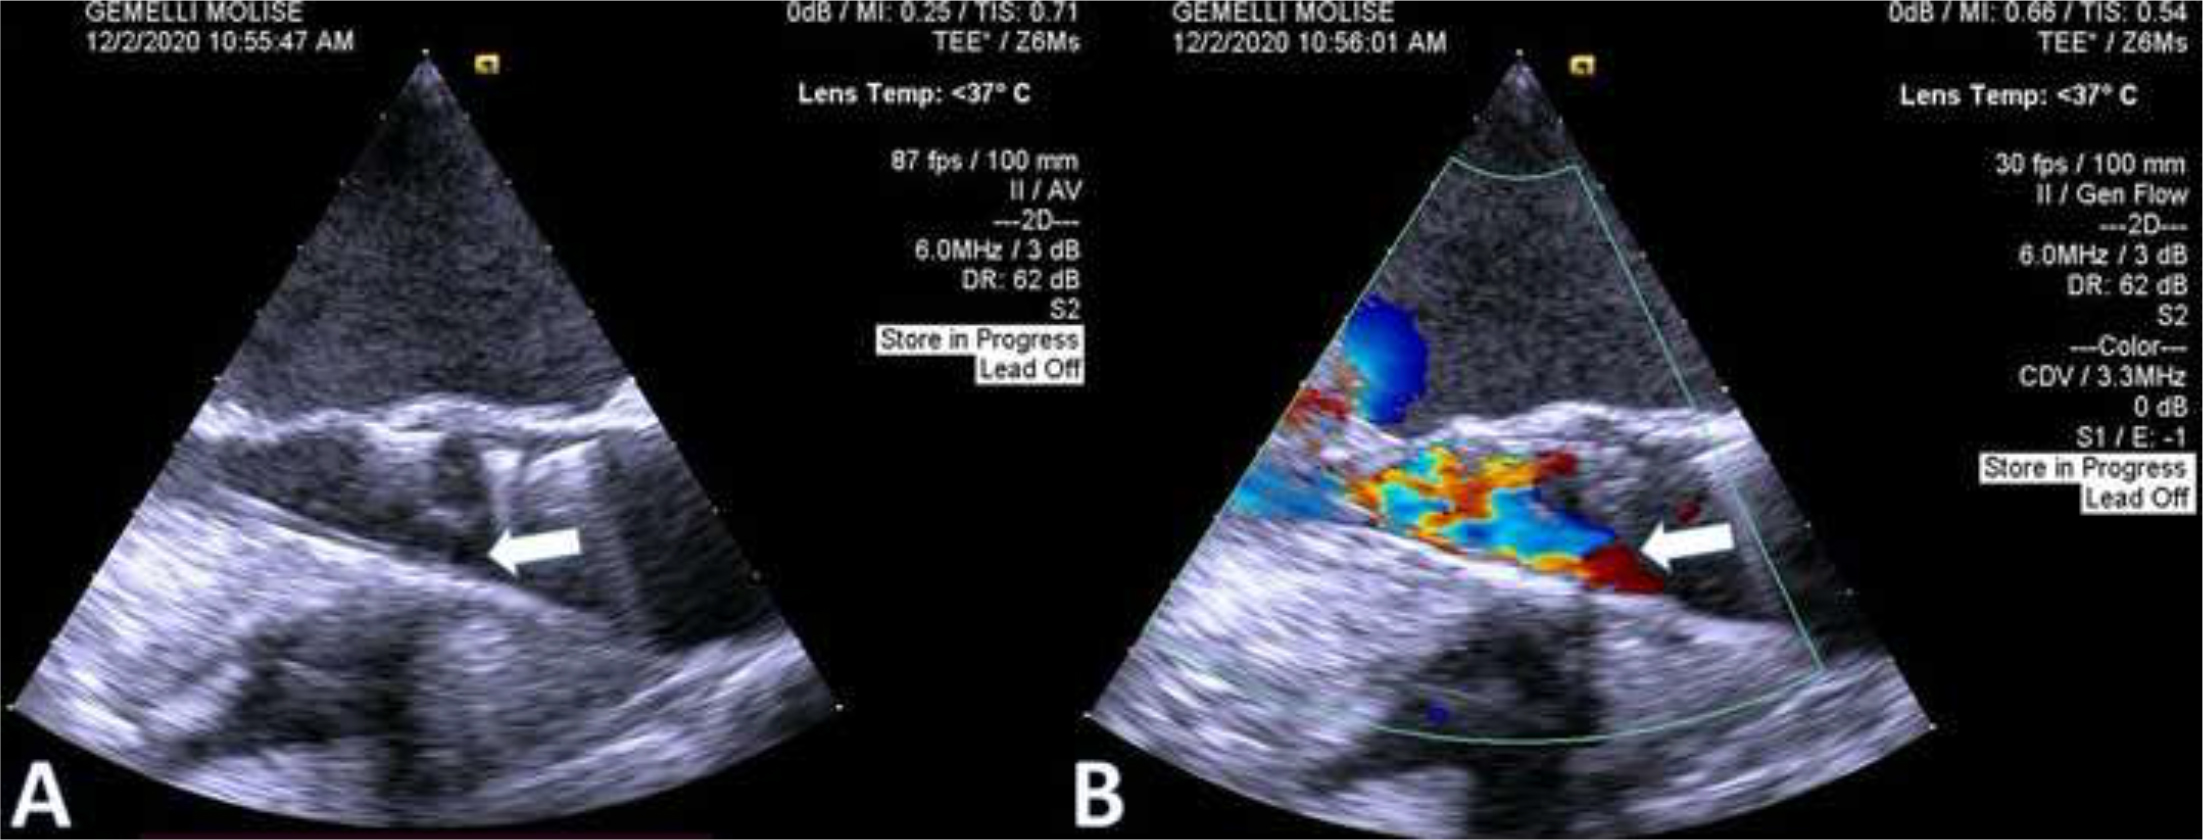
Figure 4
Transesophageal echocardiography LVOT view. A: 2D echo showing stuck leaflet (leaflet not visible in picture, white arrow) in anterior position. B: 2D color showing severe intraprosthetic regurgitation.