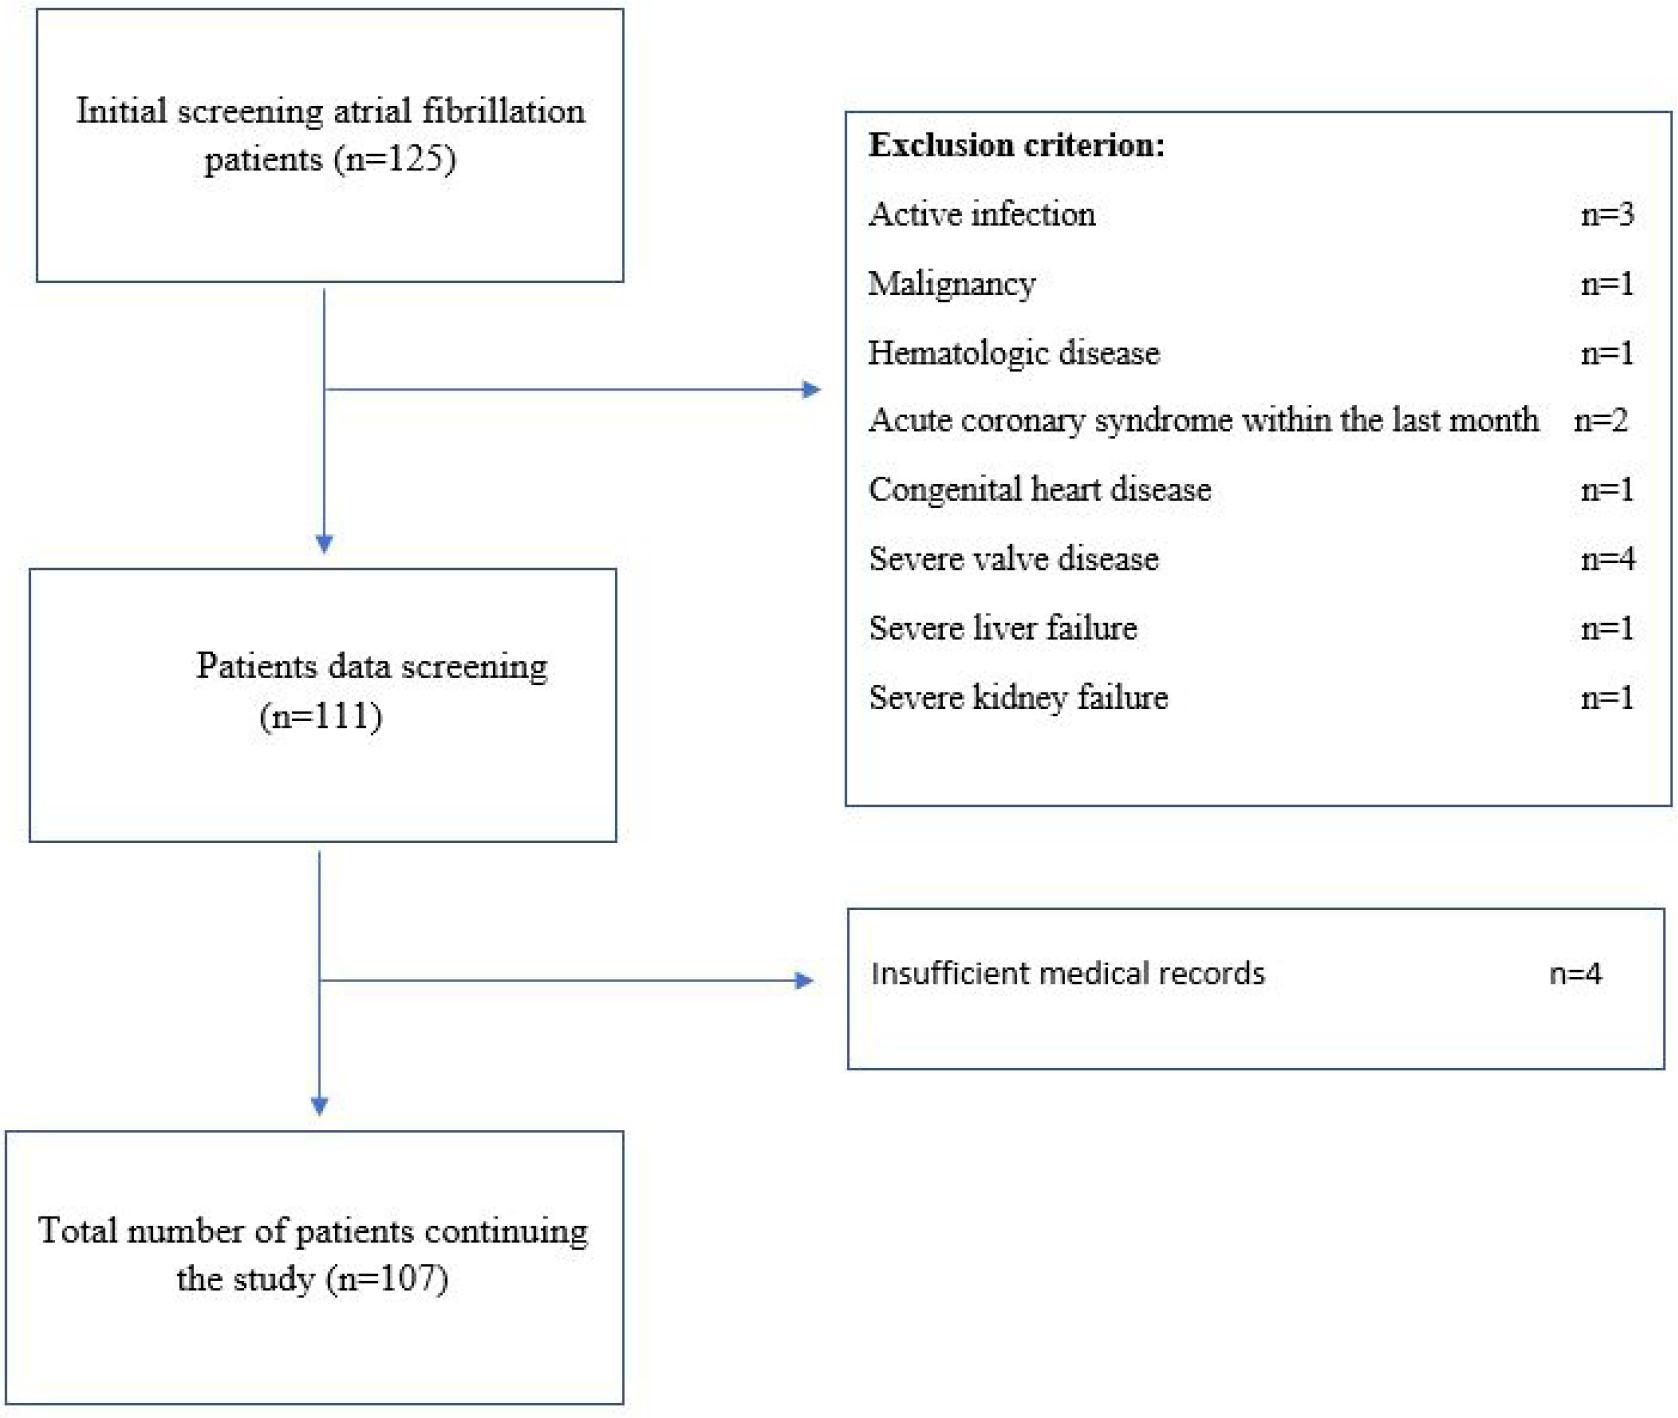
Figure 1
Relationship between demographic and laboratory findings and cardioversion success
| Variables | Successful CV (n = 64) | Unsuccessful CV(n = 43) | p-value |
|---|---|---|---|
| Age, years | 65.5 ± 11.3 | 62.9 ± 13.6 | NS |
| Gender (%) | |||
| Male | 54.7 | 46.5 | NS |
| Female | 45.3 | 53.5 | |
| Hypertension (%) | 78.1 | 74.4 | NS |
| Diabetes mellitus (%) | 25 | 23.3 | |
| -- Metformin | 25 | 23.3 | NS |
| -- Metformin+Sulfonylurea | 9.3 | 9.3 | |
| WBC (′109/L) | 10.7 ± 10.7 | 8.9 ± 2.6 | NS |
| Hemoglobin, g/dl | 13.5 ± 1.9 | 13.5 ± 2.2 | NS |
| PLT (′109/L) | 264 ± 60 | 241 ± 77 | NS |
| GFR | 78 ± 27 | 79 ± 24 | NS |
| Urea, mg/dl | 38.8 ± 15.4 | 39 ± 13.9 | NS |
| Creatinine, mg/dl | 1.0 ± 0.2 | 1.0 ± 0.3 | NS |
| Albumin | 4.1 ± 0.3 | 3.7 ± 0.5 | NS |
| TSH, mU/L | 2.2 ± 1.8 | 2.8 ± 2.5 | NS |
| SGOT, U/L | 20.7 ± 7.9 | 22.7 ± 15.6 | NS |
| SGPT, U/L | 22.3 ± 13.1 | 32.6 ± 55.8 | NS |
| Pre-procedural LGI | 1.2 ± 1.2 | 1.07 ± 0.3 | NS |
| Post-procedural LGI | 0.92 ± 0.41 | 1 ± 0.9 | NS |
| Fibrosis-4 index | 1.2 ± 0.5 | 1.5 ± 1.2 | NS |
| SII | 735 ± 409 | 840 ± 757 | NS |
Relationship between echocardiography findings and cardioversion success
| Variables | Successful CV (n = 64) | Unsuccessful CV(n = 43) | p-value |
|---|---|---|---|
| Ejection fraction (EF) | 53.1 ± 8.5 | 56.3 ± 7.7 | NS |
| End diastolic diameter (EDD) | 48.7 ± 4.5 | 48.1 ± 5.4 | NS |
| End systolic diameter (ESD) | 29.8 ± 5.1 | 29.8 ± 6.5 | NS |
| Left atrium (LA) | 41.9 ± 5 | 40.6 ± 5.6 | NS |
| Systolic pulmonary artery pressure (sPAP) | 36.8 ± 10.5 | 38 ± 11.5 | NS |
| Mitral stenosis | 3 (4.7) | 3 (7) | NS |
| Mitral insufficiency | 12 (18.8) | 6 (14) | NS |
| Heart rate | 97.9 ± 28.1 | 89.7 ± 22.5 | NS |