Figure 1
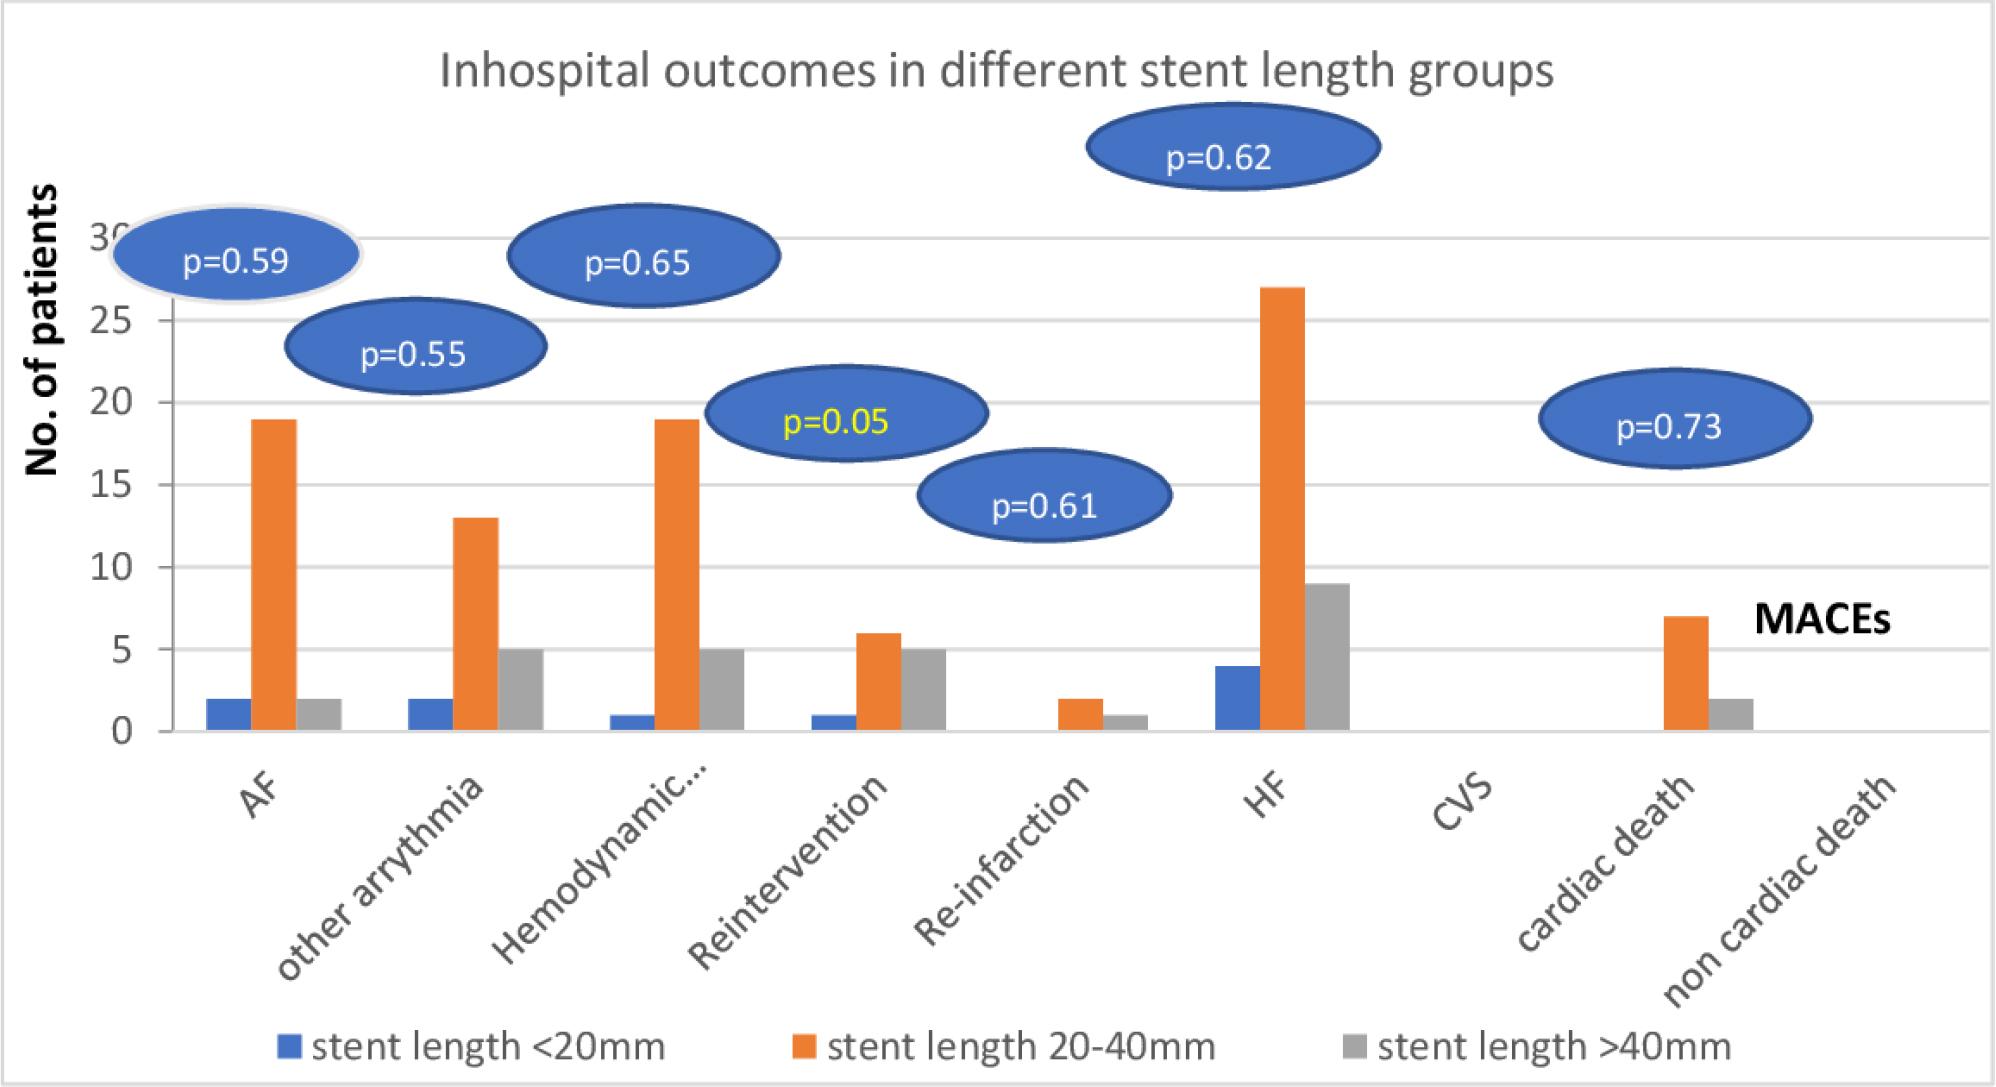
Figure 2
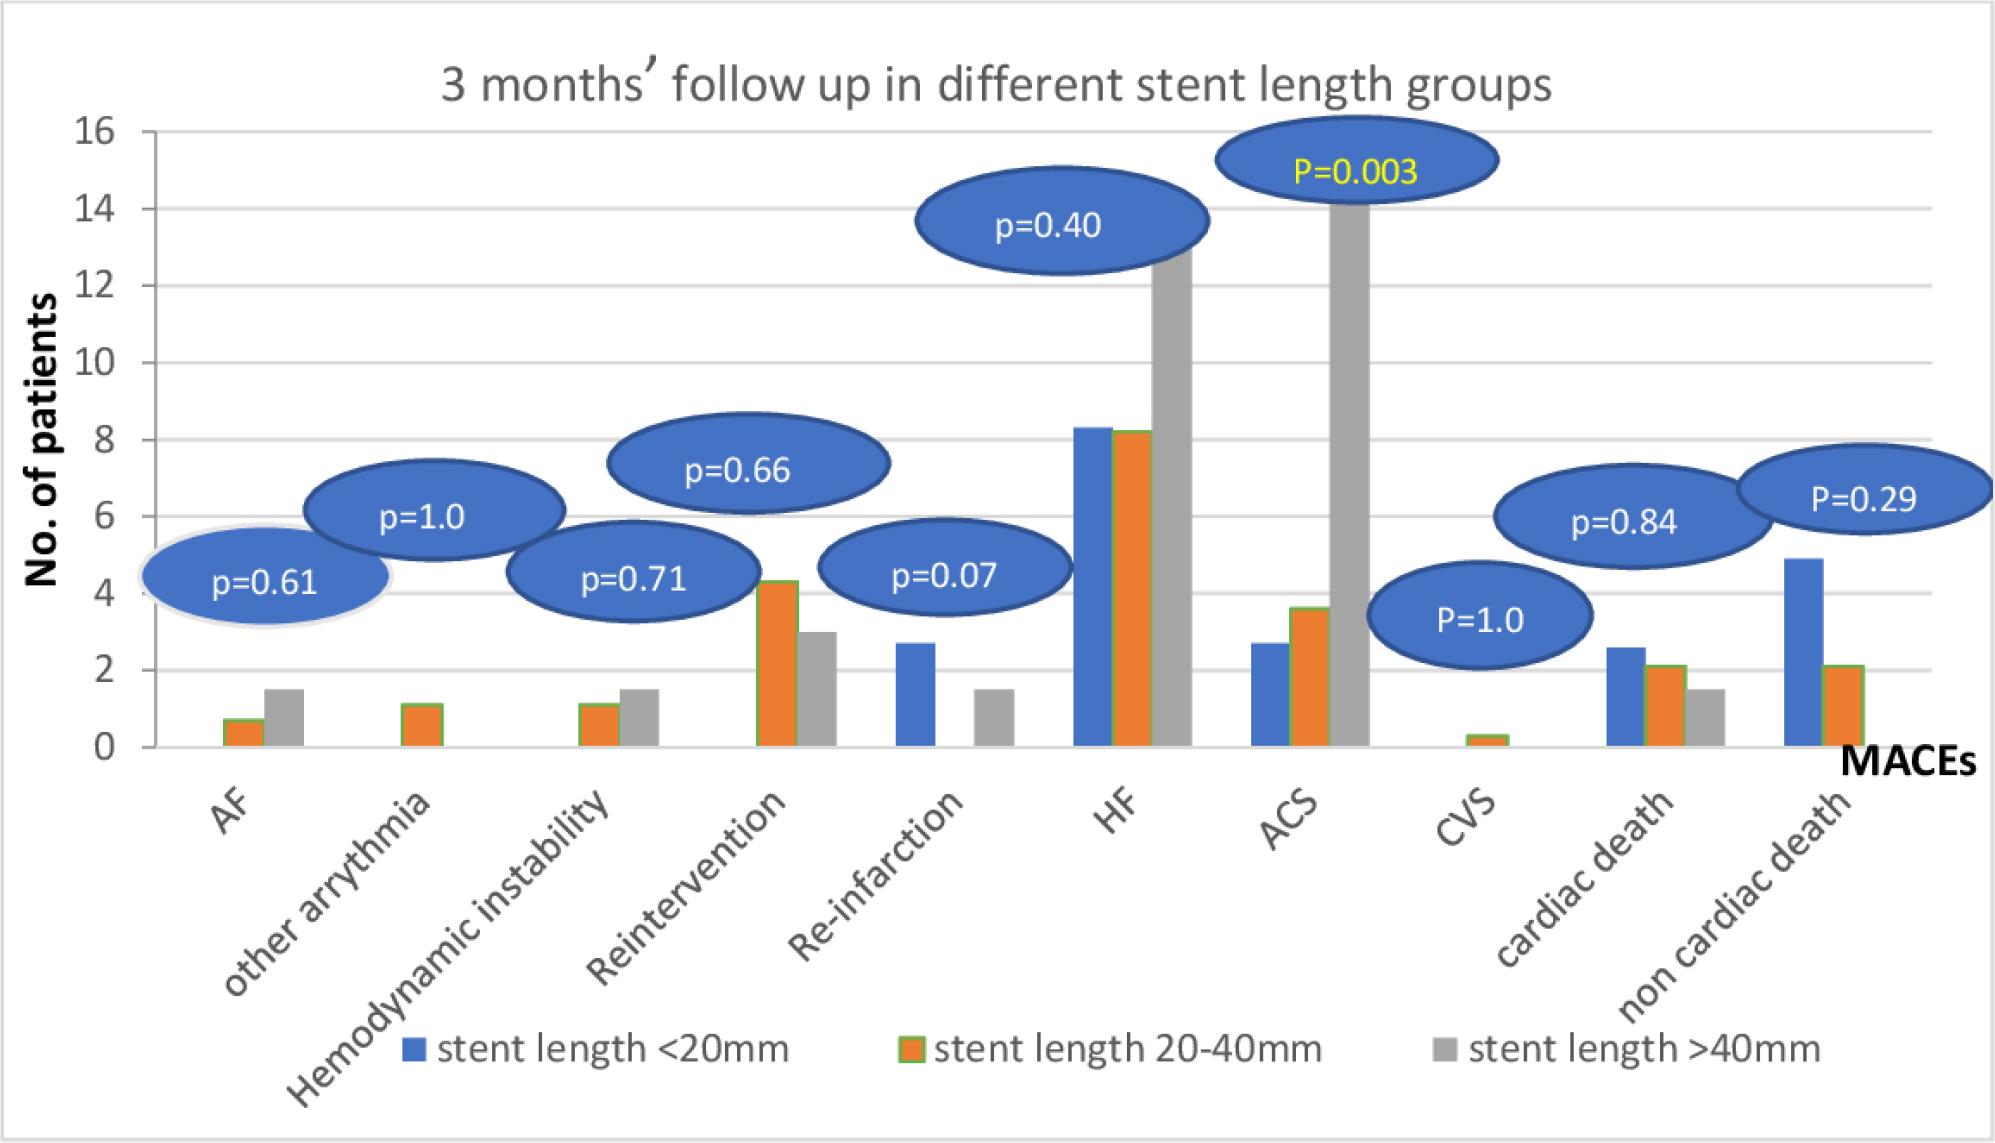
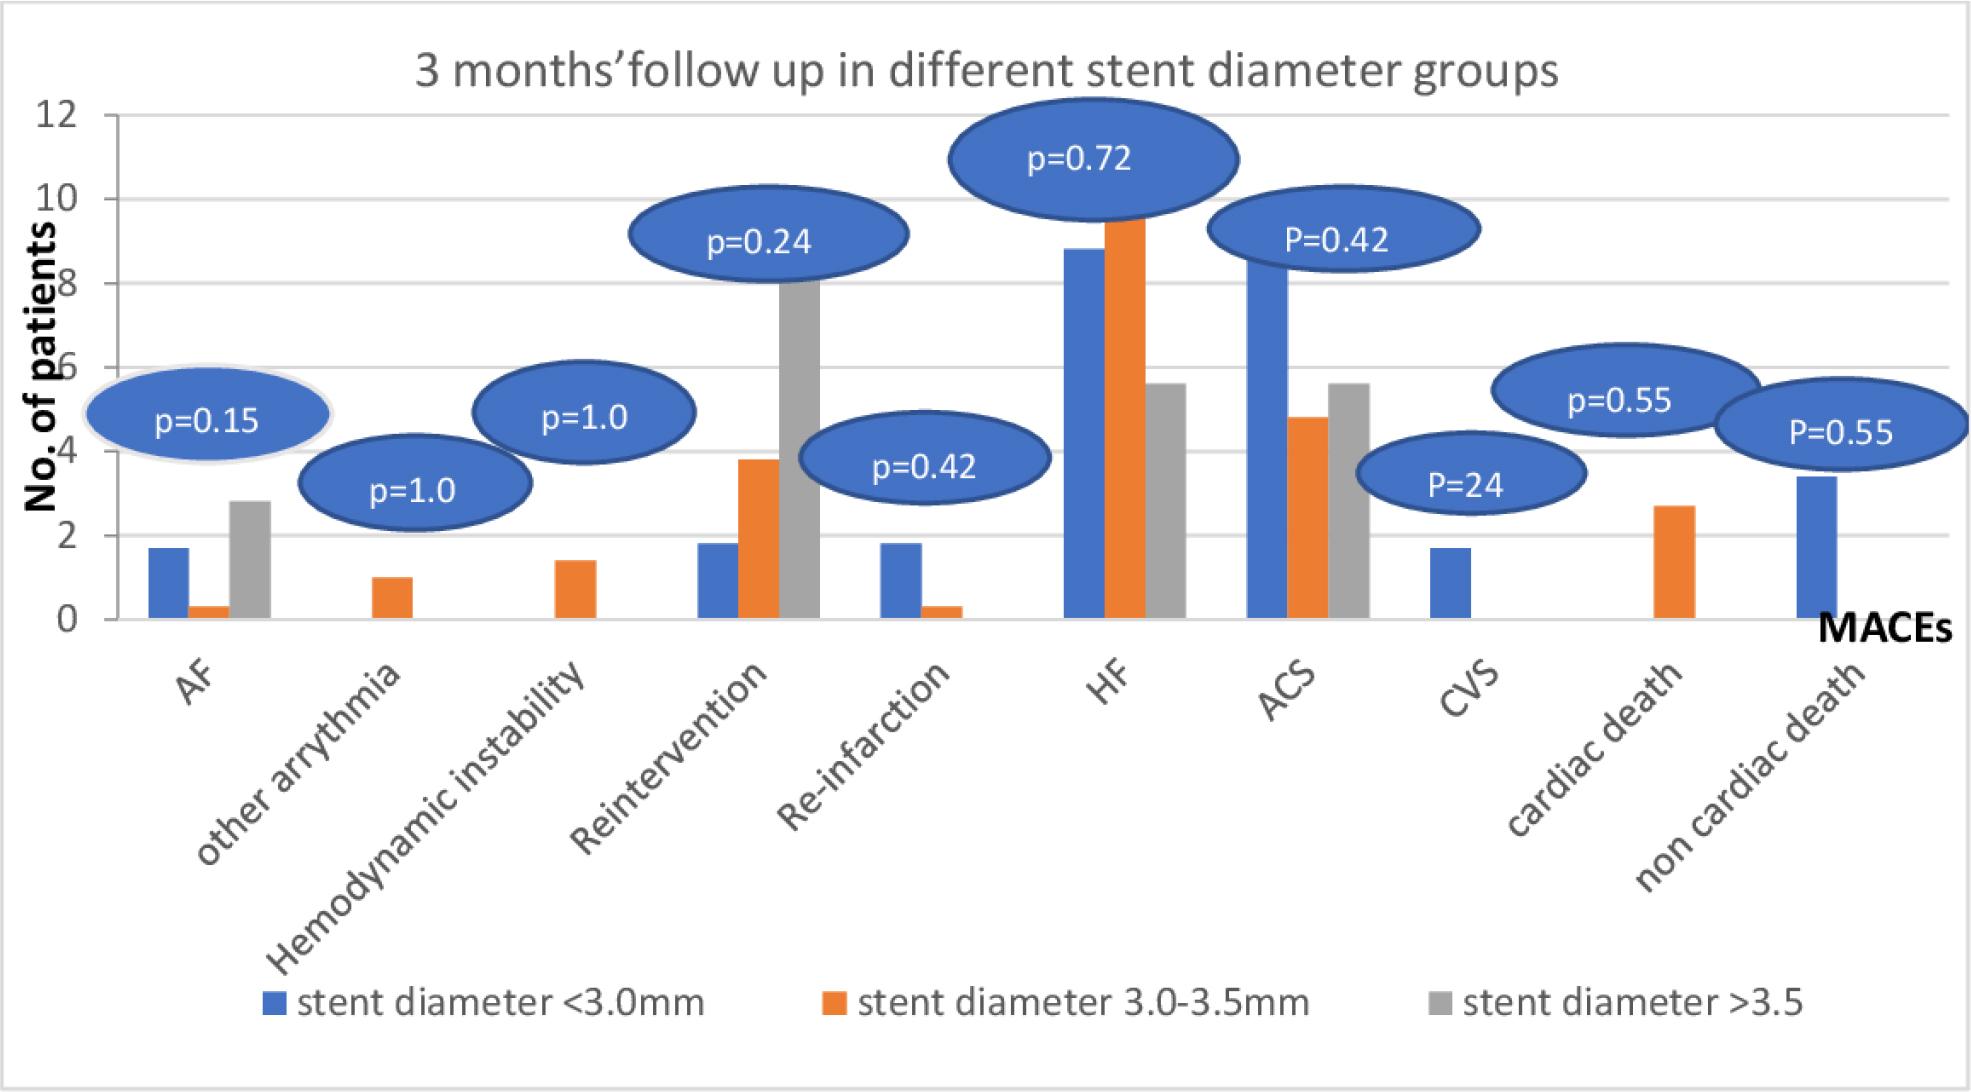
Figure 3
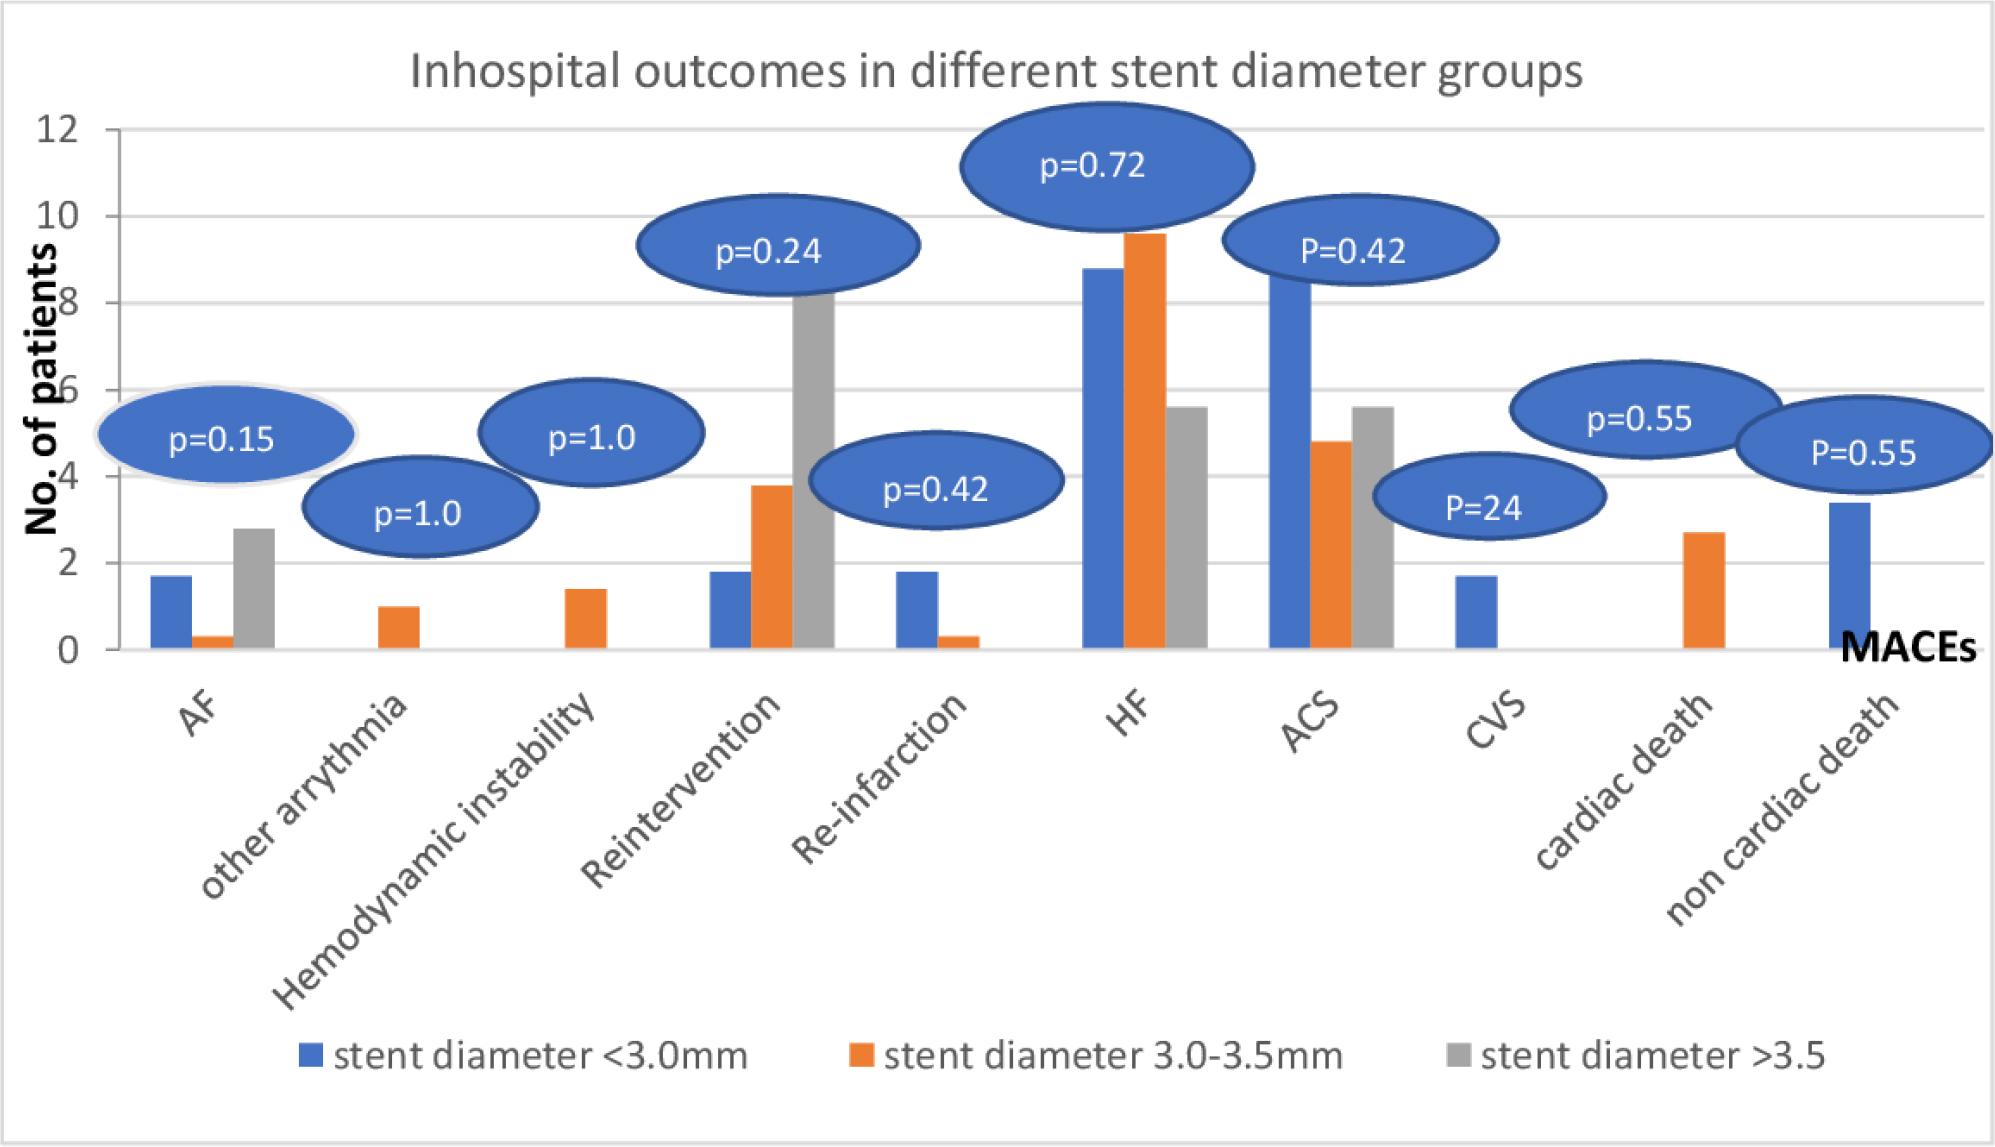
Figure 4
Univariate and Multivariate logistic regression analysis for prediction of MACEs among studied patients
| Variables | Univariate analysis | Multivariate analysis | ||||
|---|---|---|---|---|---|---|
| OR | 95% CI | P value | OR | 95% CI | P value | |
| Killip classification | ||||||
| • I | ref | ref | ||||
| • II | 10.868 | 2.436 – 48.493 | 0.002 | 7.200 | 1.555 – 33.337 | 0.012 |
| Pre-hospital delay (hour) | 1.049 | 1.008 – 1.092 | 0.018 | 1.028 | 0.984 – 1.073 | 0.219 |
| Door to device time | 1.017 | 1.003 – 1.031 | 0.018 | 1.011 | 0.997 – 1.026 | 0.130 |
| Final TIMI flow | ||||||
| • TIMI flow grades ≤2 | 1.674 | 1.066 – 2.629 | 0.025 | 1.262 | 0.769 – 2.073 | 0.358 |
| • TIMI flow grade 3 | ref | |||||
| No. of pre-dilatation | 1.172 | 1.029 – 1.336 | 0.017 | 1.082 | 0.943 – 1.242 | 0.259 |
| Side branches occlusion | ||||||
| • No | ref | |||||
| • Yes | 5.195 | 1.065 – 25.330 | 0.042 | 3.831 | 0.731 – 20.069 | 0.112 |
| Procedure time | 1.041 | 1.015 – 1.067 | 0.002 | 1.030 | 1.002 – 1.060 | 0.036 |
| EF (%) | 0.968 | 0.943 – 0.993 | 0.012 | 0.987 | 0.958 – 1.018 | 0.412 |
| Diastolic dysfunction grade | ||||||
| • Grade 1 | ref | ref | ||||
| • Grade 2 | 1.892 | 1.112 – 3.221 | 0.019 | 1.244 | 0.673 – 2.300 | 0.485 |
| • Grade 3 | 0.00 | 0.00 - NA | 0.999 | 0.00 | 0.00 - NA | 1.00 |
Patients baseline and laboratory data (n=404)
| Baseline data | N | (%) |
|---|---|---|
| Age (years) | ||
| • Mean ± SD | 56.00 ± 11.35 | |
| • Range | 27 - 83 | |
| Gender, n (%) | ||
| • Male | 319 | (79.0) |
| • Female | 85 | (21.0) |
| Risk Factors, n (%) | ||
| • Diabetes | 126 | (30.7) |
| • Hypertension | 130 | (31.7) |
| • Smoking | 281 | (68.5) |
| • CVS | 8 | (2.0) |
| • Dyslipidemia | 117 | (29.0) |
| Killip classification | ||
| • I | 388 | (96.0) |
| • II | 16 | (4.0) |
| Pre-hospital delay (hours) | 6 (1 – 24) | |
| Laboratory data | ||
| WBC(*103/ul) | ||
| • Mean ± SD | 12.13 ± 4.66 | |
| Hemoglobin (g/dl) | ||
| • Mean ± SD | 13.59 ± 1.87 | |
| Platelets (*103/ul) | ||
| • Mean ± SD | 287.04 ± 83.81 | |
| Triglyceride level (mg/dl) | ||
| • Mean ± SD | 135.06 ± 78.13 | |
| Cholesterol (mmol/L) | ||
| • Mean ± SD | 185.95 ± 46.44 | |
| LDL (mg/dl) | ||
| • Mean ± SD | 122.42 ± 37.89 | |
| HDL (mg/dl) | ||
| • Mean ± SD | 39.43 ± 8.68 | |
| Creatinine level (mg/dL) | ||
| At baseline | ||
| • Mean ± SD | 0.85 ± 0.27 | |
| After 48 hours of FU | ||
| • Mean ± SD | 0.91 ± 0.31 | |
| P value* | <0.001 | |
Angiographic characteristics of the studied patients in different stent diameter groups (n=404)
| Angiographic characteristics | < 3.0 (n=62) | Stent diameter 3.0 – 3.5 (n=306) | > 3.5 (n=36) | P value | |||
|---|---|---|---|---|---|---|---|
| Access site | |||||||
| •Femoral | 56 | (90.3) | 284 | (92.8) | 35 | (97.2) | 0.503 |
| •Radial | 6 | (9.7) | 22 | (7.2) | 1 | (2.8) | |
| Target vessel | <0.001 | ||||||
| • LAD | 31 | (50.0) | 205 | (67.0) | 17 | (47.2) | |
| • LCX | 14 | (22.6) | 78 | (25.5) | 17 | (47.2) | |
| • RCA | 9 | (14.5) | 21 | (6.9) | 2 | (5.6) | |
| • other coronary branches | 8 | (12.9) | 2 | (0.6) | 0 | (0.0) | |
| Pre TIMI flow | 0.181 | ||||||
| • TIMI flow grades ≤2 | 50 | (80.6) | 213 | (69.6) | 24 | (66.7) | |
| • TIMI flow grade 3 | 12 | (19.4) | 93 | (30.4) | 12 | (33.3) | |
| Final TIMI flow | 0.590 | ||||||
| • TIMI flow grades ≤2 | 5 | (8.1) | 16 | (5.2) | 1 | (2.8) | |
| • TIMI flow grade 3 | 57 | (91.9) | 290 | (94.8) | 35 | (97.2) | |
| No. of affected vessels | 0.194 | ||||||
| • 1 | 34 | (54.8) | 206 | (67.3) | 27 | (75.0) | |
| • 2 | 28 | (45.2) | 99 | (32.4) | 9 | (25.0) | |
| • 3 | 0 | (0.0) | 1 | (0.3) | 0 | (0.0) | |
| Pre-dilatation | 54 | (87.1) | 200 | (65.4) | 22 | (61.1) | 0.002 |
| • Median No. of pre-dilatation | 2 (0 – 10) | 1 (0 – 16) | 1 (0 – 4) | <0.001 | |||
| Post – dilatation | 17 | (27.4) | 57 | (18.6) | 8 | (22.2) | 0.279 |
| • Median No. of post-dilatation | 0 (0 – 6) | 0 (0 – 7) | 0 (0 – 3) | 0.356 | |||
| Side branches occlusion | 0 | (0.0) | 6 | (2.0) | 3 | (8.3) | 0.042 |
| Thrombus burden grades | 0.071 | ||||||
| • Grade 0 | 0 | (0.0) | 1 | (0.3) | 1 | (2.8) | |
| • Grade 1 | 4 | (6.5) | 9 | (2.9) | 1 | (2.8) | |
| • Grade 2 | 0 | (0.0) | 10 | (3.3) | 3 | (8.3) | |
| • Grade 3 | 8 | (12.9) | 53 | (17.3) | 6 | (16.7) | |
| • Grade 4 | 3 | (4.8) | 41 | (13.4) | 5 | (13.9) | |
| • Grade 5 | 47 | (75.8) | 192 | (62.7) | 20 | (55.6) | |
| ▪Low | 13 | (27.7) | 65 | (33.9) | 2 | (10.0) | 0.078 |
| ▪High | 34 | (72.3) | 127 | (66.1) | 18 | (90.0) | |
| SF-NR | 5 | (8.1) | 16 | (5.2) | 1 | (2.8) | 0.590 |
| Median door to device time in minutes (range) | 33 (15 – 90) | 30 (12 – 110) | 30 (20 – 80) | 0.740 | |||
| Median onset of chest pain to wire in hours (range) | 6.5 (2 – 24) | 6.5 (1.5 – 95.0) | 5.5 (3 – 24) | 0.416 | |||
| Mean procedure time in minutes | 32.19 ± 9.94 | 28.31 ± 7.75 | 25.72 ± 5.67 | <0.001 | |||
| Mean contrast amount in ml | 126.13 ± 26.94 | 122.68 ± 26.46 | 119.17 ± 22.73 | 0.430 | |||
Angiographic characteristics of the studied patients in different stent length groups (n=404)
| Angiographic characteristics | < 20 (n=40) | Stent length 20 – 40 (n=295) | > 40 (n=69) | P value | |||
|---|---|---|---|---|---|---|---|
| Access site | |||||||
| •Femoral | 37 | (92.5) | 275 | (93.2) | 63 | (91.3) | 0.768 |
| •Radial | 3 | (7.5) | 20 | (6.8) | 6 | (8.7) | |
| Target vessel | <0.001 | ||||||
| • LAD | 16 | (40.0) | 190 | (64.4) | 47 | (68.1) | |
| • RCA | 8 | (20.0) | 82 | (27.8) | 19 | (27.5) | |
| • LCX | 13 | (32.5) | 16 | (5.4) | 3 | (4.3) | |
| • Other coronary branches | 3 | (7.5) | 7 | (2.4) | 0 | (0.0) | |
| Pre TIMI flow | 0.141 | ||||||
| • TIMI flow grades ≤2 | 24 | (60.0) | 217 | (73.6) | 46 | (66.7) | |
| • TIMI flow grade 3 | 16 | (40.0) | 78 | (26.4) | 23 | (33.3) | |
| Final TIMI flow | 0.016 | ||||||
| • TIMI flow grades ≤ 2 (SF-NR) | 1 | (2.5) | 12 | (4.1) | 9 | (13.0) | |
| • TIMI flow grade 3 | 39 | (97.5) | 283 | (95.9) | 60 | (87.0) | |
| No. of affected vessels | 0.211 | ||||||
| • 1 | 27 | (67.5) | 197 | (66.8) | 43 | (62.3) | |
| • 2 | 12 | (30.0) | 98 | (33.2) | 26 | (37.7) | |
| • 3 | 1 | (2.5) | 0 | (0.0) | 0 | (0.0) | |
| Pre-dilatation | 23 | (57.5) | 200 | (67.8) | 53 | (76.8) | 0.105 |
| • Median No. of pre-dilatation | 1 (0 – 4) | 1 (0 – 6) | 2 (0 – 16) | 0.010 | |||
| Post – dilatation | 7 | (17.5) | 55 | (18.6) | 20 | (29.0) | 0.141 |
| • Median No. of post-dilatation | 0 (0 – 3) | 0 (0 – 7) | 0 (0 – 5) | 0.129 | |||
| Side branches occlusion | 0 | (0.0) | 8 | (2.7) | 1 | (1.4) | 0.863 |
| Thrombus burden grades | 0.373 | ||||||
| • Grade 0 | 0 | (0.0) | 2 | (0.7) | 0 | (0.0) | |
| • Grade 1 | 2 | (5.0) | 7 | (2.4) | 5 | (7.2) | |
| • Grade 2 | 3 | (7.5) | 9 | (3.1) | 1 | (1.4) | |
| • Grade 3 | 6 | (15.0) | 47 | (15.9) | 14 | (20.3) | |
| • Grade 4 | 5 | (12.5) | 39 | (13.2) | 5 | (7.2) | |
| • Grade 5 | 24 | (60.0) | 191 | (64.7) | 44 | (63.8) | |
| Median door to device in minutes (range) | 30 (15 – 110) | 30 (12 – 110) | 35 (15 – 90) | 0.011 | |||
| Median onset of chest pain to wire in hours (range) | 5 (2 – 18) | 6.5 (1.5 – 95.0) | 8 (2 – 24) | <0.001 | |||
| Mean procedure time in minutes | 26.30 ± 6.81 | 27.09 ± 6.86 | 36.84 ± 8.88 | <0.001 | |||
| Mean contrast amount in ml | 123.50 ± 29.31 | 120.88 ± 23.97 | 131.16 ± 31.79 | 0.013 | |||
Echocardiographic finding among the studied patients over the studied time points (before catheterization, during admission, and after 3 months
| Electrocardiographic finding | Before catheterization, n=404 | During admission, n=401 | After 3 months, n=381 | P value | |||
|---|---|---|---|---|---|---|---|
| EF (%) | 49 (25 – 65) | 51 (26 – 67) | 54 (25 – 68) | <0.001 | |||
| MR | 0.001 | ||||||
| • No | 335 | (82.9) | 333 | (83.0) | 334 | (87.7) | |
| • Yes | 69 | (17.1) | 68 | (17.0) | 47 | (12.3) | |
| SWMA | <0.001 | ||||||
| • Absent | 0 | (0.0) | 12 | (3.0) | 52 | (13.6) | |
| • Present | 404 | (100.0) | 389 | (97.0) | 329 | (86.4) | |
| Score index, median (range) | 1.4 (1.08 – 2.3) | 1.4 (1.0 – 2.3) | 1.2 (1.0 – 2.3) | <0.001 | |||
| Diastolic dysfunction | <0.001 | ||||||
| 404 | (100.0) | 400 | (99.8) | 371 | (97.4) | ||
Univariate and Multivariate logistic regression analysis for prediction of SF-NR among studied patients
| Variables | Univariate analysis | Multivariate analysis | ||||
|---|---|---|---|---|---|---|
| OR | 95% CI | P value | OR | 95% CI | P value | |
| Killip classification | ||||||
| • I | ref | ref | ||||
| • II | 4.482 | 1.177 – 17.071 | 0.028 | 2.601 | 0.560 – 12.084 | 0.223 |
| No. of pre-dilatation | 1.597 | 1.266 – 2.014 | <0.001 | 1.486 | 1.182 – 1.869 | 0.001 |
| Procedure time | 1.103 | 1.053 – 1.155 | <0.001 | 1.073 | 1.016 – 1.133 | 0.011 |
| EF (%) | 0.902 | 0.850 – 0.956 | 0.001 | 0.926 | 0.856 – 1.001 | 0.054 |
| Diastolic dysfunction grade | ||||||
| • Grade 1 | ref | ref | ||||
| • Grade 2 | 5.891 | 2.435 – 14.249 | <0.001 | 2.478 | 0.778 – 7.898 | 0.125 |
| • Grade 3 | 0.000 | 0.00 - NA | 0.999 | 0.00 | 0.00 - NA | 1.00 |