Globally, acute myocardial infarction (AMI) is among the leading causes of death [1]. Primary percutaneous coronary intervention (PCI) should be used to conduct rapid reperfusion to secure the compromised myocardium [2]. Even though primary PCI produces faster and more reliable reperfusion with a lower risk of complications than thrombolysis [3], managing long coronary lesions remains difficult [4]. Patients with longer and smaller diameter bare metal stents (BMS) and first-generation drug eluting stents (1G-DESs) had a significantly greater incidence of major adverse cardiac events (MACEs) than patients with shorter and larger diameter BMS and 1G-DESs [5]. But there was not much information available on new generation DESs, particularly in primary PCI settings [5]. Regarding stent diameter, the risk of restenosis and other adverse cardiovascular events with BMSs has increased with smaller stent diameters [6]. When compared to BMSs, DESs have been demonstrated to lower the risk of in-stent restenosis (ISR) after PCI [7]. In this study, we aimed to assess the impact of second-generation drug eluting stents (2G-DESs) length and diameter on angiographic and MACE outcomes during in-hospital and short term (3 months’) follow up in STEMI patients undergoing primary PCI.
To evaluate the effect of 2G-DES length and diameter on angiographic and MACE outcomes in patients receiving primary percutaneous coronary intervention (PCI) during short-term and in-hospital follow-up.
patients with STEMI were enrolled in our prospective observational study. A prior PCI, an ectatic lesion, multi-vessel disease amenable to coronary artery bypass grafting (CABG), complicated lesions, including bifurcation lesions and left main (LM) stenting, or the presentation of Killip classes III and IV were among the exclusion criteria.
All the study population were subjected to the following: a complete history, a clinical examination, an ECG and 2D echocardiography (using Vivid 5e GE Healthcare machine), which used Simpson’s technique to assess systolic function. Segmental wall motion abnormalities (SWMA), mitral regurgitation (MR) severity (using both semiquantitative and quantitative methods) and diastolic function utilizing a tissue Doppler [8] were assessed prior to catheterization, prior to discharge and following a three-month period of follow up and laboratory examination (full blood count, lipogram, and renal function).
The access site was chosen based on the operator’s preference.
Length of stent (divided in to short stent length <20 mm, intermediate stent length 20-40 mm and long stent length > 40 mm) [9], when two stents were used, the length was calculated by summation of both stent lengths.
Diameter of stent (divided in to small stent diameter < 3.0 mm, intermediate stent diameter 3.0 – 3.5 mm and large stent diameter > 3.5 mm) [9].
Number of stents.
Type of stent (was chosen according to available type of 2nd generation DESs either sirolimus, everolimus or zotarolimus type).
Door to device time.
Duration of the procedure (time from the beginning of the procedure until the end of the procedure).
Pre-dilatation (when needed) before stent deployment, post-dilatation and number of inflations in both.
Amount of contrast used in ml.
Complication during procedure including (SF-NR; which observed immediately post stent implantation or side branch occlusion).
Pre TIMI flow [10].
Final TIMI flow [10].
Thrombus grade [11].
Number of affected vessels (lesions causing stenosis >50% of vessels of diameter >1.5 mm) [12].
Thrombus aspiration was used as a bailout strategy in cases of high thrombus burden.
Use of glycoprotein IIb-IIIa inhibitors.
Hemodynamic instability (hypotension or cardiogenic shock), clinically serious arrhythmias such as atrial fibrillation (AF), ventricular tachycardia (VT) or ventricular fibrillation (VF), need for re-intervention, re-infarction (recurrence of chest pain and ECG changes along with elevated cardiac enzymes), heart failure, cerebrovascular stroke (CVS) and mortality (either cardiovascular (CV) or non-cardiovascular).
Arrhythmias, need for admission with hemodynamic instability, need for re-admission with ACS or heart failure, need of re-intervention, re-infarction reported as chest pain and documented by re-raising in ECG (due to target vessel failure either stent thrombosis or restenosis) [13], CVS and mortality (either CV or non-CV death).
All statistical calculations were done using SPSS (statistical package for the social science; SPSS Inc., Chicago, IL, USA) version 24. Data were statistically described in terms of mean ± standard deviation (±SD), or median and range when not normally distributed, frequencies (number of cases) and relative frequencies (percentages) when appropriate. Comparison of quantitative variables was made using the student t-test and ANOVA test for normally distributed data and the Mann Whitney U test or Kruskal Wallis test for non-normally distributed data; for comparing paired data, the Friedman test or Wilcoxon sign rank test was used; for comparing categorical data, Chi-square (X2) test was performed. An exact test was used instead when the expected frequency was less than 5, Odds ratio (OR) with 95% Confidence Interval (CI) and Logistic Regression analysis were calculated for the prediction of development of SF-NR and MACEs among the studied participants, and P-value set significant at 0.05 level.
Our study included 404 AMI patients indicated for PPCI, age range (27–83 years old) with a mean age of 56±11.35 years. The majority of patients (79%) were males, and Table 1 shows the clinical risk factors for CAD and investigations conducted.
Patients baseline and laboratory data (n=404)
| Baseline data | N | (%) |
|---|---|---|
| Age (years) | ||
| • Mean ± SD | 56.00 ± 11.35 | |
| • Range | 27 - 83 | |
| Gender, n (%) | ||
| • Male | 319 | (79.0) |
| • Female | 85 | (21.0) |
| Risk Factors, n (%) | ||
| • Diabetes | 126 | (30.7) |
| • Hypertension | 130 | (31.7) |
| • Smoking | 281 | (68.5) |
| • CVS | 8 | (2.0) |
| • Dyslipidemia | 117 | (29.0) |
| Killip classification | ||
| • I | 388 | (96.0) |
| • II | 16 | (4.0) |
| Pre-hospital delay (hours) | 6 (1 – 24) | |
| Laboratory data | ||
| WBC(*103/ul) | ||
| • Mean ± SD | 12.13 ± 4.66 | |
| Hemoglobin (g/dl) | ||
| • Mean ± SD | 13.59 ± 1.87 | |
| Platelets (*103/ul) | ||
| • Mean ± SD | 287.04 ± 83.81 | |
| Triglyceride level (mg/dl) | ||
| • Mean ± SD | 135.06 ± 78.13 | |
| Cholesterol (mmol/L) | ||
| • Mean ± SD | 185.95 ± 46.44 | |
| LDL (mg/dl) | ||
| • Mean ± SD | 122.42 ± 37.89 | |
| HDL (mg/dl) | ||
| • Mean ± SD | 39.43 ± 8.68 | |
| Creatinine level (mg/dL) | ||
| At baseline | ||
| • Mean ± SD | 0.85 ± 0.27 | |
| After 48 hours of FU | ||
| • Mean ± SD | 0.91 ± 0.31 | |
| P value* | <0.001 | |
Quantitative data are presented as mean ± SD and range or median (range), qualitative data are presented as number (percentage).
P value for comparing the Creatinine level from baseline to after 48 hours of follow up. Significance defined by p < 0.05.
CVS: Cerebrovascular Stroke, WBC: White Blood Cells, LDL: Low Density Lipoprotein, HDL: High Density lipoprotein.
The echocardiographic findings for the patients under study were evaluated at baseline (prior to catheterization) and at follow-up (during admission and subsequently after three months). The data was compared three times, as indicated in Table 2, which also revealed a significant P value for diastolic dysfunction, ejection fraction (EF), MR, and SWMA.
Echocardiographic finding among the studied patients over the studied time points (before catheterization, during admission, and after 3 months
| Electrocardiographic finding | Before catheterization, n=404 | During admission, n=401 | After 3 months, n=381 | P value | |||
|---|---|---|---|---|---|---|---|
| EF (%) | 49 (25 – 65) | 51 (26 – 67) | 54 (25 – 68) | <0.001 | |||
| MR | 0.001 | ||||||
| • No | 335 | (82.9) | 333 | (83.0) | 334 | (87.7) | |
| • Yes | 69 | (17.1) | 68 | (17.0) | 47 | (12.3) | |
| SWMA | <0.001 | ||||||
| • Absent | 0 | (0.0) | 12 | (3.0) | 52 | (13.6) | |
| • Present | 404 | (100.0) | 389 | (97.0) | 329 | (86.4) | |
| Score index, median (range) | 1.4 (1.08 – 2.3) | 1.4 (1.0 – 2.3) | 1.2 (1.0 – 2.3) | <0.001 | |||
| Diastolic dysfunction | <0.001 | ||||||
| 404 | (100.0) | 400 | (99.8) | 371 | (97.4) | ||
Quantitative data are presented as median (range), and qualitative data are presented as number (percentage). * Significance defined by p < 0.05. EF: ejection fraction, MR: mitral regurge, SWMA: segmental wall motion abnormality.
Target vessel, final TIMI flow, median number of pre-dilatation, median door to device time, median of start of chest discomfort to wire time, mean operation duration, mean contrast quantity, and SF-NR were among the angiographic data that showed statistically significant differences between the stent length groups (Table 3).
Angiographic characteristics of the studied patients in different stent length groups (n=404)
| Angiographic characteristics | < 20 (n=40) | Stent length 20 – 40 (n=295) | > 40 (n=69) | P value | |||
|---|---|---|---|---|---|---|---|
| Access site | |||||||
| •Femoral | 37 | (92.5) | 275 | (93.2) | 63 | (91.3) | 0.768 |
| •Radial | 3 | (7.5) | 20 | (6.8) | 6 | (8.7) | |
| Target vessel | <0.001 | ||||||
| • LAD | 16 | (40.0) | 190 | (64.4) | 47 | (68.1) | |
| • RCA | 8 | (20.0) | 82 | (27.8) | 19 | (27.5) | |
| • LCX | 13 | (32.5) | 16 | (5.4) | 3 | (4.3) | |
| • Other coronary branches | 3 | (7.5) | 7 | (2.4) | 0 | (0.0) | |
| Pre TIMI flow | 0.141 | ||||||
| • TIMI flow grades ≤2 | 24 | (60.0) | 217 | (73.6) | 46 | (66.7) | |
| • TIMI flow grade 3 | 16 | (40.0) | 78 | (26.4) | 23 | (33.3) | |
| Final TIMI flow | 0.016 | ||||||
| • TIMI flow grades ≤ 2 (SF-NR) | 1 | (2.5) | 12 | (4.1) | 9 | (13.0) | |
| • TIMI flow grade 3 | 39 | (97.5) | 283 | (95.9) | 60 | (87.0) | |
| No. of affected vessels | 0.211 | ||||||
| • 1 | 27 | (67.5) | 197 | (66.8) | 43 | (62.3) | |
| • 2 | 12 | (30.0) | 98 | (33.2) | 26 | (37.7) | |
| • 3 | 1 | (2.5) | 0 | (0.0) | 0 | (0.0) | |
| Pre-dilatation | 23 | (57.5) | 200 | (67.8) | 53 | (76.8) | 0.105 |
| • Median No. of pre-dilatation | 1 (0 – 4) | 1 (0 – 6) | 2 (0 – 16) | 0.010 | |||
| Post – dilatation | 7 | (17.5) | 55 | (18.6) | 20 | (29.0) | 0.141 |
| • Median No. of post-dilatation | 0 (0 – 3) | 0 (0 – 7) | 0 (0 – 5) | 0.129 | |||
| Side branches occlusion | 0 | (0.0) | 8 | (2.7) | 1 | (1.4) | 0.863 |
| Thrombus burden grades | 0.373 | ||||||
| • Grade 0 | 0 | (0.0) | 2 | (0.7) | 0 | (0.0) | |
| • Grade 1 | 2 | (5.0) | 7 | (2.4) | 5 | (7.2) | |
| • Grade 2 | 3 | (7.5) | 9 | (3.1) | 1 | (1.4) | |
| • Grade 3 | 6 | (15.0) | 47 | (15.9) | 14 | (20.3) | |
| • Grade 4 | 5 | (12.5) | 39 | (13.2) | 5 | (7.2) | |
| • Grade 5 | 24 | (60.0) | 191 | (64.7) | 44 | (63.8) | |
| Median door to device in minutes (range) | 30 (15 – 110) | 30 (12 – 110) | 35 (15 – 90) | 0.011 | |||
| Median onset of chest pain to wire in hours (range) | 5 (2 – 18) | 6.5 (1.5 – 95.0) | 8 (2 – 24) | <0.001 | |||
| Mean procedure time in minutes | 26.30 ± 6.81 | 27.09 ± 6.86 | 36.84 ± 8.88 | <0.001 | |||
| Mean contrast amount in ml | 123.50 ± 29.31 | 120.88 ± 23.97 | 131.16 ± 31.79 | 0.013 | |||
Quantitative data are presented as median (range), and qualitative data are presented as number (percentage). * Significance defined by p < 0.05. LAD: left anterior descending, RCA: right coronary artery, LCX: left circumflex, TIMI: thrombolysis in myocardial infarction, SF-NR: slow flow –no reflow.
Figure 1 and Figure 2 depict the clinical results of the patients in the study who were in various stent length groups at admission and three months later, respectively. There was a substantial difference in the need for re-intervention between the different stent length groups during the hospital admission period. Meanwhile, stent length had a substantial impact on recurrent ACS throughout the 3-month follow-up period; the longer stent length group (> 40 mm) had a considerably greater frequency of ACS recurrence.
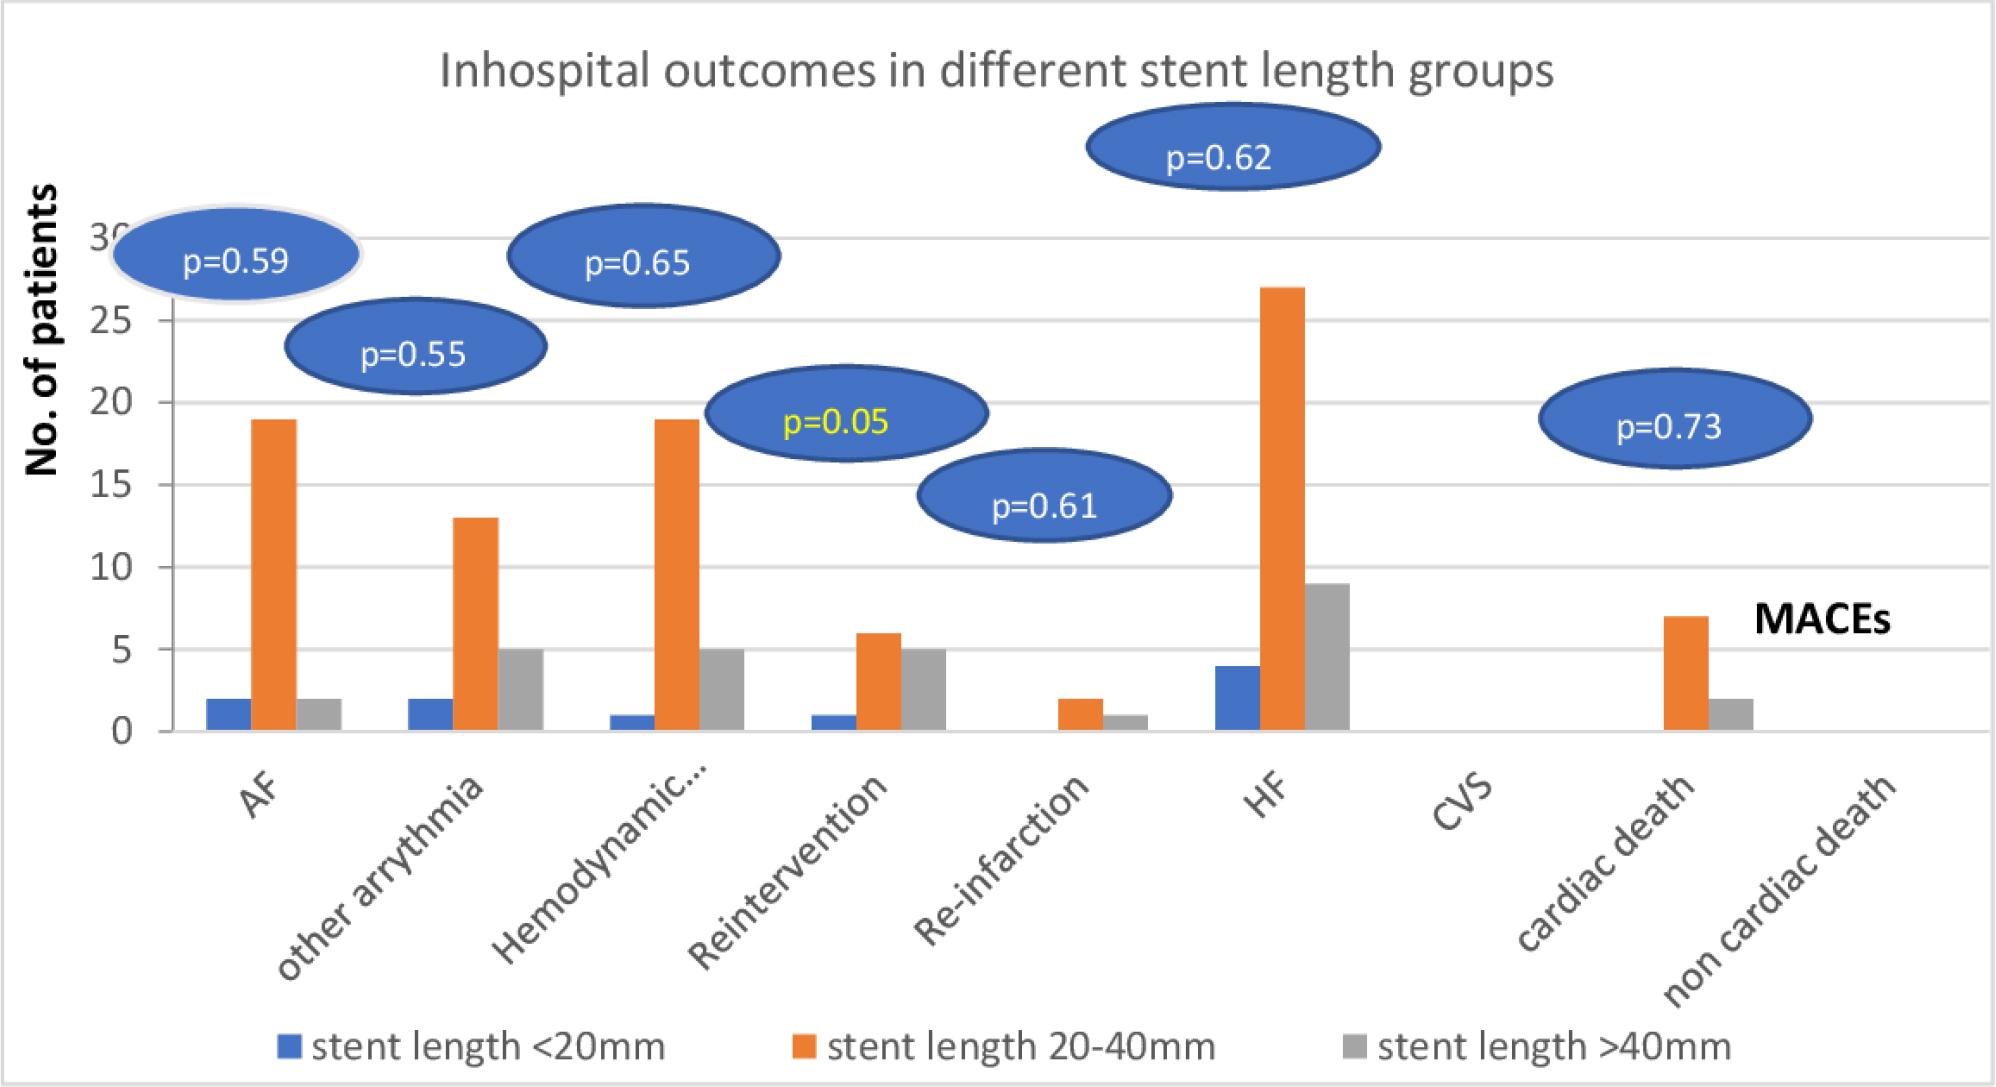
In hospital MACEs among the studied patients in different stent length groups, AF: atrial fibrillation, CVS: cerebrovascular stroke, HF: heart failure
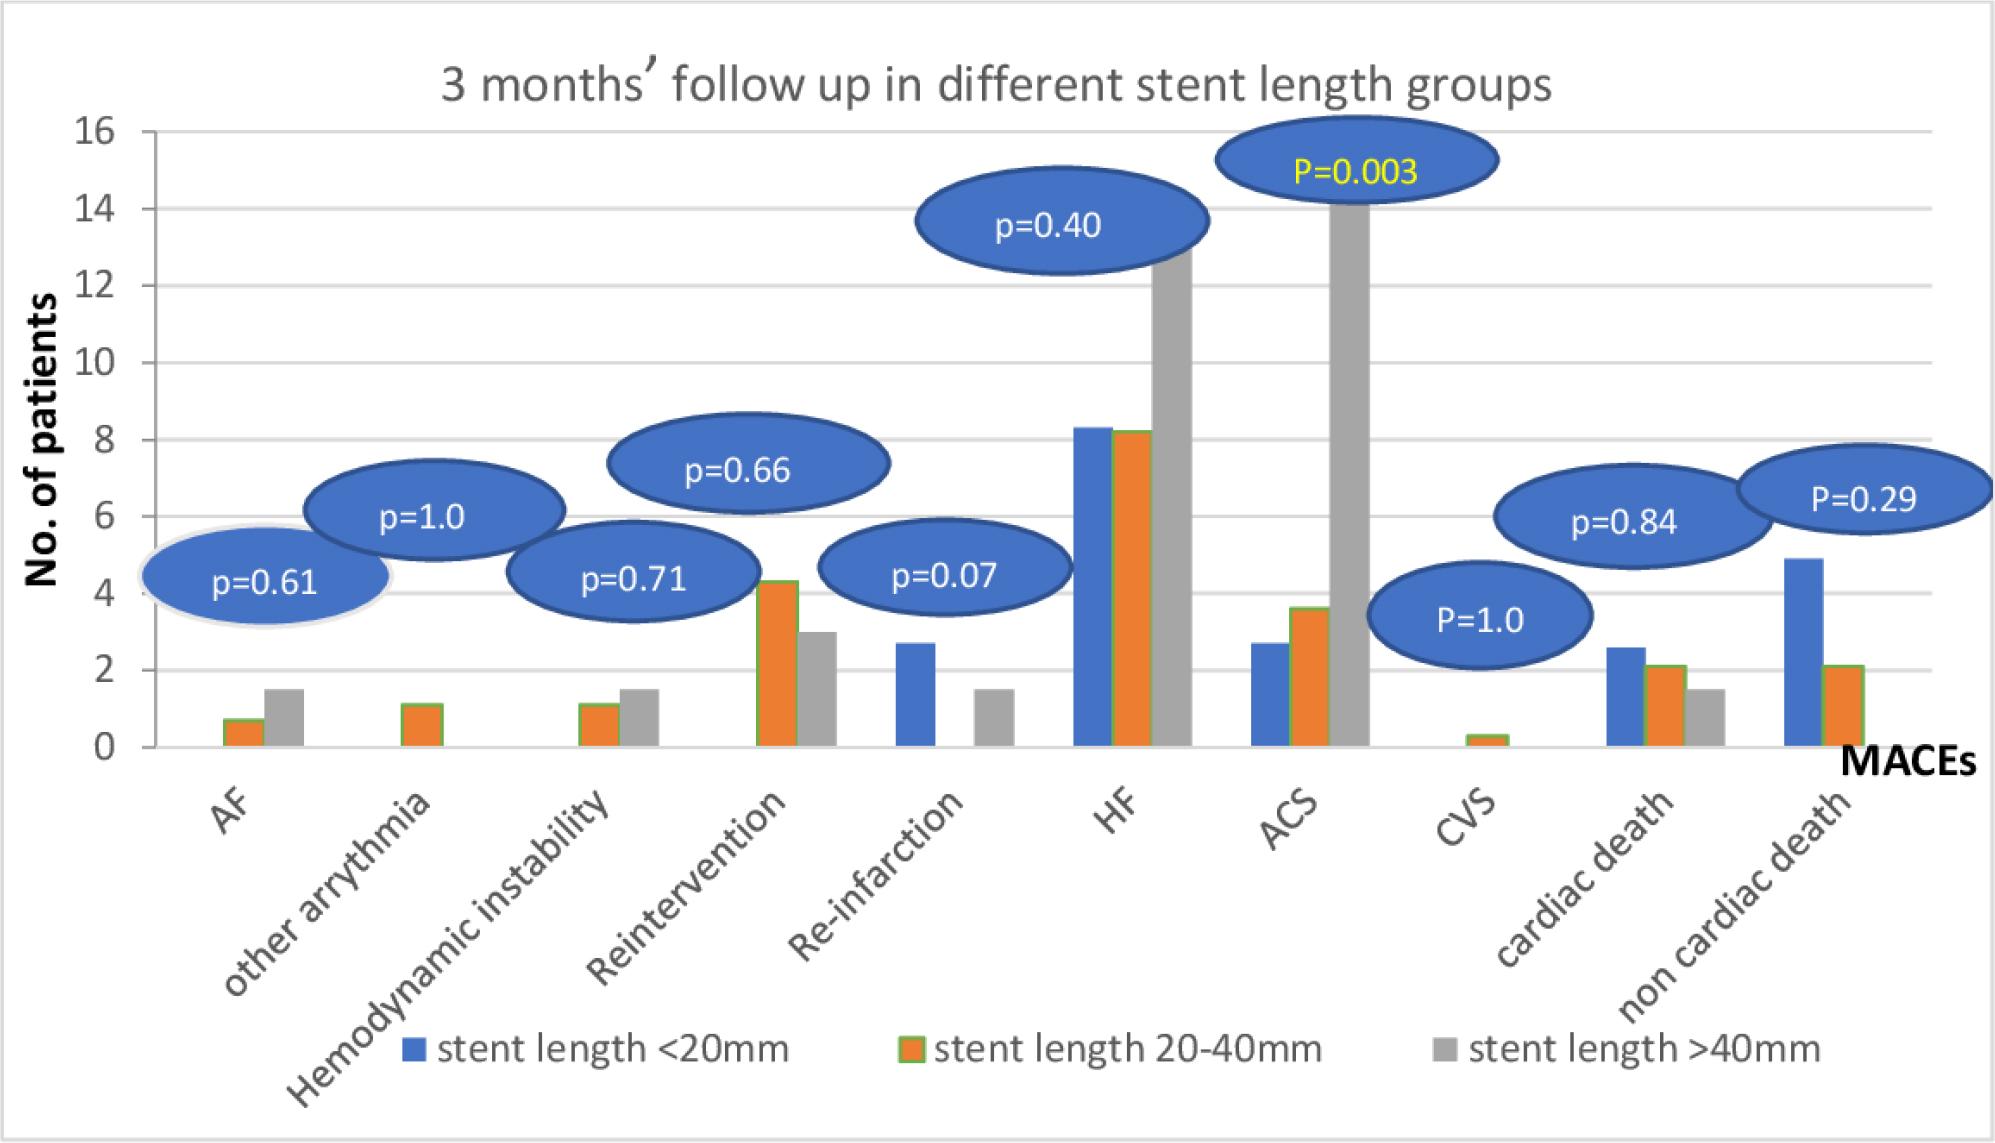
Three months’ follow up of MACEs among the studied patients in different stent length groups. ACS: acute coronary syndrome, AF: atrial fibrillation, CVS: cerebrovascular stroke, HF: heart failure.
In various stent diameter groups, significantly variable angiographic data (target vessel, pre-dilatation, side branch occlusion, and mean operation time) were found (Table 4).
Angiographic characteristics of the studied patients in different stent diameter groups (n=404)
| Angiographic characteristics | < 3.0 (n=62) | Stent diameter 3.0 – 3.5 (n=306) | > 3.5 (n=36) | P value | |||
|---|---|---|---|---|---|---|---|
| Access site | |||||||
| •Femoral | 56 | (90.3) | 284 | (92.8) | 35 | (97.2) | 0.503 |
| •Radial | 6 | (9.7) | 22 | (7.2) | 1 | (2.8) | |
| Target vessel | <0.001 | ||||||
| • LAD | 31 | (50.0) | 205 | (67.0) | 17 | (47.2) | |
| • LCX | 14 | (22.6) | 78 | (25.5) | 17 | (47.2) | |
| • RCA | 9 | (14.5) | 21 | (6.9) | 2 | (5.6) | |
| • other coronary branches | 8 | (12.9) | 2 | (0.6) | 0 | (0.0) | |
| Pre TIMI flow | 0.181 | ||||||
| • TIMI flow grades ≤2 | 50 | (80.6) | 213 | (69.6) | 24 | (66.7) | |
| • TIMI flow grade 3 | 12 | (19.4) | 93 | (30.4) | 12 | (33.3) | |
| Final TIMI flow | 0.590 | ||||||
| • TIMI flow grades ≤2 | 5 | (8.1) | 16 | (5.2) | 1 | (2.8) | |
| • TIMI flow grade 3 | 57 | (91.9) | 290 | (94.8) | 35 | (97.2) | |
| No. of affected vessels | 0.194 | ||||||
| • 1 | 34 | (54.8) | 206 | (67.3) | 27 | (75.0) | |
| • 2 | 28 | (45.2) | 99 | (32.4) | 9 | (25.0) | |
| • 3 | 0 | (0.0) | 1 | (0.3) | 0 | (0.0) | |
| Pre-dilatation | 54 | (87.1) | 200 | (65.4) | 22 | (61.1) | 0.002 |
| • Median No. of pre-dilatation | 2 (0 – 10) | 1 (0 – 16) | 1 (0 – 4) | <0.001 | |||
| Post – dilatation | 17 | (27.4) | 57 | (18.6) | 8 | (22.2) | 0.279 |
| • Median No. of post-dilatation | 0 (0 – 6) | 0 (0 – 7) | 0 (0 – 3) | 0.356 | |||
| Side branches occlusion | 0 | (0.0) | 6 | (2.0) | 3 | (8.3) | 0.042 |
| Thrombus burden grades | 0.071 | ||||||
| • Grade 0 | 0 | (0.0) | 1 | (0.3) | 1 | (2.8) | |
| • Grade 1 | 4 | (6.5) | 9 | (2.9) | 1 | (2.8) | |
| • Grade 2 | 0 | (0.0) | 10 | (3.3) | 3 | (8.3) | |
| • Grade 3 | 8 | (12.9) | 53 | (17.3) | 6 | (16.7) | |
| • Grade 4 | 3 | (4.8) | 41 | (13.4) | 5 | (13.9) | |
| • Grade 5 | 47 | (75.8) | 192 | (62.7) | 20 | (55.6) | |
| ▪Low | 13 | (27.7) | 65 | (33.9) | 2 | (10.0) | 0.078 |
| ▪High | 34 | (72.3) | 127 | (66.1) | 18 | (90.0) | |
| SF-NR | 5 | (8.1) | 16 | (5.2) | 1 | (2.8) | 0.590 |
| Median door to device time in minutes (range) | 33 (15 – 90) | 30 (12 – 110) | 30 (20 – 80) | 0.740 | |||
| Median onset of chest pain to wire in hours (range) | 6.5 (2 – 24) | 6.5 (1.5 – 95.0) | 5.5 (3 – 24) | 0.416 | |||
| Mean procedure time in minutes | 32.19 ± 9.94 | 28.31 ± 7.75 | 25.72 ± 5.67 | <0.001 | |||
| Mean contrast amount in ml | 126.13 ± 26.94 | 122.68 ± 26.46 | 119.17 ± 22.73 | 0.430 | |||
Quantitative data are presented as median (range), and qualitative data are presented as number (percentage). * Significance defined by p < 0.05. LAD: left anterior descending, RCA: right coronary artery, LCX: left circumflex, TIMI: thrombolysis in myocardial infarction, SF-NR: slow flow –no reflow.
The MACE outcomes during hospital admission and the three-month follow-up in the stent diameter groups are shown in Figures 3 and 4, where no discernible differences were found.
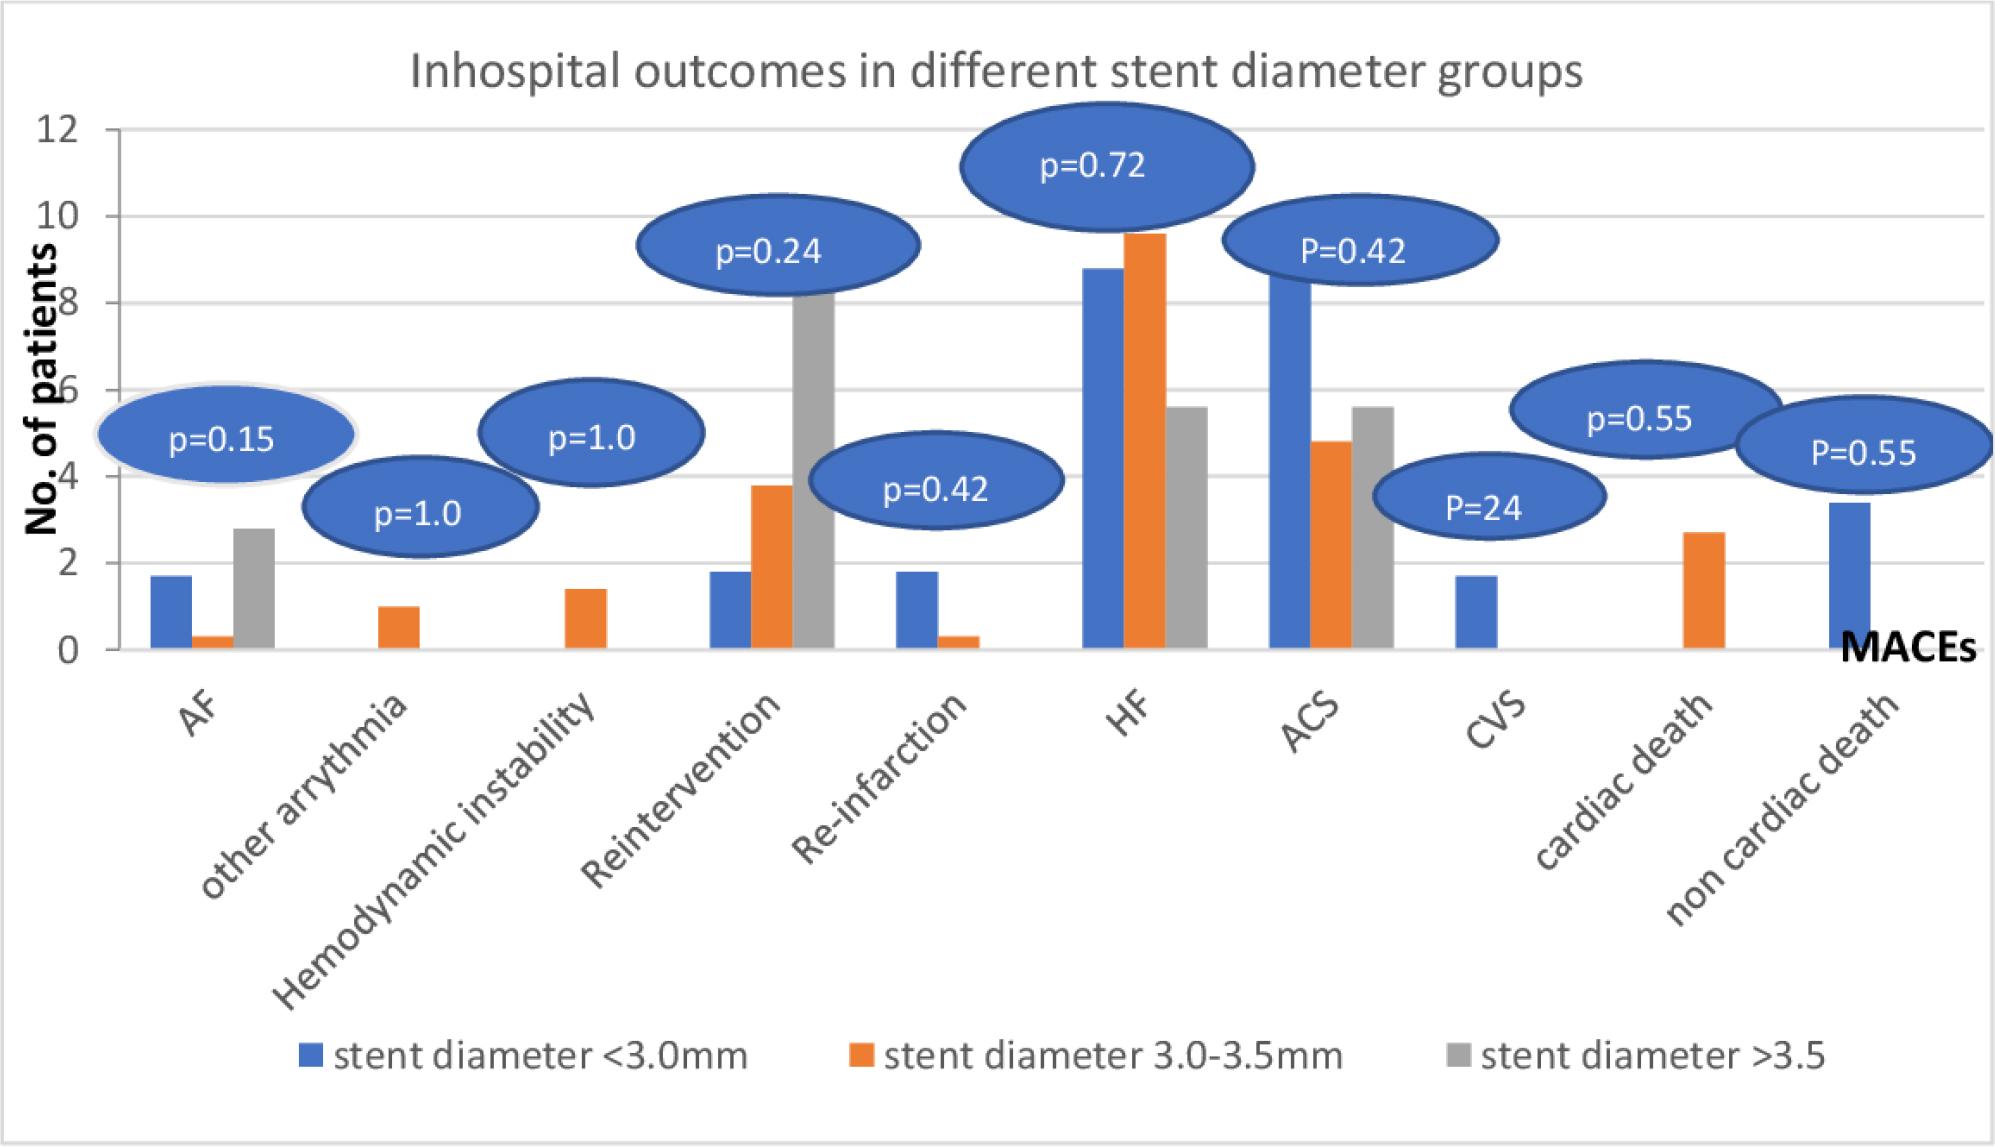
In hospital follow up of MACEs among the studied patients according to the stent diameter. AF: atrial fibrillation, CVS: cerebrovascular stroke, HF: heart failure.
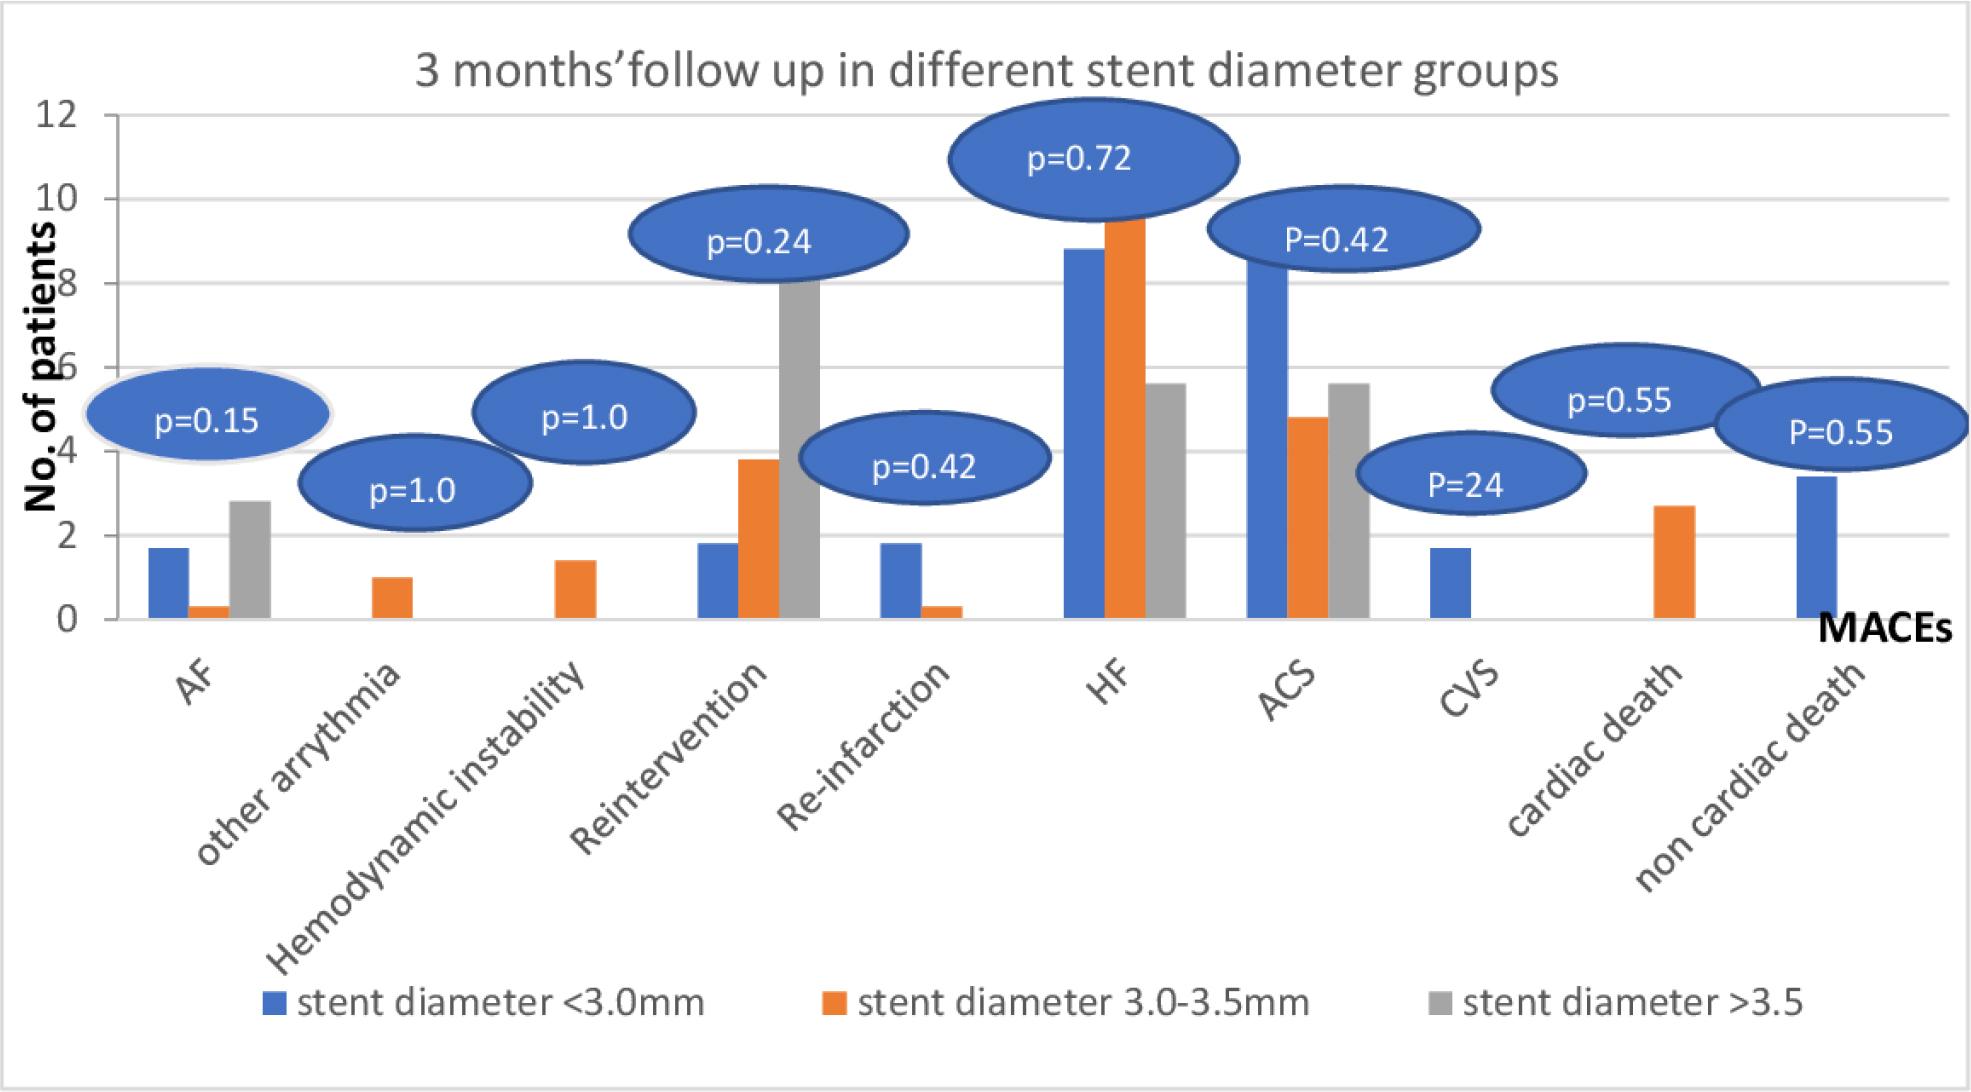
Three months’ follow up of MACEs among the studied patients in different stent diameter groups. ACS: acute coronary syndrome, AF: atrial fibrillation, CVS: cerebrovascular stroke. HF: heart failure.
When SF-NR was predicted using univariate logistic regression analysis, patients with grade II Killip classification, more pre-dilatations, longer procedure times, poorer EF and grade 2 diastolic dysfunction were found to have a greater likelihood of developing SF-NR. Nevertheless, multivariate analysis revealed that the only factors associated with an increased risk of developing SF-NR were a higher number of pre-dilatation and longer procedure times (Table 5).
Univariate and Multivariate logistic regression analysis for prediction of SF-NR among studied patients
| Variables | Univariate analysis | Multivariate analysis | ||||
|---|---|---|---|---|---|---|
| OR | 95% CI | P value | OR | 95% CI | P value | |
| Killip classification | ||||||
| • I | ref | ref | ||||
| • II | 4.482 | 1.177 – 17.071 | 0.028 | 2.601 | 0.560 – 12.084 | 0.223 |
| No. of pre-dilatation | 1.597 | 1.266 – 2.014 | <0.001 | 1.486 | 1.182 – 1.869 | 0.001 |
| Procedure time | 1.103 | 1.053 – 1.155 | <0.001 | 1.073 | 1.016 – 1.133 | 0.011 |
| EF (%) | 0.902 | 0.850 – 0.956 | 0.001 | 0.926 | 0.856 – 1.001 | 0.054 |
| Diastolic dysfunction grade | ||||||
| • Grade 1 | ref | ref | ||||
| • Grade 2 | 5.891 | 2.435 – 14.249 | <0.001 | 2.478 | 0.778 – 7.898 | 0.125 |
| • Grade 3 | 0.000 | 0.00 - NA | 0.999 | 0.00 | 0.00 - NA | 1.00 |
CI: Confidence interval; OR: Odds ratio; NA: not achieved. * P value is significant £0.05 EF: ejection fraction.
Patients with grade II Killip classification, longer pre-hospital delay, longer door to device time and final TIMI flow grades ≤2 were found to have greater odds of MACE, according to univariate logistic regression analysis. Also, MACE was more likely to occur in patients with more pre-dilatations, side branch occlusion, longer procedure times, poorer EF and grade 2 diastolic dysfunction. Multivariate analysis revealed that patients with longer procedure times and grade II Killip categorization had higher odds of developing MACEs (Table 6).
Univariate and Multivariate logistic regression analysis for prediction of MACEs among studied patients
| Variables | Univariate analysis | Multivariate analysis | ||||
|---|---|---|---|---|---|---|
| OR | 95% CI | P value | OR | 95% CI | P value | |
| Killip classification | ||||||
| • I | ref | ref | ||||
| • II | 10.868 | 2.436 – 48.493 | 0.002 | 7.200 | 1.555 – 33.337 | 0.012 |
| Pre-hospital delay (hour) | 1.049 | 1.008 – 1.092 | 0.018 | 1.028 | 0.984 – 1.073 | 0.219 |
| Door to device time | 1.017 | 1.003 – 1.031 | 0.018 | 1.011 | 0.997 – 1.026 | 0.130 |
| Final TIMI flow | ||||||
| • TIMI flow grades ≤2 | 1.674 | 1.066 – 2.629 | 0.025 | 1.262 | 0.769 – 2.073 | 0.358 |
| • TIMI flow grade 3 | ref | |||||
| No. of pre-dilatation | 1.172 | 1.029 – 1.336 | 0.017 | 1.082 | 0.943 – 1.242 | 0.259 |
| Side branches occlusion | ||||||
| • No | ref | |||||
| • Yes | 5.195 | 1.065 – 25.330 | 0.042 | 3.831 | 0.731 – 20.069 | 0.112 |
| Procedure time | 1.041 | 1.015 – 1.067 | 0.002 | 1.030 | 1.002 – 1.060 | 0.036 |
| EF (%) | 0.968 | 0.943 – 0.993 | 0.012 | 0.987 | 0.958 – 1.018 | 0.412 |
| Diastolic dysfunction grade | ||||||
| • Grade 1 | ref | ref | ||||
| • Grade 2 | 1.892 | 1.112 – 3.221 | 0.019 | 1.244 | 0.673 – 2.300 | 0.485 |
| • Grade 3 | 0.00 | 0.00 - NA | 0.999 | 0.00 | 0.00 - NA | 1.00 |
CI: Confidence interval; OR: Odds ratio; NA: not achieved. * P value is significant 0.05. TIMI: thrombolysis in myocardial infarction, EF: ejection fraction.
In this study, we present the impact of 2G-DESs length and diameter on angiographic and clinical outcomes in patients with STEMI undergoing primary PCI, including both in-hospital and 3-month follow ups.
Although 2G-DESs had advantages over 1G-DESs in terms of clinical outcomes and MACEs in STEMI patients [14–15], we discovered that longer stents were linked to higher odds of SF-NR, pre-dilatation requirements, mean procedure times and mean contrast amounts. Long stents had a greater incidence of recurrent ACS during the 3-month follow-up period, but there was no discernible difference in other MACE outcomes across the stent length groups.
Chen et al. observed similar findings linking longer stents to a higher risk of myocardial damage. This association may be explained by a higher risk of complication from distal embolization. Long stent implantation was more prone to stent under-expansion and mal apposition, thus increasing the need for balloon post-dilatation [16]. Nonetheless, the stent length factor had no effect on post-stent dilatation in our investigation. The higher frequency of pre-dilatation, which reduces the need for post-stent dilatation, could account for this.
The current investigation found a strong relationship between SF-NR and the number of pre-dilatations, as well as a correlation with longer procedure times, higher radiation doses, and higher amounts of contrast. Grade II Killip classification, more pre-dilatations, longer procedure time, lower EF (%), and diastolic dysfunction all significantly affected the incidence of SF-NR in a univariate logistic regression analysis. Only a greater number of pre-dilatations, however, had a significant impact on the incidence of SF-NR on multivariate analysis. It should be mentioned that stent diameter and length had no discernible effects on the incidence of SF-NR.
Lack of pre-dilatation before stenting may reduce the risk of clots, plaque content displacement and subsequent distant embolization [17], we found that the higher the number of pre-dilatations, the higher the incidence of SF-NR (p value 0.013).
Higher pre-procedural thrombus grade was found to be an independent predictor for the SF-NR phenomena during primary PCI, according to a report by Alidoosti et al [18]. As per our findings, individuals with severe thrombus burden (≥ grade 3) had a greater percentage of SF-NR (77.2%) compared to those without SF-NR (72.7%). Nevertheless, the difference was not statistically significant (P value = 0.409). The low number of patients in the SF-NR group or the overuse of thrombus aspiration could be the cause of this.
However, Stone et al. highlighted the significance of baseline TIMI flow, noting that patients with a TIMI flow of 3 at baseline and had a 0% death rate at the 6-month follow-up after reperfusion, while patients with lower initial TIMI flow had a 3.6% mortality rate [19]. The current study found that patients with pre-TIMI ≤ 2 had a greater incidence of SF-NR (81.8% vs. 70.4%) compared to patients without SF-NR, while the difference was not statistically significant (P value=0.252).
Killip classification > I was linked to no-reflow, according to Yu et al [20] & Zhou et al [21], both of whom reported similar results to this study. However, we have already eliminated the Killip III and Killip IV classes from our analysis.
Longer stents have been linked to ST and in-stent restenosis, which can result in long-term MACEs. Ejiri K et al. also noted that patients with stent lengths greater than 50 mm had a considerably higher risk of MACEs [22]. Consistent with these findings, we discovered that patients with longer stents had a higher incidence of recurrent ACS in the three-month follow-up (P=0.003), but there was no significant difference in terms of other MACEs. Analogous results from a single-center prospective registry revealed that stent length had no effect on the short- or long-term outcomes of patients implanted with DES, significantly reducing the effects of lesion length on ISR rates and MACE-free survival [23].
In the current investigation, we discovered that patients with lower EF (%), diastolic dysfunction grade 2, side branches occlusion, longer procedure times, longer door-to-device times, final TIMI flow grades ≤2, and grade II Killip classification were more likely to experience MACEs. While stent length and diameter were not linked to an increase in MACEs in univariate analysis, we did find that patients with grade II Killip classification and those who had longer procedure times had a higher likelihood of developing MACEs in multivariate analysis.
Crucially, at the baseline, in-hospital, and three-month follow-up periods, we were unable to detect any discernible differences between the groups of stent diameters (nor angiographic data, nor MACE outcomes). These findings are in line with those of Adnan et al, who found no conclusive correlations between DES’ length and diameter and any of the clinical outcomes [6].
Although 2G-DESs have made progress in reducing procedural complications and MACEs, stent-related variables continue to impact primary PCI results. With primary PCI, longer stents are linked to a higher incidence of SF-NR. Long stents are more likely to experience restenosis, which manifests as repeated re-vascularization during follow-up and recurrent ACS. However, stent diameter has no impact on outcomes in the presence of this new generation of DESs, which eliminates the effect of stent diameter on restenosis.
The study was approved by the ethical committee of Assiut University, Faculty of Medicine under IRB number (17100890), approval date (14.01.2020), consent for participation and publication was taken.