Figure 1
Differences in laboratory test results during the follow-up period for the two study groups
| 6 months differences | Statin group (n=100) | Without statin group (n=56) | P value |
|---|---|---|---|
| 25 OH-vitamin D level (ng/dl) – medie (IQR) | +23,9 (+19,4 - +29,3) | +29,2 (+19,9- +29,7) | 0,0139* |
| Total Cholesterol (mg/dl) – mean (IQR) | -2,0 (-5 - -1) | -2,0 (-4 – 0,0) | 0,2491* |
| HDL cholesterol (mg/dl) – mean (IQR) | +1 (0 - +1) | 0 (0 - +1) | 0,0168* |
| LDL cholesterol (mg/dl) – mean (IQR) | -2,0 (-4 - -1) | -1 (-2,8 - 0) | 0,0013* |
| Triglycerides (mg/dl) – mean (IQR) | -1 (-2 - 0) | -0,5 (-1 - +1) | 0,0105* |
Baseline demographic and clinical characteristics_
| Characteristic | With Statin (n=100) | Without statin (n=54) | P value |
|---|---|---|---|
| Sex (M/F) | 40/60 | 16/38 | 0,2709* |
| Age (years) – mean (SD) | 60,3 (7,6) | 57,3 (13,1) | 0,0731** |
| BMI (kg/m2) – mean (SD) | 28,2 (7,3) | 30,3 (6,1) | 0,0739** |
| 25 OH-vitamin D level (ng/dl) – mean (SD) | 19,0 (9,7) | 17,2 (7,7) | 0,2401** |
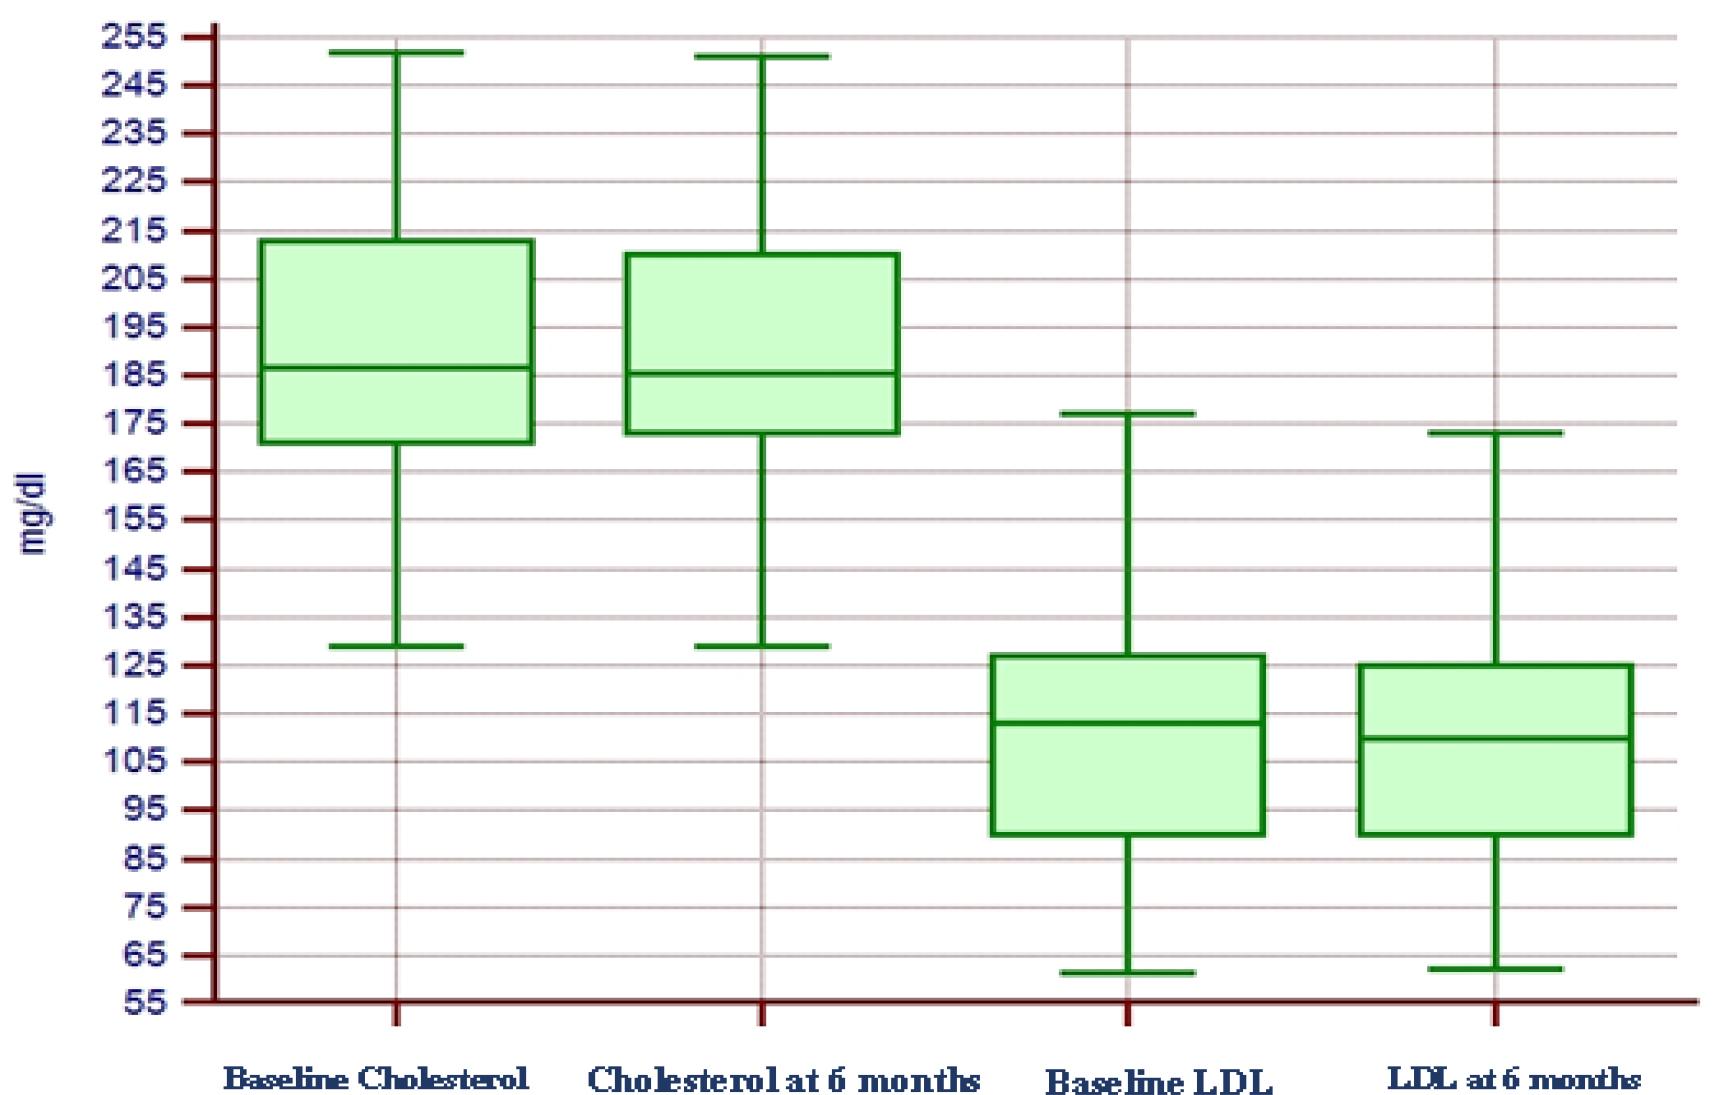
Laboratory results for patients treated without statins during the follow-up period_
| Parameter | Baseline | After 6 months of treatment | P value |
|---|---|---|---|
| 25 OH-vitamin D level (ng/dl) – mean (SD) | 17,3 (7,7) | 43,2 (9,8) | <0,0001* |
| Total cholesterol (mg/dl) – mean (IQR) | 186,5 (171-213) | 185,5 (173-210) | <0,0001** |
| HDL cholesterol (mg/dl) – mean(IQR) | 54,5 (46-62) | 54,5 (47-63,3) | 0,0697** |
| LDL cholesterol (mg/dl) – mean (IQR) | 113 (90-127) | 110 (90-125) | <0,0001** |
| Triglycerides (mg/dl) – mean (IQR) | 91,5 (66-113) | 93 (67-115) | 0,9578** |