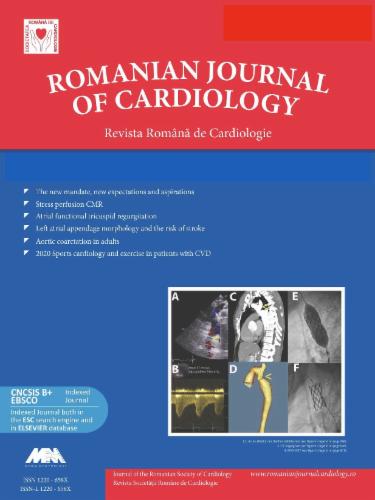
Figure 1
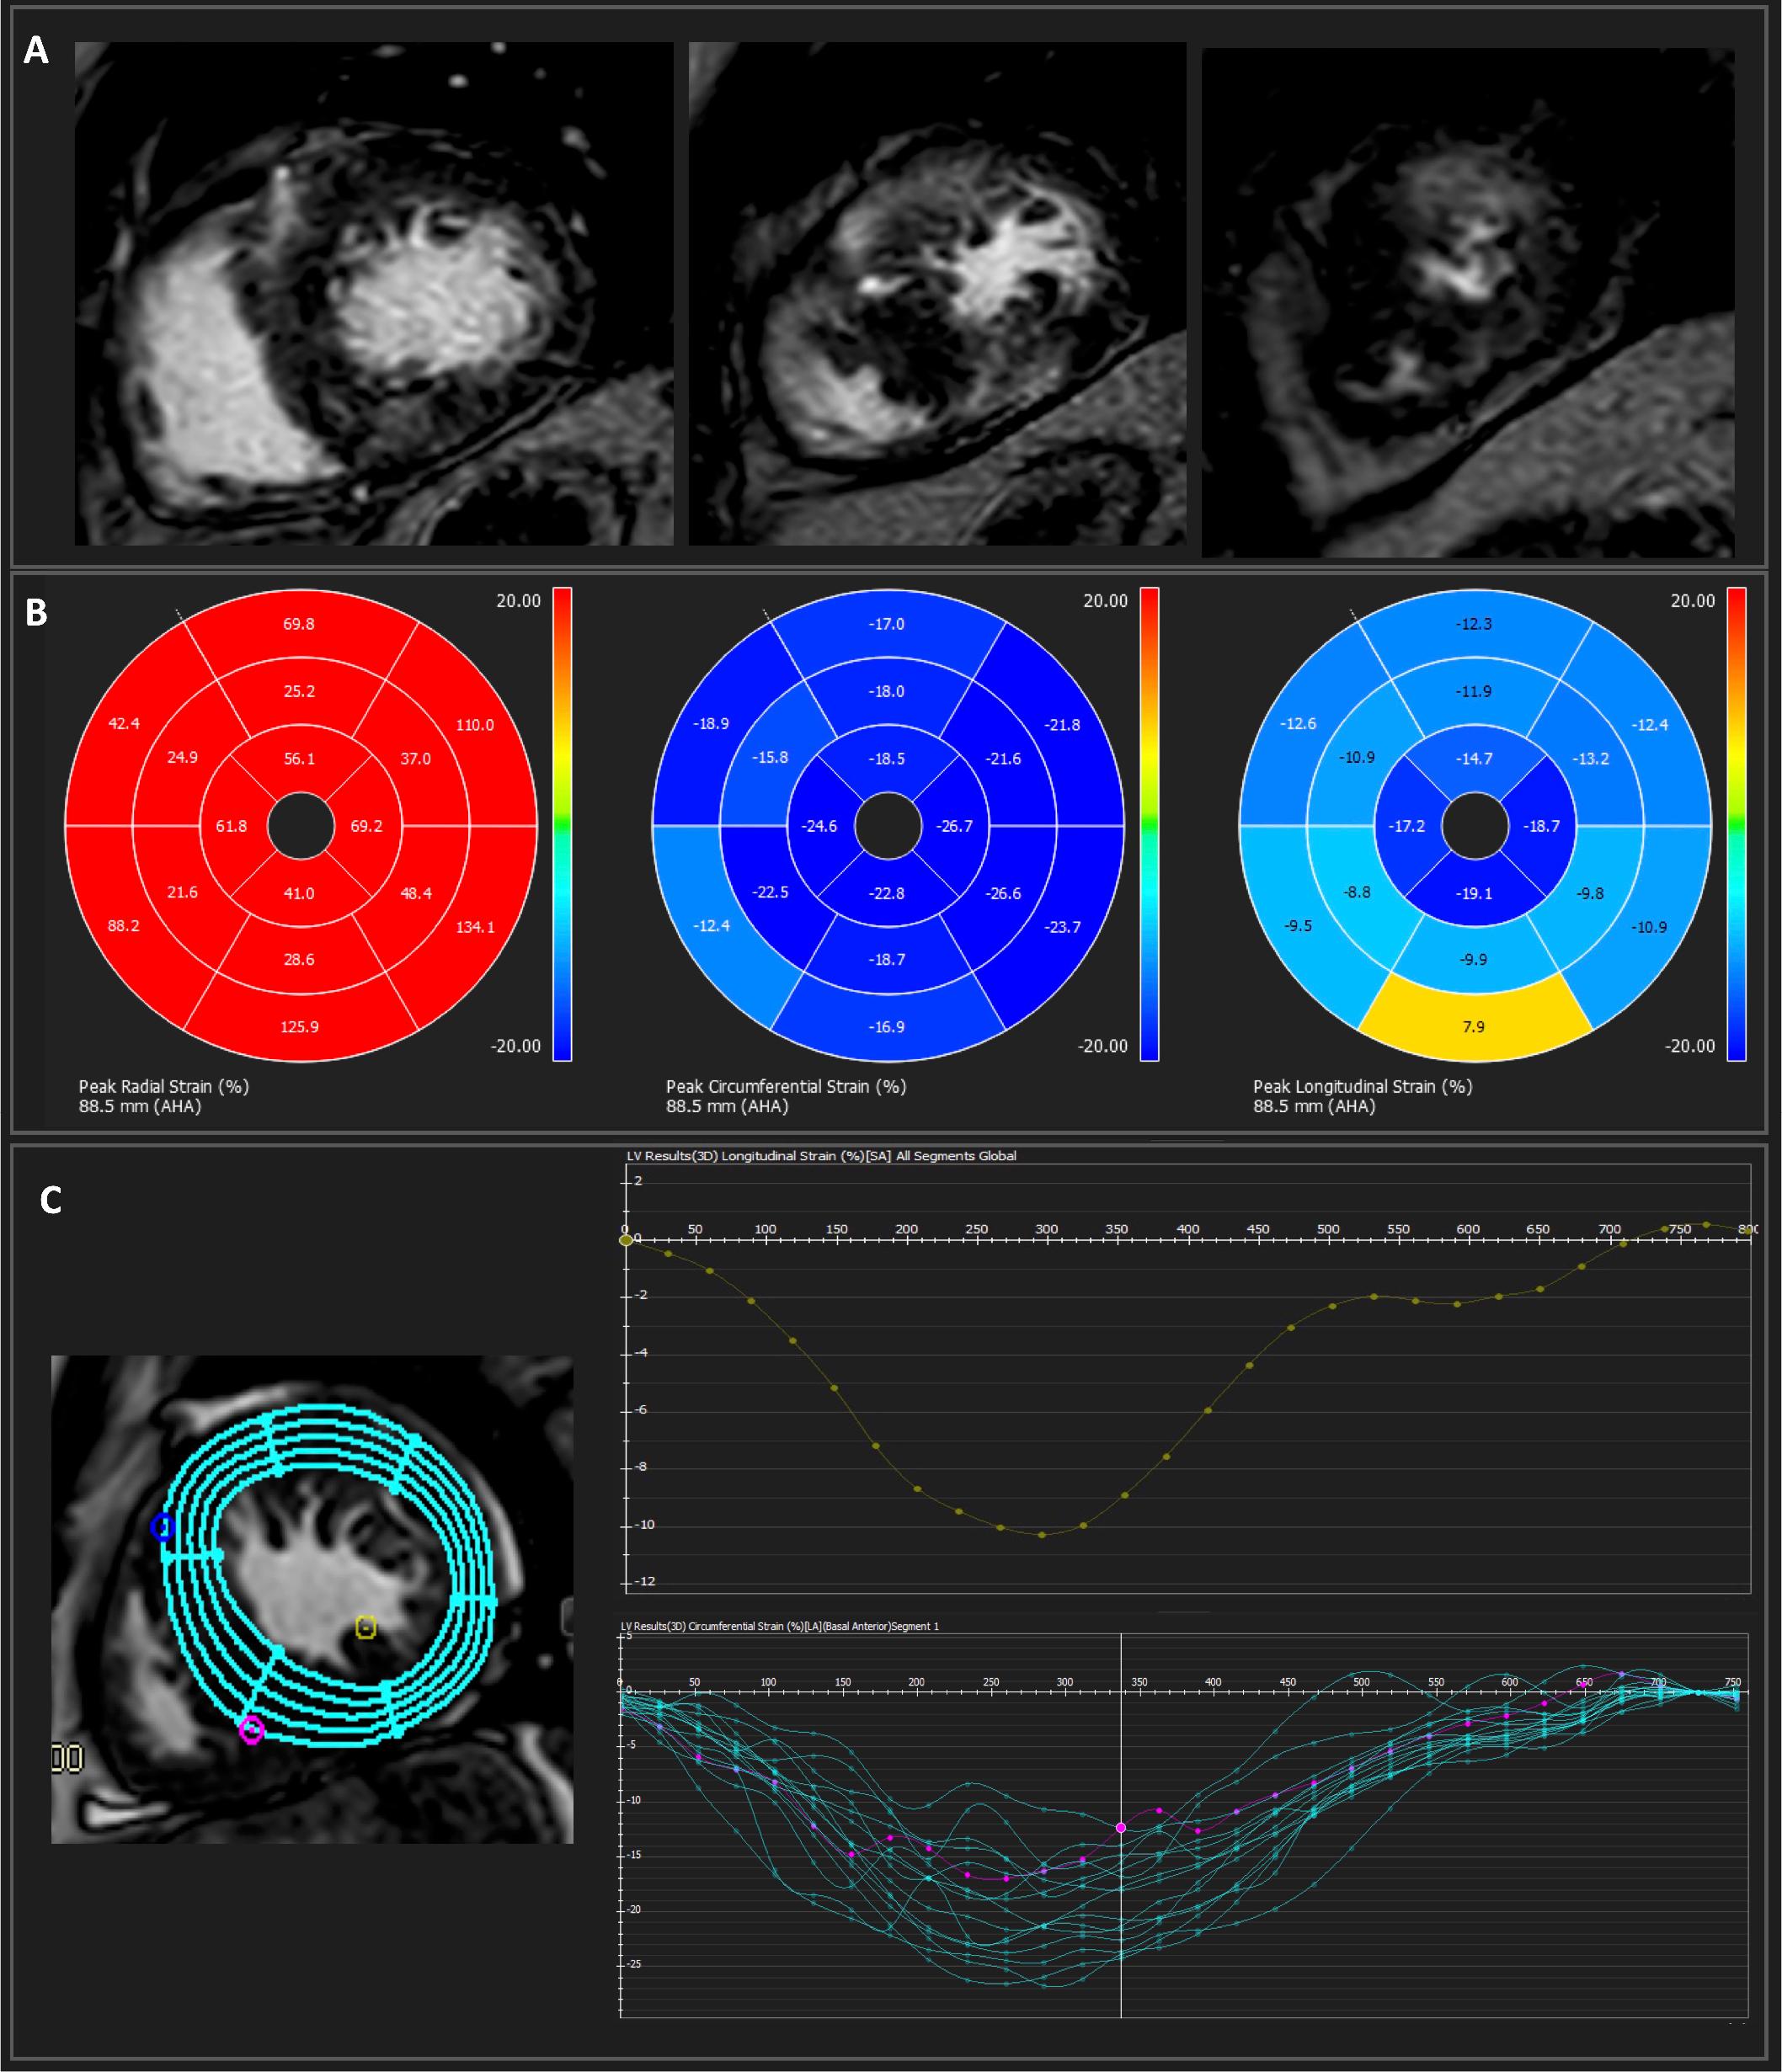
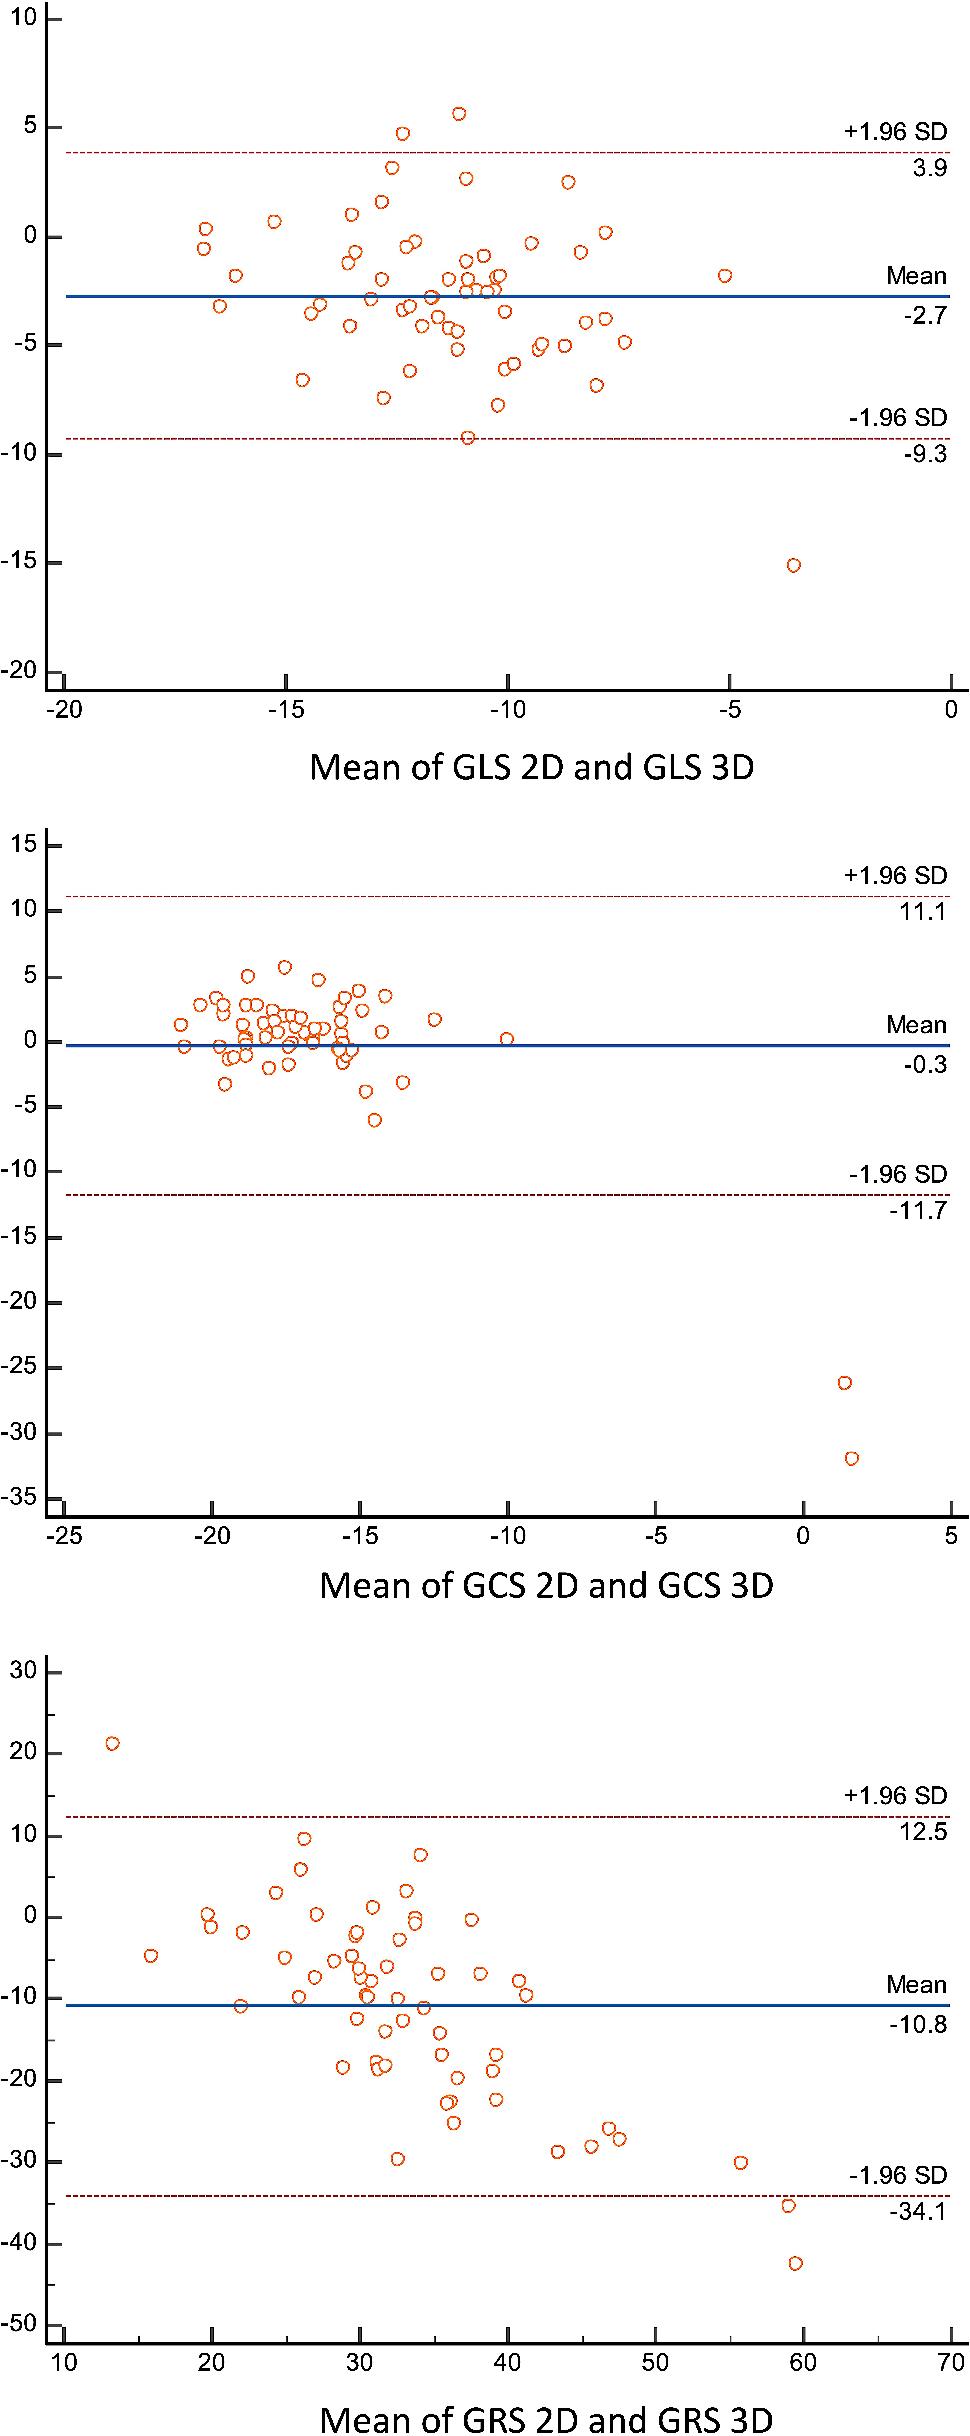
Figure 2
CMR characteristics of HCM patients
| Variable | HCM patients (n=60) |
|---|---|
| Age (years), mean ± SD | 58.2 ± 15.8 |
| Male, n (%) | 40 (66.7) |
| BMI (g/m2), mean ± SD | 29 ± 6.4 |
| Distribution of LVH, n (%) | |
| Septal | 34 (56.7) |
| Apical | 15 (25) |
| Anterior | 4 (6.7) |
| Mid-ventricular | 2 (3.3) |
| Lateral | 1 (1.7) |
| Multiple segments | 4 (6.7) |
| MWT, (mm), mean ± SD | 16.9 ± 4.4 |
| Number segments LVH, mean ± SD | 4.3 ± 2.4 |
| Spiral pattern LVH, n (%) | 16 (26.7) |
| Papillary muscles LVH, n (%) | 27 (45) |
| LV intracavitary obstruction, n (%) | 11 (18.3) |
| Aneurysms, n (%) | 6 (10.2) |
| Crypts, n (%) | 13 (21.7) |
| Presence of LGE, n (%) | 43 (72.9%) |
| Number segments LGE, median [IQR] | 2 [0-4] |
| Presence of LGE in segments with LVH, n (%) | 38 (64.4) |
| LVEDV (mL), mean ± SD | 159.9 ± 44 |
| LVEDV index (mL/m2), mean ± SD | 79.6 ± 19.7 |
| LVESV (mL), mean ± SD | 58.3 ± 25 |
| LVESV index (mL/m2), mean ± SD | 29.8 ± 13.3 |
| LVEF (%), mean ± SD | 64.4 ± 9.8 |
| SV (mL), mean ± SD | 101.6 ± 28.7 |
| SV index (mL/m2), mean ± SD | 51 ± 11.6 |
| LV mass (g), median [IQR] | 147 [109.5 – 187] |
| LV mass index (g/m2), median [IQR] | 71.9 [57.2 – 90.4] |
| RVEDV (mL), mean ± SD | 139.1 ± 41.8 |
| RVEDV index (mL/m2), mean ± SD | 69.1± 16.6 |
| RVESV (mL), mean ± SD | 56.9 ± 22.4 |
| RVESV index (mL/m2), mean ± SD | 28 ± 9.3 |
| RVEF, % (mean ± SD) | 58.8 ± 12.8 |
| LA area (cm2), median [IQR] | 28.5 [25 – 31.5] |
| GLS 3D, % (mean ± SD) | -9.9 ± 3.5 |
| GLS 2D, % (mean ± SD) | -12.6 ± 2.6 |
| GCS 3D, % (mean ± SD) | -16.3 ± 6.6 |
| GCS 2D, % (mean ± SD) | -16.6 ± 2.4 |
| GRS 3D, % (mean ± SD) | 38.7 ± 13.9 |
| GRS 2D, % (mean ± SD) | 27.9 ± 6 |
Comparison between 3D FT parameters between HCM and healthy volunteers_
| 3D FT parameter | HCM | Healthy volunteers11 | p value |
|---|---|---|---|
| GLS 3D | -9.9 ± 3.5 | -14.6 ± 2.7 | <0.0001 |
| GCS 3D | -16.3 ± 6.6 | -17.6 ± 2.6 | 0.08 |
| GRS 3D | 38.7 ± 13.9 | 47.4 ± 12.9 | 0.0001 |
Correlations between 3D strain and other CMR parameters
| GCS 3D | GLS 3D | GRS 3D | |
|---|---|---|---|
| Age | 0.15 | 0.12 | -0.08 |
| MWT | 0.44 | -0.02 | -0.02 |
| LV mass index | 0.35 | 0.20 | -0.21 |
| Number of segments with LVH | -0.02 | 0.07 | -0.11 |
| Number of segments with LGE | 0.11 | 0.03 | -0.05 |
| LVEDV index | 0.09 | 0.12 | -0.14 |
| LVESV index | 0.49 | 0.02 | -0.20 |
| SV index | 0.02 | 0.09 | 0 |
| RVEDV index | -0.05 | 0.23 | 0.13 |
| RVEF | -0.02 | 0.10 | 0 |
| LVEF | -0.18 | -0.03 | 0.23 |
CMR characteristics of HCM phenotypes
| Variable | Septal HCM (n=34) | Apical HCM (n=15) | P value |
|---|---|---|---|
| Age (years), mean ± SD | 59.7 ± 14.8 | 60.4 ± 14.8 | 0.87 |
| BMI (g/m2), mean ± SD | 28.6 ± 5.9 | 28.6 ± 6.1 | 0.99 |
| MWT, (mm), mean ± SD | 16.8 ± 4.8 | 15.2 ± 1.7 | 0.23 |
| Number segments LVH, mean ± SD | 3.6 ± 2.2 | 5.3 ± 0.7 | 0.006 |
| Spiral pattern LVH, n (%) | 12 (35.3) | 1 (6.7) | 0.04 |
| Papillary muscles LVH, n (%) | 13 (28.2) | 9 (60) | 0.16 |
| LV intracavitary obstruction, n (%) | 6 (17.6) | 2 (13.3) | 0.73 |
| Aneurysms, n (%) | 2 (5.9) | 3 (20) | 0.12 |
| Crypts, n (%) | 10 (29,4) | 0 (0) | 0.06 |
| Presence of LGE, n (%) | 20 (58.8) | 9 (60) | 0.97 |
| Number segments LGE, median [IQR] | 1 [0-4] | 1 [0-2] | 0.95 |
| Presence of LGE in segments with LVH, n (%) | 19 (55.9) | 10 (66.7) | 0.55 |
| LVEDV (mL), mean ± SD | 164 ± 46.1 | 152.1 ± 45.7 | 0.41 |
| LVEDV index (mL/m2), mean ± SD | 81.5 ± 22.7 | 76.1 ± 15.3 | 0.41 |
| LVESV (mL), mean ± SD | 59.9 ± 25.5 | 58.9 ± 28.6 | 0.9 |
| LVESV index (mL/m2), mean ± SD | 31.2 ± 14.9 | 28.9 ± 11.2 | 0.6 |
| LVEF (%), mean ± SD | 64.7 ± 8.7 | 62.3 ± 11.8 | 0.42 |
| SV (mL), mean ± SD | 104.1 ± 26.4 | 93.2 ± 30.5 | 0.21 |
| SV index (mL/m2), mean ± SD | 51.9 ± 11.6 | 47.2 ± 12.7 | 0.21 |
| LV mass (g), median [IQR] | 155.5 [111 - 188] | 146 [122.5 - 163] | 0.56 |
| LV mass index (g/m2), median [IQR] | 76.1 [61.8 – 90.2] | 73.2 [57.2 – 89.5] | 0.78 |
| RVEDV (mL), mean ± SD | 143.1 ± 39.5 | 139.1 ± 43.9 | 0.75 |
| RVEDV index (mL/m2), mean ± SD | 71.1± 16.3 | 69.4± 15.1 | 0.73 |
| RVESV (mL), mean ± SD | 62.7 ± 21 | 54.4 ± 25.7 | 0.24 |
| RVESV index (mL/m2), mean ± SD | 30.9 ± 8.5 | 26.6 ± 10 | 0.13 |
| RVEF, % (mean ± SD) | 55.3 ± 13.1 | 62.6 ± 8.9 | 0.054 |
| LA area (cm2), median [IQR] | 28.5 [25-32] | 30 [26.3-30.1] | 0.72 |
| GLS 3D, % (mean ± SD) | -10.5 ± 2.9 | -7.4 ± 4.1 | 0.004 |
| GLS 2D, % (mean ± SD) | -12.9 ± 2 | -11.7 ± 3.2 | 0.14 |
| GCS 3D, % (mean ± SD) | -15.1 ± 8.3 | -18.4 ± 2.7 | 0.14 |
| GCS 2D, % (mean ± SD) | -16.7 ± 2.2 | -16.4 ± 2.7 | 0.65 |
| GRS 3D, % (mean ± SD) | 39.8 ± 12.3 | 38.8 ± 15.9 | 0.8 |
| GRS 2D, % (mean ± SD) | 27.8 ± 5.7 | 28 ± 6.9 | 0.94 |