
Hypertrophic cardiomyopathy (HCM) is characterized by myocardial hypertrophy, cellular disarray and fibrosis. Myocardial deformation is a highly sensitive marker for early-stage myocardial dysfunction with an independent predictive value in HCM1. Abnormal global longitudinal strain (GLS) by speckle tracking echocardiography (STE) and abnormal global circumferential strain (GCS) by cardiac magnetic resonance (CMR) tagging are associated with adverse prognosis2,3.
Although STE is a widely available and powerful diagnostic tool to assess myocardial dysfunction even in the presence of preserved left ventricular ejection fraction (LVEF), an inadequate acoustic window and abnormal geometry occurring in the setting of HCM can impede its utilization. In these cases, CMR imaging can be used as an alternative.
Myocardial tagging is considered the CMR reference standard for quantitative wall-motion assessment. However, it requires the acquisition of dedicated CMR images at the cost of additional scan time. Feature-tracking imaging (FT), which is based on postprocessing of standard cine images to derive strain values without the need to acquire additional data, is a promising alternative4, which shows good agreement with myocardial tagging5.
The conventional approach to myocardial strain measurement using FT-CMR involves 2-dimensional (2D) feature-tracking. However, the accuracy of 2D strain analysis may be affected by the through-plane loss of features. Additionally, the singleplane measurement of circumferential and radial strain from shortaxis slices, as well as longitudinal strain from long-axis slices, may not provide a true reflection of global myocardial function. For this reason, new algorithms have been developed recently that enable three-dimensional (3D) tracking of deformation. 2D deformation parameters are determined using a set of points positioned along the central line between the endocardial and epicardial borders of individual slices, which are tracked by a predefined algorithm throughout the cardiac cycle. The 3D FT model on the other hand combines endocardial and epicardial borders tracked by the 2D algorithm from both short- and long-axis slices, without mandating further scanning time6,7. Overall, research using CMR consistently demonstrates reduced GLS in patients with HCM, while results for GCS and GRS are inconsistent8-10. To date, 2D and 3D FT have not been compared in patients with HCM.
The aims of this study were 1) to determine whether 2D and 3D FT are equivalent, 2) to compare 3D FT-CMR values in HCM and healthy volunteers and 3) to compare FT-CMR in most frequent HCM phenotypes.
Consecutive patients with HCM and LVEF>55% were included in the study. All patients had a diagnosis of HCM based on conventional criteria and were referred for a clinically indicated CMR examination between July 2022 and December 2023. Exclusion criteria were the presence of abnormal loading conditions, such as arterial hypertension (defined as known blood pressure values > 140/90mmHg), more than mild aortic stenosis and coarctation of the aorta, the presence of infiltrative or storage diseases and known ischemic heart disease (significant stenosis in a major coronary artery, previous myocardial infarction or revascularization). Demographic data collected included age, sex, height, weight, body surface area (BSA), body mass index (BMI) and blood pressure (BP). The study was carried out in agreement with the ethical guidelines of the 1975 Declaration of Helsinki, and written informed consent was obtained from all patients.
CMR studies were conducted using Philips 1.5T Ingenia and Philips 3T Achieva scanners. The study protocol included the following acquisitions: 1) cine steady state free precession (SSFP) imaging with retrospective electrocardiographic gating in three long- axis planes and a multi-slice short-axis stack covering the heart from apex to base. Typical scan parameters were: repetition time 3 ms, echo time 1.5 ms, flip angle 60 degrees, field of view 350 mm, inplane spatial resolution 1.5 × 1.4 mm2, slice thickness 8 mm with 2 mm gap, minimum 25 phases per cardiac cycle, temporal resolution 40–50 ms, 2) motion corrected bright-blood late gadolinium enhancement (LGE) images in the same imaging planes as for cine imaging with a phase-sensitive-recovery sequence and additional dark-blood LGE images when deemed necessary.
Image analysis was conducted using cvi42 software (Circle Cardiovascular Imaging, Calgary, Alberta, Canada). Volumes and mass were calculated after delineation of endocardial and epicardial borders in short-axis cine images at the end of systole and diastole after excluding trabeculations. Left atrial (LA) area was obtained by delineation of atrial borders in long-axis cine images at end-systole. LGE was defined as the presence of visual enhancement in at least one segment in either two perpendicular planes or in both bright and dark-blood images with non-ischaemic distribution, with the exception of right ventricular insertion point fibrosis.
CMR FT parameters included left ventricular (LV) GLS, GCS and GRS, which were calculated using both 2D and 3D FT-CMR. 2D GCS and GRS short-axis (SAX) were obtained at the mid LV in the short axis view, and 2D GLS was obtained from the 4 chamber image by drawing the endocardial and epicardial borders in the end- diastolic frame. 3D GLS, GCS and GRS were obtained by drawing the endocardial and epicardial borders in the end-diastolic frame of all short- and long-axis slices. FT strain on cvi42 was derived by using 2D and 3D myocardial models, as previously described and validated6,7. Briefly, 2D deformation extent is calculated using a set of points positioned along the midline between the endocardial and epicardial borders, with these borders being tracked by a predefined algorithm throughout the cardiac cycle. The 3D model of the myocardium is derived based on combining the endocardial and epicardial borders that are tracked by the 2D algorithm in short- and long-axis planes6,7. The accuracy of tracking was manually verified by checking the tracking of the endocardial and epicardial borders (Fig. 1).
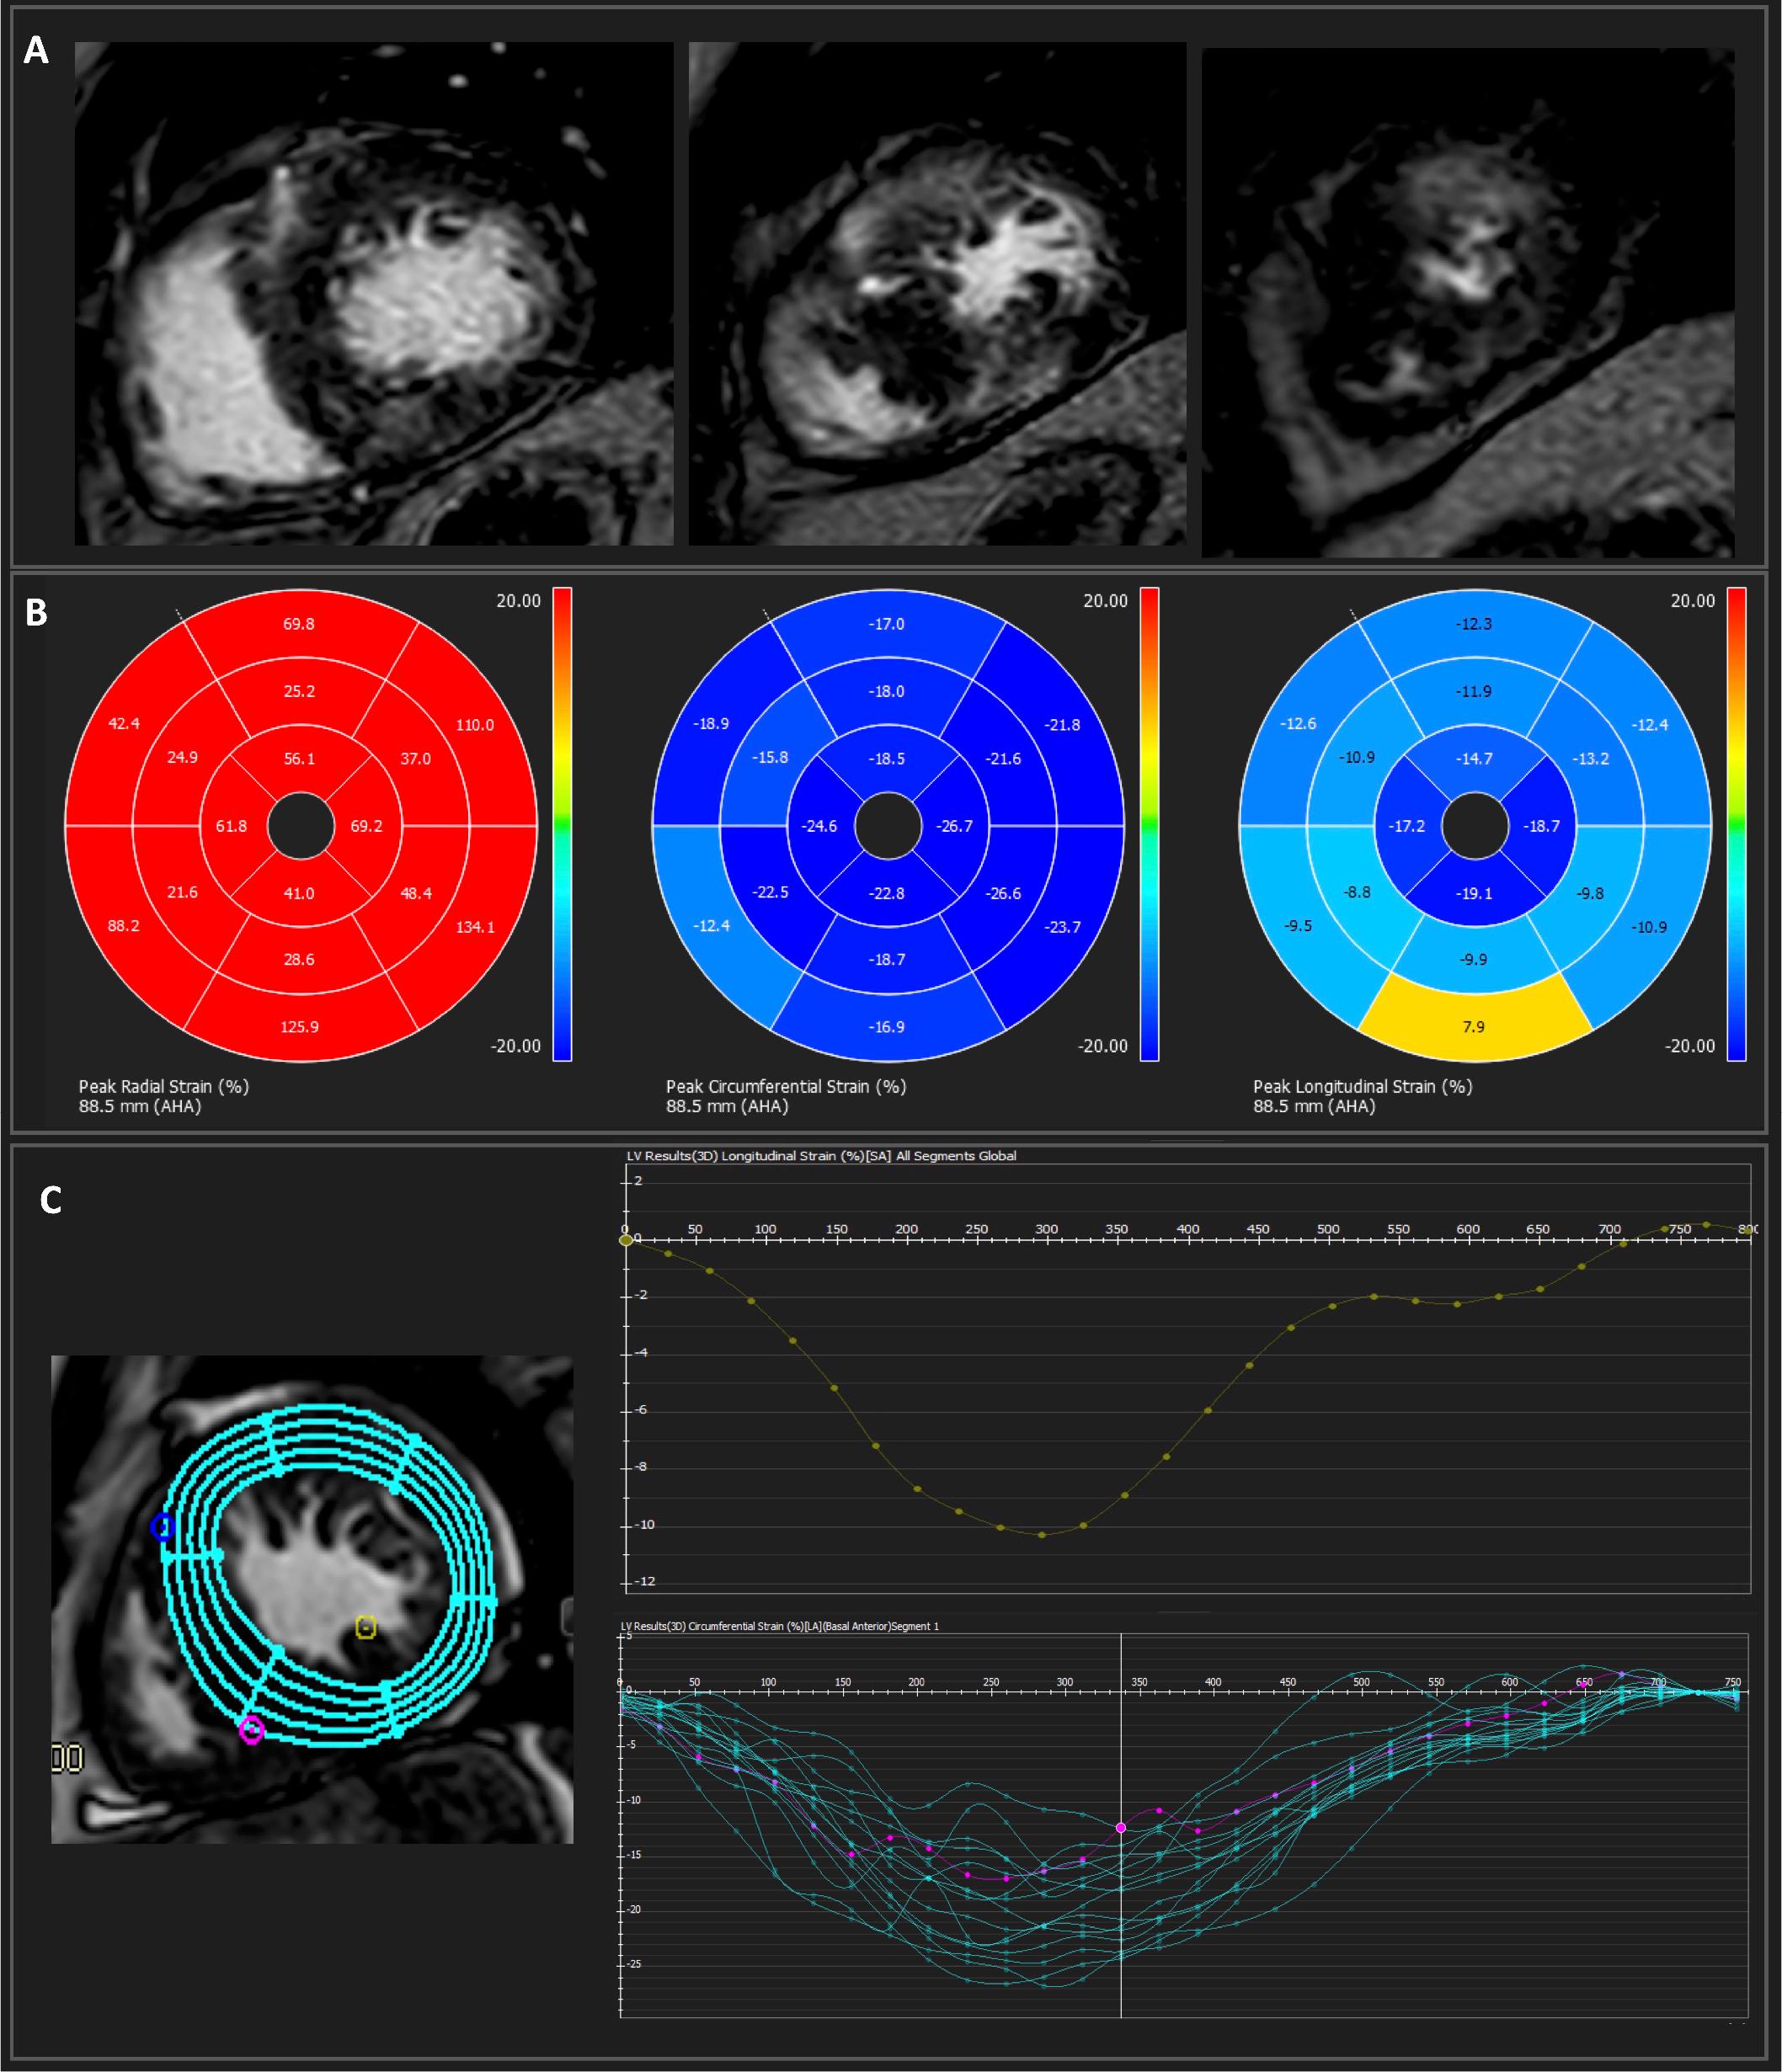
3D feature tracking analysis in HCM.
Example of 3D feature tracking measurements in a patient with HCM and fibrosis: The upper panel (A) shows three short-axis slices highlighting regions of fibrosis. The middle panel (B) presents the corresponding bullseye maps for each type of strain. Panel C demonstrates an example of myocardial tracking in the short-axis (left), global longitudinal strain curve (upper right), and individual circumferential strain values by segment (lower right).
Variables were reported as either mean ±SD / median [IQR] or frequencies depending on the type and distribution of the data. The Kolmogorov-Smirnov test was used to assess normality. Concordance, bias and limits of agreement between 2D and 3D feature tracking imaging methods were tested using Bland- Altman analysis. The methods were compared using pair-wise t-tests. Correlations between 3D strain and other CMR parameters were tested using the Spearman correlation coefficient and were represented as a correlogram. Comparison to values obtained for healthy volunteers in a study11 using the same software was performed using t-tests for means. Patients were categorised into two groups based on the most frequent HCM phenotype (septal and apical). Continuous clinical and CMR characteristics were compared using t-tests for normally distributed data, and the Mann-Whitney test otherwise. The chi2 test was used for categorical data. Statistical analysis was conducted using MedCalc Statistical Software version 22.016 (MedCalc Software Ltd., Ostend, Belgium; http://www.medcalc.org;2023). A p-value of <0.05 was considered significant.
A total of 60 HCM patients were included in the study. The mean age of the patients was 58.2 ± 15.8 years, and 40 (66.7%) were male. Table 1 shows the CMR characteristics of the patients. FT analysis was feasible in all individuals.
| Variable | HCM patients (n=60) |
|---|---|
| Age (years), mean ± SD | 58.2 ± 15.8 |
| Male, n (%) | 40 (66.7) |
| BMI (g/m2), mean ± SD | 29 ± 6.4 |
| Distribution of LVH, n (%) | |
| Septal | 34 (56.7) |
| Apical | 15 (25) |
| Anterior | 4 (6.7) |
| Mid-ventricular | 2 (3.3) |
| Lateral | 1 (1.7) |
| Multiple segments | 4 (6.7) |
| MWT, (mm), mean ± SD | 16.9 ± 4.4 |
| Number segments LVH, mean ± SD | 4.3 ± 2.4 |
| Spiral pattern LVH, n (%) | 16 (26.7) |
| Papillary muscles LVH, n (%) | 27 (45) |
| LV intracavitary obstruction, n (%) | 11 (18.3) |
| Aneurysms, n (%) | 6 (10.2) |
| Crypts, n (%) | 13 (21.7) |
| Presence of LGE, n (%) | 43 (72.9%) |
| Number segments LGE, median [IQR] | 2 [0-4] |
| Presence of LGE in segments with LVH, n (%) | 38 (64.4) |
| LVEDV (mL), mean ± SD | 159.9 ± 44 |
| LVEDV index (mL/m2), mean ± SD | 79.6 ± 19.7 |
| LVESV (mL), mean ± SD | 58.3 ± 25 |
| LVESV index (mL/m2), mean ± SD | 29.8 ± 13.3 |
| LVEF (%), mean ± SD | 64.4 ± 9.8 |
| SV (mL), mean ± SD | 101.6 ± 28.7 |
| SV index (mL/m2), mean ± SD | 51 ± 11.6 |
| LV mass (g), median [IQR] | 147 [109.5 – 187] |
| LV mass index (g/m2), median [IQR] | 71.9 [57.2 – 90.4] |
| RVEDV (mL), mean ± SD | 139.1 ± 41.8 |
| RVEDV index (mL/m2), mean ± SD | 69.1± 16.6 |
| RVESV (mL), mean ± SD | 56.9 ± 22.4 |
| RVESV index (mL/m2), mean ± SD | 28 ± 9.3 |
| RVEF, % (mean ± SD) | 58.8 ± 12.8 |
| LA area (cm2), median [IQR] | 28.5 [25 – 31.5] |
| GLS 3D, % (mean ± SD) | -9.9 ± 3.5 |
| GLS 2D, % (mean ± SD) | -12.6 ± 2.6 |
| GCS 3D, % (mean ± SD) | -16.3 ± 6.6 |
| GCS 2D, % (mean ± SD) | -16.6 ± 2.4 |
| GRS 3D, % (mean ± SD) | 38.7 ± 13.9 |
| GRS 2D, % (mean ± SD) | 27.9 ± 6 |
2D, two-dimensional; 3D, three-dimensional; BMI, body mass index; GCS, global circumferential strain; GLS, global longitudinal strain; GRS, global radial strain; LA, left atrial; LAX, long axis; LGE, late gadolinium enhancement; LVEDV, left ventricular end-diastolic volume; LVEF, left ventricular ejection fraction; LVESV, left ventricular end-systolic volume; LVH, left ventricular hypertrophy; MWT, maximum wall thickness; RVEDV, right ventricular end-diastolic volume; RVEF, right ventricular ejection fraction; RVESV, right ventricular end-systolic volume; SAX, short axis; SV, stroke volume.
Regarding the distribution of LV hypertrophy (LVH), most of the patients had septal HCM (56.7%), with 25% showing apical HCM. The mean number of segments with LVH was 4.3 ± 2.4. Maximum wall thickness (MWT) was 16.9 ± 4.4mm, and LV mass index was 71.9 [57.2 – 90.4] g/m2. Most of the patients also exhibited other HCM features, such as a spiral pattern of LVH (26.7%), papillary muscle hypertrophy (45%), LV intracavitary obstruction (18.3%), aneurysms (10.2%) and crypts (21.7%). Seventy-two percent of patients exhibited focal fibrosis in 2 [0-4] segments, with 64.4% of these being limited to segments with LVH.
Mean LV end-diastolic volume was 79.6 ± 19.7 ml/m2, LV end- systolic volume was 29.8 ± 13.3 ml/m2 and LV ejection fraction was 64.4 ± 9.8%. Mean RVEF was 58.8 ± 12.8%, and most patients presented borderline dilated LA (area 28.5 [25 – 31.5] cm2).
Mean GLS 2D and 3D values were -12.6% ± 2.6 and -9.9±3.5, mean GCS 2D and 3D were-16.6% ± 2.4 and -16.3% ± 6.6 and mean GRS 2D and 3D values were 27.9% ± 6 and 38.7% ± 13.9, respectively.
Concordance between 2D and 3D FT is shown in Fig. 2. Strain evaluated using 3D FT was consistently lower compared to 2D FT. The highest level of agreement was noted between the 2D and 3D values of GCS, with a mean difference of -0.3% (95% CI -1.81 to 1.2, p=0.68). Mean difference for GLS was of -2.7% (95% CI -3.56 to -1.82, p<0.0001). GRS exhibited low agreement between 2D and 3D measurements, with a mean difference of -10.8% (95% CI -13.91 to -7.8, p-< 0.0001).
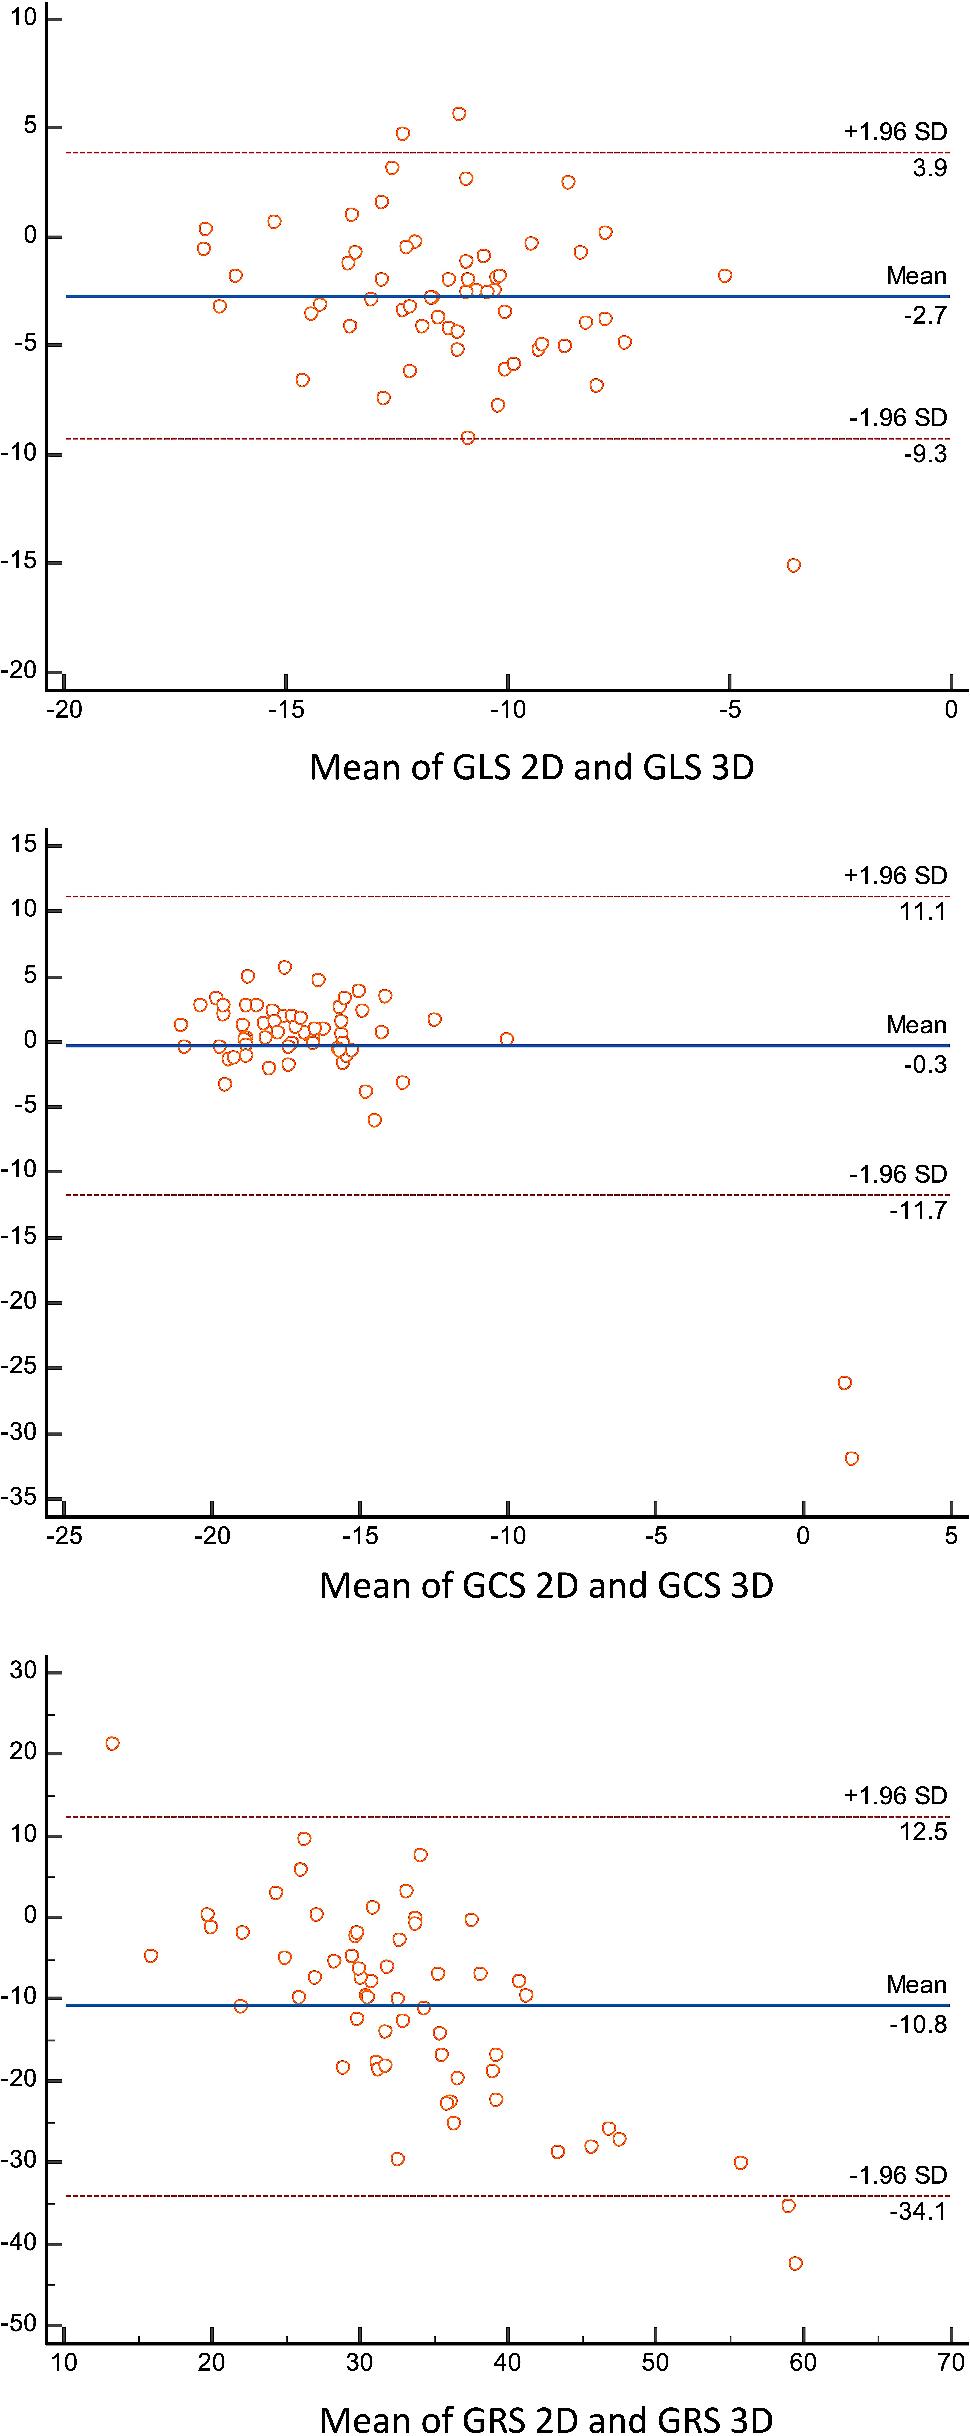
Concordance between 2D and 3D strain measurements. GCS, global circumferential strain; GLS, global longitudinal strain; GRS, global radial strain; LAX, long axis; SAX, short axis.
Among the 3D FT measures, only GCS 3D showed a correlation with LV mass index (R=0.35), MWT (R=0.44) and LVESVi (R=0.49), as seen in table 2.
| GCS 3D | GLS 3D | GRS 3D | |
|---|---|---|---|
| Age | 0.15 | 0.12 | -0.08 |
| MWT | 0.44 | -0.02 | -0.02 |
| LV mass index | 0.35 | 0.20 | -0.21 |
| Number of segments with LVH | -0.02 | 0.07 | -0.11 |
| Number of segments with LGE | 0.11 | 0.03 | -0.05 |
| LVEDV index | 0.09 | 0.12 | -0.14 |
| LVESV index | 0.49 | 0.02 | -0.20 |
| SV index | 0.02 | 0.09 | 0 |
| RVEDV index | -0.05 | 0.23 | 0.13 |
| RVEF | -0.02 | 0.10 | 0 |
| LVEF | -0.18 | -0.03 | 0.23 |
3D, three-dimensional; GCS, global circumferential strain; GLS, global longitudinal strain; GRS, global radial strain; LGE, late gadolinium enhancement; LVEDV, left ventricular end-diastolic volume; LVEF, left ventricular ejection fraction; LVESV, left ventricular end-systolic volume; LVH, left ventricular hypertrophy; MWT, maximum wall thickness; RVEDV, right ventricular end-diastolic volume; RVEF, right ventricular ejection fraction; SV, stroke volume.
Compared to the range values obtained in healthy volunteers11, patients with HCM showed significantly reduced GLS 3D (9.9 ± 3.5 vs. -14.6 ± 2.7, p<0.0001) and GRS 3D (38.7 ± 13.9 vs. 47.4 ± 12.9, p=0.0001), while GCS 3D only showed a trend to reduced values (-16.3 ± 6.6 vs. 17.6 ± 2.6, p=0.08), as seen in Table 3.
| 3D FT parameter | HCM | Healthy volunteers11 | p value |
|---|---|---|---|
| GLS 3D | -9.9 ± 3.5 | -14.6 ± 2.7 | <0.0001 |
| GCS 3D | -16.3 ± 6.6 | -17.6 ± 2.6 | 0.08 |
| GRS 3D | 38.7 ± 13.9 | 47.4 ± 12.9 | 0.0001 |
GCS, global circumferential strain; GLS, global longitudinal strain; GRS, global radial strain.
Table 4 shows the comparison of CMR characteristics between patients with septal and apical HCM as the two most common subtypes in our cohort. There was no difference regarding age or BMI between the two HCM phenotypes. In terms of standard CMR parameters, patients with apical HCM had a higher number of segments with LVH (5.3 ± 0.7 vs. 3.6 ± 2.2, p=0.006) but were less likely to exhibit a spiral pattern of LVH (6.7 vs. 35.3%, p=0.04). A high proportion of patients in both groups was found to have focal fibrosis (60 vs. 58.8%, p=0.97), but there was no difference regarding the number of segments with LGE or the presence of LGE in segments with LVH (66.7 vs. 55.9%, p=0.55). Right and left ventricular volumetric measurements were similar between groups. Both groups showed borderline LA dilatation but without significant difference according to phenotype (30 [26.3-30.1] vs. 28.5 [25-32] cm2, p=0.72). Regarding FT parameters, those with apical HCM only had significantly more reduced GLS 3D compared to patients with septal LVH (-7.4% ± 4.1 vs. -10.5% ± 2.9, p=0.004), while there was no difference in terms of GCS 3D (-18.4% ± 2.7 vs. -15.1% ± 8.3, p=0.14), GRS 3D (38.8% ± 15.9 vs. 39.8% ± 12.3, p=0.8), and 2D parameters.
| Variable | Septal HCM (n=34) | Apical HCM (n=15) | P value |
|---|---|---|---|
| Age (years), mean ± SD | 59.7 ± 14.8 | 60.4 ± 14.8 | 0.87 |
| BMI (g/m2), mean ± SD | 28.6 ± 5.9 | 28.6 ± 6.1 | 0.99 |
| MWT, (mm), mean ± SD | 16.8 ± 4.8 | 15.2 ± 1.7 | 0.23 |
| Number segments LVH, mean ± SD | 3.6 ± 2.2 | 5.3 ± 0.7 | 0.006 |
| Spiral pattern LVH, n (%) | 12 (35.3) | 1 (6.7) | 0.04 |
| Papillary muscles LVH, n (%) | 13 (28.2) | 9 (60) | 0.16 |
| LV intracavitary obstruction, n (%) | 6 (17.6) | 2 (13.3) | 0.73 |
| Aneurysms, n (%) | 2 (5.9) | 3 (20) | 0.12 |
| Crypts, n (%) | 10 (29,4) | 0 (0) | 0.06 |
| Presence of LGE, n (%) | 20 (58.8) | 9 (60) | 0.97 |
| Number segments LGE, median [IQR] | 1 [0-4] | 1 [0-2] | 0.95 |
| Presence of LGE in segments with LVH, n (%) | 19 (55.9) | 10 (66.7) | 0.55 |
| LVEDV (mL), mean ± SD | 164 ± 46.1 | 152.1 ± 45.7 | 0.41 |
| LVEDV index (mL/m2), mean ± SD | 81.5 ± 22.7 | 76.1 ± 15.3 | 0.41 |
| LVESV (mL), mean ± SD | 59.9 ± 25.5 | 58.9 ± 28.6 | 0.9 |
| LVESV index (mL/m2), mean ± SD | 31.2 ± 14.9 | 28.9 ± 11.2 | 0.6 |
| LVEF (%), mean ± SD | 64.7 ± 8.7 | 62.3 ± 11.8 | 0.42 |
| SV (mL), mean ± SD | 104.1 ± 26.4 | 93.2 ± 30.5 | 0.21 |
| SV index (mL/m2), mean ± SD | 51.9 ± 11.6 | 47.2 ± 12.7 | 0.21 |
| LV mass (g), median [IQR] | 155.5 [111 - 188] | 146 [122.5 - 163] | 0.56 |
| LV mass index (g/m2), median [IQR] | 76.1 [61.8 – 90.2] | 73.2 [57.2 – 89.5] | 0.78 |
| RVEDV (mL), mean ± SD | 143.1 ± 39.5 | 139.1 ± 43.9 | 0.75 |
| RVEDV index (mL/m2), mean ± SD | 71.1± 16.3 | 69.4± 15.1 | 0.73 |
| RVESV (mL), mean ± SD | 62.7 ± 21 | 54.4 ± 25.7 | 0.24 |
| RVESV index (mL/m2), mean ± SD | 30.9 ± 8.5 | 26.6 ± 10 | 0.13 |
| RVEF, % (mean ± SD) | 55.3 ± 13.1 | 62.6 ± 8.9 | 0.054 |
| LA area (cm2), median [IQR] | 28.5 [25-32] | 30 [26.3-30.1] | 0.72 |
| GLS 3D, % (mean ± SD) | -10.5 ± 2.9 | -7.4 ± 4.1 | 0.004 |
| GLS 2D, % (mean ± SD) | -12.9 ± 2 | -11.7 ± 3.2 | 0.14 |
| GCS 3D, % (mean ± SD) | -15.1 ± 8.3 | -18.4 ± 2.7 | 0.14 |
| GCS 2D, % (mean ± SD) | -16.7 ± 2.2 | -16.4 ± 2.7 | 0.65 |
| GRS 3D, % (mean ± SD) | 39.8 ± 12.3 | 38.8 ± 15.9 | 0.8 |
| GRS 2D, % (mean ± SD) | 27.8 ± 5.7 | 28 ± 6.9 | 0.94 |
2D, two-dimensional; 3D, three-dimensional; BMI, body mass index; GCS, global circumferential strain; GLS, global longitudinal strain; GRS, global radial strain; LA, left atrial; LAX, long axis; LGE, late gadolinium enhancement; LVEDV, left ventricular end-diastolic volume; LVEF, left ventricular ejection fraction; LVESV, left ventricular end-systolic volume; LVH, left ventricular hypertrophy; MWT, maximum wall thickness; RVEDV, right ventricular end-diastolic volume; RVEF, right ventricular ejection fraction; RVESV, right ventricular end-systolic volume; SAX, short axis; SV, stroke volume.
To the best of our knowledge, no previous studies have assessed the agreement between 3D and 2D deformation using FT-CMR in patients with HCM and compared these results across different HCM phenotypes. The main findings of this study were:
1) Myocardial strain evaluated using 3D FT-CMR was consistently lower compared to 2D FT-CMR.
2) Deformation analysis showed the highest level of agreement for GCS between 2D and 3D measurements.
3) HCM patients exhibited lower GLS and GRS, but no differences in GCS compared to healthy volunteers.
4) While exhibiting more reduced GLS 3D, apical HCM patients had a higher number of segments with LVH than those with septal HCM, but no difference in LGE burden.
We demonstrated that myocardial strain evaluated using 3D FT-CMR was consistently lower compared to 2D FT in patients with HCM. This is in line with previously published data in 100 healthy volunteers using the same software as in our study11, and replicating the results of comparisons between 2D and 3D STE12,13. In patients with HCM, characterized by abnormal geometry from asymmetric LVH, the observed differences may be attributed to variations in tracking algorithms as well as to the assessment of myocardial deformation across multiple dimensions provided by 3D FTI.
We found that the highest level of agreement was achieved between 2D and 3D GCS (mean of differences of -0.3%). It is worth mentioning that although there was a statistically significant difference between 2D and 3D GLS strain, a difference of -2.7% may represent an acceptable level of agreement in clinical practice. Our results arein accordance with the majority of studies, which demonstrate that GCS measurements provide the highest level of agreement between 2D and 3D methods and greatest reproducibility. For instance, a previous study that evaluated the agreement and reproducibility of 3D FT-CMR in healthy volunteers demonstrated that 3D FT-CMR exhibited superior reproducibility as compared to 2D FT-CMR, with the highest degree of reproducibility observed for GCS11. In contrast, another study that evaluated STE in HCM found that there was only modest agreement between 2D and 3D GLS and GCS values13. Nevertheless, this may be associated with the limitations of 3D echocardiography.
Both the better reproducibility and the lower values obtained with 3D FT-CMR can probably be linked to the through-plane loss of features, which limits 2D strain analysis. This phenomenon occurs mainly during LV twist, where the out-of-plane myocardial motion accentuates the observed magnitude of contraction, leading to an inaccurate estimation of deformation. 3D FT-CMR has the potential to overcome this limitation and potentially provide more accurate results for deformation assessment. Nevertheless, while improved reproducibility is promising, further investigations are required to assess whether it provides supplementary clinical information in comparison to 2D strain.
In accordance with our research, a recent meta-analysis including multiple vendors conducted on 659 healthy subjects demonstrated that GCS was the most consistent FT-CMR parameter, whereas the highest inconsistency was observed for GRS14. This large variation regarding GRS measurements has been identified in most of the studies, including those incorporating other techniques to assess deformation, such as myocardial tagging11,15,16. This observation is most likely attributable to the radial direction being the most sensitive parameter for myocardial tracking of LV twist.
A study evaluating the inter-vendor agreement of FT-CMR in healthy volunteers, using two different software, reported that GCS was the most consistent parameter as well. Conversely, the measurements obtained with the same software utilized in our study were significantly lower than those obtained from the alternative software, suggesting limited interchangeability between vendors17. The highest variability was observed in radial strain across all techniques in an investigation that sought to determine strain values in patients with cardiomyopathies and healthy controls using tagged imaging as a reference method for multiple techniques and vendors18. This suggests that reference values should be defined for every technique and software product. Overall, the major drawback of other techniques in the quantification of deformation is the need for acquiring additional sequences, which results in a prolonged scanning time. The post-processing technology used for FT-CMR eliminates the necessity of supplementary scanning time, hence conferring an important advantage to this technique19.
Notably, both 2D and 3D FTI were feasible in all patients in our study as image quality was optimal, highlighting their potential utility in cases with suboptimal echocardiographic windows. Augustine et al. likewise observed that FT has a significant ability to track up to 90% of segments16. Hence, considering that STE allows for the assessment of strain in only approximately 80% of the segments as a result of inadequate image quality in some regions20,21, FT provides an ideal alternative. Additionally, although 3D STE has been proposed as a solution to address the limitations of 2D imaging, such as out-of-plane motion, it comes with the drawback of a reduced temporal and spatial resolution, which could influence the overall accuracy13. A significant benefit of FT-CMR is its ability to efficiently track the segments, even in patients who have limited acoustic windows. Furthermore, it is well-established that individuals with HCM can show abnormal myocardial geometry, characterized by hypertrophy across multiple segments. This might pose challenges for STE and the use of FT could prove particularly advantageous in these patients. Implementing 3D FTI does not require extending the scanning time beyond the standard CMR protocol, and the analysis of 3D FTI can be efficiently completed in a reasonable timeframe.
In our study, patients with HCM exhibited lower values of GLS 3D and GRS 3D compared to the normal range values obtained from a study that evaluated healthy volunteers using the same software11. However, there was no significant difference in GCS 3D values between HCM and healthy volunteers11. This is consistent with another study using STE, which also observed a greater reduction in GLS values in HCM patients compared to controls22. The reduced longitudinal deformation in HCM could be attributed to the vulnerability of the subendocardial layer to perfusion abnormalities and its higher susceptibility to interstitial fibrosis23. In general, studies using CMR consistently show a decrease in GLS in individuals with HCM, but the results regarding GCS and GRS are variable8-10. As an example, a study using STE in HCM and examining the response to exercise reported that HCM patients had reduced GLS and GRS at rest, but higher GCS compared to the control group23. Overall, the absence of a decrease in circumferential deformation in HCM, whether it results in an increase or maintenance of normal levels, may indicate a compensation mechanism that assists in preserving systolic function in HCM. The variations observed between studies are likely related to the use of different imaging methodologies, as well as the inclusion of heterogeneous populations. In terms of direct comparisons between normal FTI and STE values, evaluation is currently constrained by the limited availability of data; however, cvi42 FT data appears to report a trend toward lower normal values in 3D and 2D GLS (-14.6% vs. -19.4% with 4D AutoLVQ, and -19.8% vs. -22.5%), 3D and 2D GCS (-17.6% vs. -19.47% 4D with AutoLVQ and -20.9% vs. -31.9%) and 3D GRS compared to STE (47.4% vs. 50.41% 4D with AutoLVQ), but higher 2D GRS values (47.6% vs. 37.4%), suggesting differences in the assessment of myocardial strain between the two techniques11,24,25.
Septal and apical HCM are widely recognized as the most common phenotypes of HCM. Our investigation found that although there was no variation in LGE burden between the two phenotypes, apical HCM patients had a significantly larger reduction in GLS 3D, while there was no major difference in terms of GCS 3D and GRS 3D. This may be attributed to the higher proportion of segments with LVH in patients with apical HCM. These segments are likely to exhibit greater impairment in longitudinal deformation, leading to a decrease in the overall global value.
There has been evidence that abnormal GLS is associated with adverse cardiac events in patients with HCM1. A large study including 2311 individuals with HCM sought to identify factors that can predict abnormal 3D GLS, revealing that several CMR parameters were associated with greater impairment in longitudinal deformation. These parameters include a higher LV mass index and MWT, lower LVEF and RVEF, and a higher extent of LGE26. Consistent with our findings, the same study demonstrated that 3D GLS was better preserved in patients with septal LVH. However, 3D GRS was better preserved in patients with apical HCM.
Previous research suggests that GLS measured by STE can be useful in predicting outcomes in HCM, including sudden cardiac death and all-cause mortality27,28. Other studies found an association between strain, LGE and native T1, but not ECV26,29,30, demonstrating that the pathophysiology of HCM involves intricate mechanisms. Notably, myocardial disarray in HCM can also be present in segments that are not hypertrophied, as reported in previous studies using histopathology31,32. Hence, assessing strain to determine abnormal myocardial contractile function in HCM may offer valuable information about subtle changes potentially associated with higher risk in HCM. Additionally, this could result in an improved understanding of morphological characteristics in HCM, which might aid in distinguishing different hypertrophic phenotypes. Finally, deformation imaging is less affected by loading conditions than LVEF. Hence, deformation imaging has the potential to assist clinical decisions, particularly in individuals with apparently preserved systolic function.
The main limitation of this study is that results were calculated using software from a single vendor, and CMR FT may be subject to variations between different vendors. Another limitation is that the analysis was performed by a single observer, and reproducibility was not tested. This may introduce observer-specific biases and limit the generalisability of the results. Future studies should assess intra- and interobserver variability to enhance the reliability and validity of 3D FTI measurements. The absence of T1 mapping which could have enabled the assessment of interstitial fibrosis in addition to LGE. Furthermore, although the clinical value of 2D strain has been previously demonstrated, it is necessary to collect additional prospective data and include a larger cohort of patients with HCM to assess the predictive value of 3D strain. A possible limitation of this technique is the limited data on its association with major adverse cardiovascular events. Future research should focus on evaluating the potential association of CMR FT with major adverse cardiovascular events in patients with HCM, to to further establish the predictive value of this method within this patient population.
3D FT-CMR is feasible in HCM patients. While 3D FT corroborates the results of 3D STE, demonstrating that absolute values are generally lower than those obtained via the 2D approach, 2D and 3D FT by CMR are not entirely interchangeable. 3D FT is advantageous compared to other techniques as it does not require additional scanning time, making it suitable for HCM patients with limited acoustic window and abnormal geometry.