Sarcomeric hypertrophic cardiomyopathy (HCM) is a genetic disease characterized by the hypertrophy of the myocardium of at least one or more segments of the left ventricle (LV). Histologically, this pathological state is associated with disorganized myocardial tissue architecture: myocyte hypertrophy, fiber disarray, and fibrosis [1]. Typically, the global systolic function, as estimated by the ejection fraction, is normal or even supranormal, but the regional function, especially the longitudinal contraction, is impaired due to this architecture [2]. It has been demonstrated that regional contractile function is altered in the most hypertrophied walls [3]. Similarly, myocardial fibrosis plays a role in the impairment of contractile function [4]. In this context, cardiac magnetic resonance imaging (MRI) emerges as the gold standard for identifying and quantifying myocardial fibrosis through late gadolinium enhancement (LGE) [5] while providing precise measurements of myocardial thickness [6]. Also, the extent of late gadolinium enhancement in MRI is associated with a poor prognosis [7], and it was recognized by professional societies as a risk marker of sudden cardiac death [8]. Unlike MRI, 2D speckle tracking by echocardiography, especially longitudinal strain, is a fast and easy-to-obtain method. It studies ventricular deformation and determines regional and global cardiac function. Previous studies have described the alteration of global longitudinal strain (GLS) in HCM and its association with impaired prognosis and ventricular arrhythmias [9,10].
However, the relationship between cardiac deformation by 2D speckle tracking, hypertrophy, and the extent of LGE is uncertain.
The aim of our study is to compare left ventricular global longitudinal strain (GLS) with the extent of late gadolinium and to determine a relationship between GLS and hypertrophy.
Our study was a descriptive cross-sectional single-center study conducted at the cardiology department of La Rabta University Hospital from January 2022 to March 2023. All patients aged 16 years old and above with hypertrophic cardiomyopathy were included.
HCM was defined as the presence of ≥ 1 segment ≥15mm in the absence of a family history of HCM or ≥ 13mm in the case of a family history of HCM in the absence of any afterload conditions that would be able to explain left ventricular hypertrophy. HCM can be obstructive or non-obstructive.
LV obstruction is defined as a maximal gradient greater than 30 mmHg.
The exclusion criteria were as follows:
Patients with a metabolic, syndromic, or congenital cause of HCM
Patients with a history of myocardial infarction, myocarditis, or infiltrative cardiomyopathy (by means of the MRI)
History of cardiac surgery
Septal reduction therapy
Patients with an implantable cardioverter defibrillator
Patients with poor echogenicity
Contraindication to MRI
Patients with atrial fibrillation (AF)
All patients underwent a clinical examination, electrocardiogram, echocardiography, and cardiovascular magnetic resonance. The maximum time interval between the echocardiography and the MRI was six months. Informed consent was obtained from all participants.
Echocardiograms were performed at the cardiology department’s echo lab at La Rabta University Hospital using a Vivid E9 machine (GE Healthcare, Horten, Norway) with an M5S cardiac probe. All measured parameters were in accordance with the recommendations of the American Society of Echocardiography (ASE) [11].
The maximum wall thickness was identified from the short-axis view in the end-diastole.
Global longitudinal strain (GLS) measurement was taken after acquiring the apical 4-chamber, 2-chamber, and 3-chamber views. GLS was performed ad-hoc during the echocardiography exam and/or post-hoc using EchoPack software (GE Healthcare version 112). Following endocardial contour detection, three points were placed on the end-diastole image: one at the septobasal, one at the laterobasal, and the third at the apical regions. Manual adjustment was performed for enhanced precision. The region of interest adjustment was made based on the thinnest myocardial thickness before validation. Peak regional systolic strain was provided for each of the 17 myocardial segments, and an average value of GLS was automatically generated by the software.
All echocardiograms were conducted by the same echocardiographer and verified by an experienced counterpart (all cardiologists). Longitudinal strain measurements were performed by the same operator for all patients. The operator conducted the echocardiography before the MRI results were available, ensuring they were blinded to MRI results.
MRI was performed at the Radiology Department of La Rabta University Hospital using a General Electric 1.5T machine (GE Healthcare, Horten, Norway). CVI 42 software (Circle Cardiovascular Imaging, Calgary, Alberta, Canada) was used for the post-processing of the MRI images.
Dynamic cine sequences were acquired in short-axis, 4-chamber, 3-chamber, and 2-chamber views. Endocardial and epicardial boundaries were automatically defined with manual adjustments, and then the LV mass index was calculated.
Fifteen minutes after the injection of 0.2 mmol/kg of gadoteric acid, a late gadolinium enhancement (LGE) study was conducted using Phase-Sensitive Inversion Recovery (PSIR) sequences. The distribution and transmurality of LGE were visually analyzed. An experienced radiologist first visually estimated the extent of LGE relative to left ventricular mass. This was then quantified by tracing the endocardial and epicardial borders and selecting a region of interest (ROI) in a remote area of healthy myocardium. The mean signal intensity and standard deviations within this ROI were measured. Enhanced myocardium was defined as having a signal intensity at least six standard deviations above the mean of the ROI. The extent of LGE was expressed as a percentage of the myocardial volume exhibiting LGE relative to the total myocardial volume.
The radiologist provided the extent of Late Gadolinium Enhancement (LGE) on the report as follows: ≥15%, <15%, and none. The exact value for the LGE extent was determined at the operator’s discretion.
Patients exhibiting non-specific patterns of LGE, such as minor RV insertion points, were classified as LGE-negative.
HCM patients were divided into three groups according to the extent of LGE: LGE ≥ 15%; LGE<15%; and LGE = 0, then a correlation was investigated between the extent of LGE, the global longitudinal strain on one hand, and the extent of LGE with left ventricular mass index and maximum thickness on the other hand for the different groups.
We calculated the means with standard deviations for quantitative variables and expressed percentages for qualitative variables, and then we performed a comparison using a student’s t-test for quantitative variables and a chi squared test for qualitative variables.
A correlation between GLS and the extent of LGE and between LV mass index and the extent of LGE was assessed using the Pearson test. The predictive GLS to LGE extent ≥ 15% was assessed using the ROC curve (receiver operating characteristic). Statistical significance was set at p < 0.05.
All statistical analyses were conducted using IBM SPSS version 22 (SPSS Institute, Chicago, IL, USA).
Of 47 patients screened for the study, five patients were excluded. Two patients were in atrial fibrillation, and three had poor echogenicity. Forty-two patients were included in the study, with 15 patients having a LGE extent ≥ 15%, 16 patients having a LGE extent < 15%, and 11 patients having no LGE. All patients included were Caucasian. The clinical characteristics are summarized in Table 1.
Clinical characteristics in HCM patients
| All HCM (n= 42) | LGE≥15% (n= 15) | LGE<15% (n= 16) | LGE=0 (n= 11) | p value | |
|---|---|---|---|---|---|
| Age, y | 48±5 | 50 ± 9 | 52 ± 8 | 42 ± 9 | 0.265 |
| Male, n (%) | 30 (71%) | 13 (31%) | 9 (21%) | 8 (19%) | 0.268 |
| Hypertension, n (%) | 19 (45%) | 9 (21%) | 5 (12%) | 5 (12%) | 0.275 |
| Coronary artery disease, n (%) | 4 (10%) | 2 (5%) | 0 | 2 (5%) | 0.235 |
| Syncope, n (%) | 8 (19%) | 3 (7%) | 2 (5%) | 3 (7%) | 0.626 |
| Palpitation, n (%) | 18 (43%) | 4 (10%) | 11 (26%) | 3 (7%) | 0.029 |
| History of sustained VT, n (%) | 1 (2%) | 0 | 0 | 1 (2%) | 0.236 |
| Paroxysmal AF, n (%) | 4 (10%) | 2 (5%) | 1 (2%) | 1 (2%) | 0.797 |
| NYHA functional class, n (%) | |||||
| 1-2 | 22 (52%) | 9 (21%) | 9 (21%) | 4 (10%) | 0.266 |
| 3 | 4 (10%) | 1 (2%) | 3 (7%) | 0 | - |
HCM: Hypertrophic cardiomyopathy; LGE: Late gadolinium enhancement; VT: Ventricular tachycardia; AF: Atrial fibrillation; NYHA: New York Heart Association.
The mean left ventricular ejection fraction (LVEF) was 62.5%, and the mean global longitudinal strain was -13.9%. The mean maximal wall thickness was 22.4 mm. Sixteen patients had a maximal gradient ≥ 30 mmHg. Echocardiographic results are summarized in Table 2.
Echocardiographic results in the 42 HCM patients
| All HCM | |
|---|---|
| LVEF, % | 62.5 ± 2 |
| GLS, % | -13.9 ± 1.2 |
| Maximal wall thickness, mm | 22.4 ± 2 |
| LV anteroseptal wall thickness, mm | 17.6 ± 2.4 |
| LV posterolateral wall thickness, mm | 13.1 ± 1.7 |
| Anteroposterior left atrium diameter, mm | 40.7 ± 2.3 |
| LVOT gradient, mmHg | 39.2 ± 15.8 |
HCM: Hypertrophic cardiomyopathy; LVEF: left ventricle ejection fraction; GLS: Global longitudinal strain; LV: left ventricle; LVOT: Left ventricle outflow tract
Fifteen patients had a LGE extent greater than 15%, 16 patients had a LGE extent less than 15%, and 11 patients had no LGE. The mean LV mass index was 134.5g/m2.
In comparison to patients without LGE, those with LGE ≥ 15% had a statistically significant higher LV mass index (p=0.025). The MRI parameters compared according to the late gadolinium enhancement extent were described in Table 3.
MRI parameters according to the extent of LGE
| All HCM (n= 42) | LGE≥15% (n= 15) | LGE<15% (n= 16) | LGE=0 (n= 11) | P value (≥15 vs <15%) | P value (≥15 vs 0) | P value (<15 vs 0) | |
|---|---|---|---|---|---|---|---|
| LVEF, % | 65 ± 2.4 | 66.4 ± 5.2 | 64.6 ±3.4 | 62.5 ± 5.5 | 0.575 | 0.322 | 0.495 |
| LV mass index, g/m2 | 134.5 ± 25.6 | 185.4 ± 56.5 | 109 ± 19.3 | 102.3 ± 18.2 | 0.016 | 0.025 | 0.635 |
| LV EDV, ml/m2 | 86.2 ± 7.1 | 93.9 ± 14.5 | 80.8 ± 8.9 | 85.5 ± 10.2 | 0.131 | 0.423 | 0.415 |
HCM: Hypertrophic cardiomyopathy; LGE: Late gadolinium enhancement; LVEF: left ventricle ejection fraction; LV: left ventricle; LVEDV: Left ventricle end-diastolic volume
A LV mass index of 118.3 g/m2 predicted an LGE extent ≥ 15% with a specificity of 70.4% and a sensitivity of 80%. The AUC was 0.794. Figure 1a shows the ROC curve of LVMI in relation to LGE extent ≥ 15%.
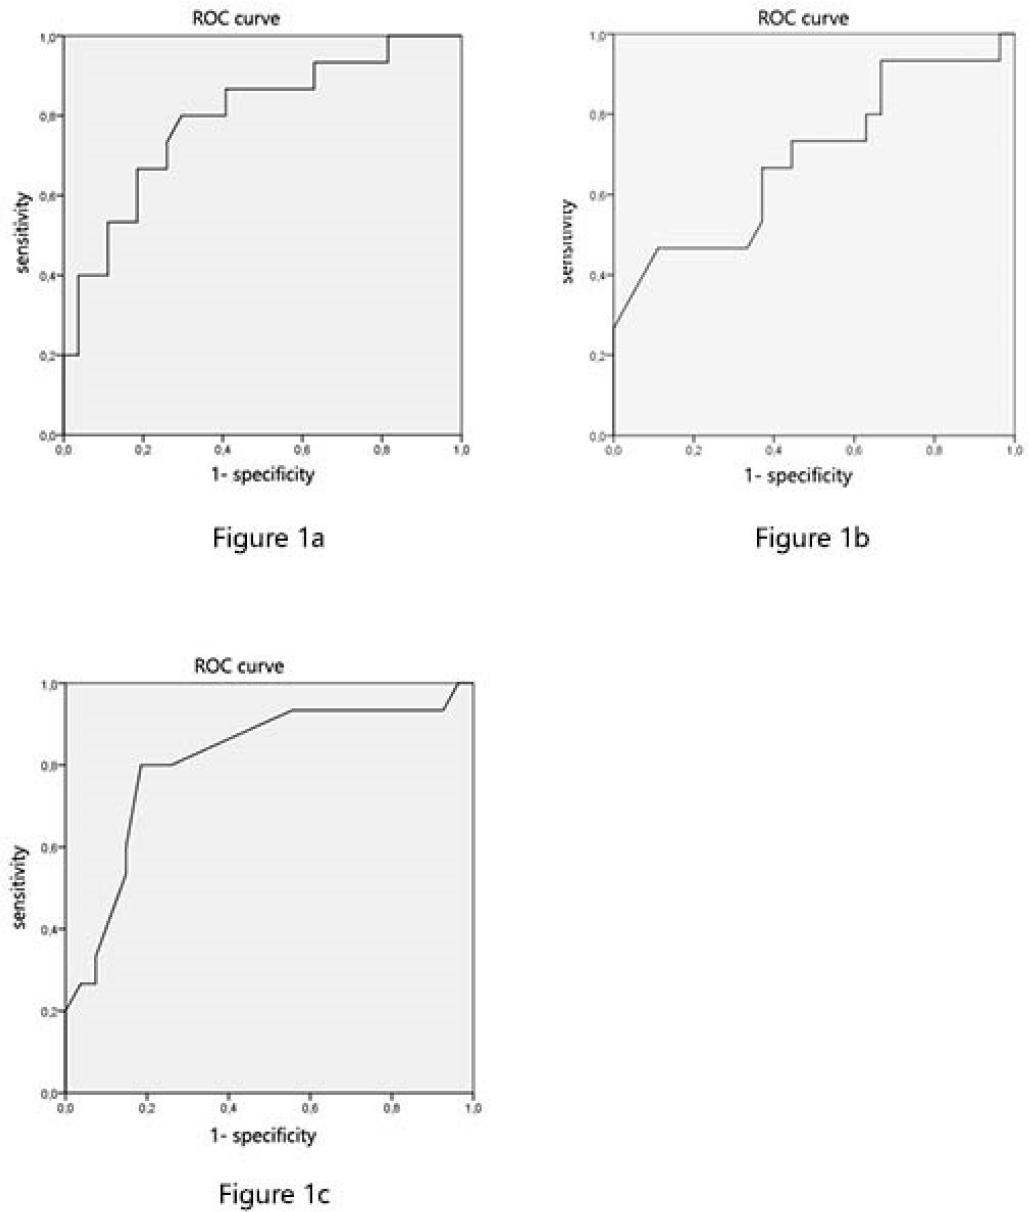
Receiver operating characteristic (ROC) curve in relation to LGE extent ≥ 15%.1a. Receiver operating characteristic (ROC) curve for LVMI in relation to LGE extent ≥ 15% Area Under the Curve (AUC) of 0.794 (95% CI 0.649 - 0.939) p=0.002. 1b. Receiver operating characteristic (ROC) curve for GLS in relation to LGE extent ≥ 15%. Area Under the Curve (AUC) of 0.691 (95% CI 0.515 - 0.868) p=0.042. 1c. Receiver operating characteristic (ROC) curve for MWT in relation to LGE extent ≥ 15%. Area Under the Curve (AUC) of 0.811 (95% CI 0.665 - 0.957) p=0.001.
Patients with LGE ≥ 15% had a statistically significant lower global longitudinal strain and higher maximal wall thickness compared to the group of patients without LGE (p=0.016; p=0.003, respectively).
Patients with LGE < 15% and those with no LGE did not show a significant difference in GLS (p=0.284, p=0.071). Patients with LGE < 15% and those without any LGE had a statistically significant difference in MWT ( p=0.027, p=0.015).
Correlation was found between LGE extent and GLS with a p-value of 0.01, and also, a correlation between LVMI and LGE extent was found with a p-value of 0.005.
A GLS cutoff value of -13.95 % predicted a LGE extent ≥15% with a specificity of 63% and a sensitivity of 66.7%. The AUC (area under the curve) was 0.691. Figure 1b shows the ROC curve for GLS in relation to LGE extent ≥ 15%.
A MWT cutoff value of 22.5mm predicted a LGE extent ≥15% with a specificity of 81.5% and a sensitivity of 80%. The AUC (area under the curve) was 0.811. Figure 1c shows the ROC curve for MWT in relation to LGE extent ≥ 15%.
The echocardiographic parameters compared according to the late gadolinium enhancement extent were described in Table 4
Echocardiographic parameters according to the extent of LGE in HCM patients
| All HCM | LGE≥ 15% | LGE<15% | LGE=0 | P value (≥15 vs <15%) | P value (≥15 vs 0) | P value (<15 vs 0) | |
|---|---|---|---|---|---|---|---|
| LVEF, % | 62.5 ± 2 | 61.5 ± 3.5 | 63.5 ± 3.2 | 62.3 ± 4 | 0.421 | 0.788 | 0.641 |
| GLS, % | -13.9 ± 1.2 | -12.3 ± 2.1 | -13.8 ± 1.6 | -16.7 ± 1.8 | 0.284 | 0.016 | 0.071 |
| Maximal wall thickness, mm | 22.4 ± 2 | 26.7 ± 4.2 | 21.4 ± 1.8 | 17.9 ± 1.51 | 0.027 | 0.003 | 0.015 |
| LV anteroseptal wall thickness, mm | 17.6 ± 2.4 | 23.3 ± 4.8 | 15.1 ± 2.7 | 13.4 ± 2.4 | 0.006 | 0.004 | 0.393 |
| LV posterolateral wall thickness, mm | 13.1 ± 1.7 | 16 ± 3.9 | 11.4 ± 1.9 | 11.7 ± 1.9 | 0.043 | 0.096 | 0.837 |
| Anteroposterior left atrium diameter, mm | 40.7 ± 2.3 | 44.3 ± 5 | 38.5 ± 1.7 | 38.81 ± 4.5 | 0.034 | 0.137 | 0.884 |
| LVOT gradient, mmHg | 39.2 ± 15.8 | 39.5 ± 19.6 | 56.9 ± 35.1 | 13.2 ± 9.4 | 0.409 | 0.044 | 0.058 |
HCM: Hypertrophic cardiomyopathy; LGE: Late gadolinium enhancement; LVEF: left ventricle ejection fraction; GLS: Global longitudinal strain; LV: left ventricle; LVOT: Left ventricle outflow tract
A correlation between the left ventricular mass index and the global longitudinal strain was investigated; the greater the left ventricular mass, the more reduced the strain.
Two scatter plots representing left ventricular mass index and GLS, as well as maximal left ventricular wall thickness and GLS, were presented in Figures 2 and 3. Pearson correlation coefficient and p values for the two tested variables were r=0.573, p<0.0001 and r= 0,448, p=0.003, respectively.
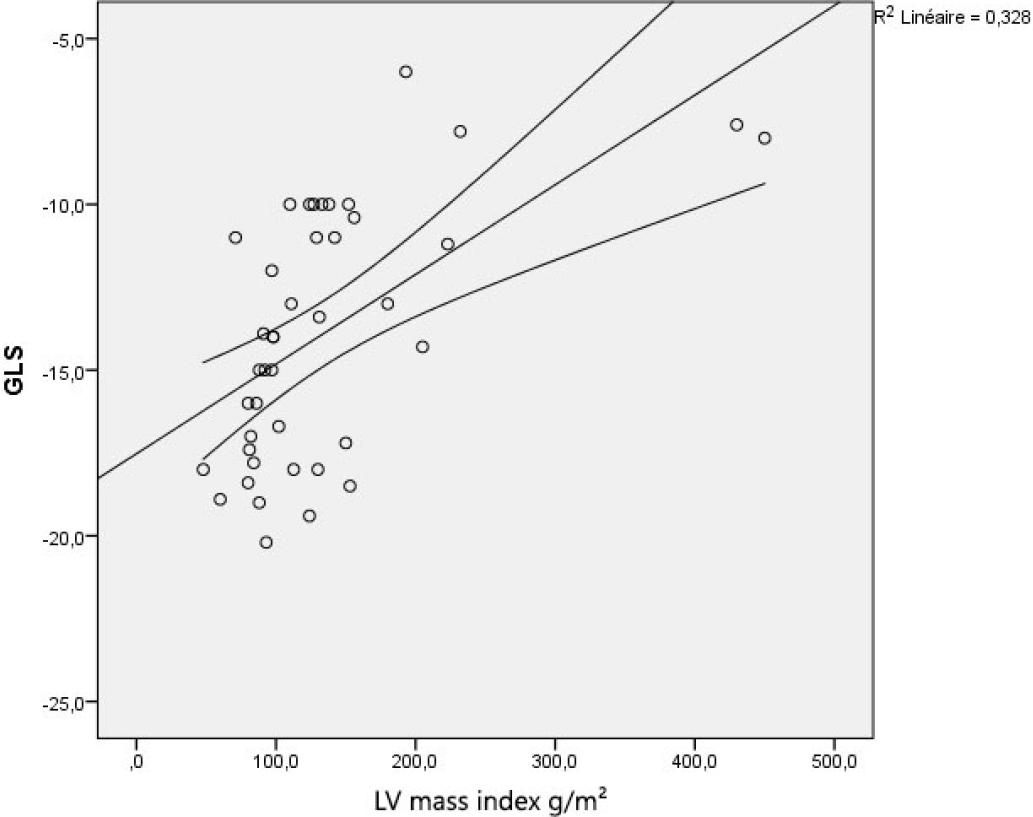
Scatter plots for Global Longitudinal Strain and left ventricular mass index. There was a weak but significant correlation between these two parameters. The linear line indicates the linear regression, and the two other indicates a 95% confidence interval for the mean.
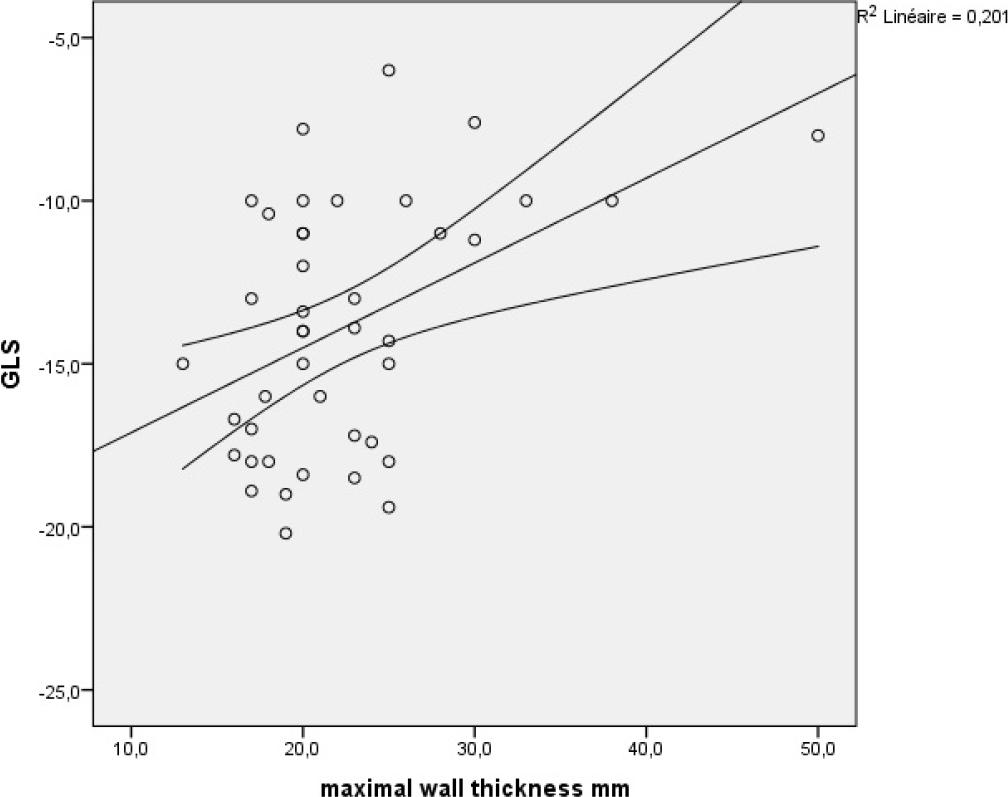
Scatter plot for Global Longitudinal Strain and maximal LV wall thickness. There was a weak but significant correlation between these two parameters. The linear line indicates the linear regression, and the two other indicates a 95% confidence interval for the mean.
Our study was a descriptive cross-sectional single-center study conducted at the cardiology department of La Rabta University Hospital, which included 42 patients with HCM. Patients with LGE ≥ 15% had a statistically significant lower global longitudinal strain, higher LV mass index, and higher maximal wall thickness compared to patients without LGE (p= 0.016, p=0.025, and p=0.003, respectively). A GLS cutoff value of -13.95 % predicted a LGE extent ≥15% with a specificity of 63% and a sensitivity of 66.7%. The AUC (area under the curve) was 0.691. Also, patients with higher LV mass index had lower global longitudinal strain (p<0.0001).
In our study, patients having other causes explaining myocardial fibrosis were excluded (myocardial infarction, myocarditis, infiltrative cardiomyopathy, septal reduction therapy and, cardiac surgery). Patients in atrial fibrillation were also excluded due to difficulties in measuring the strain. Patients implanted with devices were excluded due to artifacts generated by the cardiac leads.
Patients with hypertrophic cardiomyopathy generally have normal or even supra-normal ejection fraction in the study conducted by Haland et al. [12], the average ejection fraction was 61%, while in other series, the left ventricular ejection fraction (LVEF) exceeded 70% [13]. In our population, the mean ejection fraction was 62.47%. However, studies have shown an alteration in global longitudinal strain, suggesting the presence of subclinical systolic dysfunction. [14,12,10]. This alteration in cardiac deformation is due to the architectural disarray of myocytes and hypertrophy of the myocytes. [15]. In our cohort, the number of patients with an LGE extent greater than 15% is relatively high compared to what has been reported in the literature [16]. This higher prevalence can be attributed to the fact that the study was conducted in a tertiary care center.
Rakesh et al. demonstrated that patients with left ventricular wall thickness exceeding 30 mm exhibited significantly reduced values for all strain parameters, including GLS, global circumferential strain, global radial strain, and global area strain [14]. Urobano-Moral et al. demonstrated that all left ventricular deformation parameters (longitudinal strain, circumferential strain, and area strain) were altered in hypertrophied segments (>15mm) compared to non-hypertrophied ones [17]. Additionally, segments with not only hypertrophy but also fibrosis exhibit poorer mechanics. The same results were found in another study [18]. In our population, we found a correlation between LV mass index and GLS and between LV wall thickness and GLS.
Popovic et al. [19] demonstrated that depressed longitudinal strain was linked to myocardial fibrosis and wall thickness in individuals diagnosed with hypertrophic cardiomyopathy. Additionally, Saito et al. [13] similarly proved that 2D global longitudinal strain is a marker of myocardial fibrosis and cardiac events in patients with HCM. Wanichsetakul et al. demonstrated that GLS is correlated with the extent of LGE and, notably, served as an independent predictor for extensive LGE [20].
In our results, patients with LGE ≥ 15% had a statistically significant lower global longitudinal strain compared to those without LGE (p= 0.016).
A GLS cutoff value of -16.5% was correlated to myocardial fibrosis with a sensitivity of 80.9% and specificity of 76.5%, according to Hu et al. [21]. In our study, a GLS cutoff value of -13.95 % predicted an LGE extent ≥ 15% with a specificity of 63% and sensitivity of 66.7%.
Patients with LGE had a higher wall thickness and a higher LV mass index compared to those without LGE in many studies [12,17]. Our results were similar, patients with LGE ≥ 15% had a statistically significant, higher LV mass index, and higher maximal wall thickness ( p=0.025, and p=0.003 respectively).
Myocardial fibrosis is a well-established risk marker for sudden death, already recognized and taken into consideration by professional societies. [8,22]. This study has demonstrated a relationship between global longitudinal strain (GLS) and the extent of late gadolinium enhancement (LGE) correlated with myocardial fibrosis, suggesting that GLS could be a promising tool for sudden death risk stratification.
The present study has some limitations. First, the study population is relatively small and is from a tertiary care center (selection bias). A larger study must be performed to validate the role of GLS as a risk marker tool. Second, the longitudinal strain was measured only by 2D. In fact, because of the heterogeneity of the hypertrophy and the distribution of fibrosis in HCM, apical views may not have encompassed all hypertrophic and fibrotic regions. Third, circumferential and radial strains were not included in the analysis. The fourth limitation is related to the qualitative nature of the measurement technique for Late Gadolinium Enhancement (LGE). Specifically, instead of providing a precise quantification of LGE extent, the radiologist categorized patients into three groups based on LGE extent (≥15%, <15%, and 0). Finally, the cutoff of SLG has been obtained from a small sample size and applied to the same sample which is likely overemphasizing its accuracy.
HCM patients with LGE extent ≥ 15% had a significantly lower global longitudinal strain, higher LV mass index, and higher maximal wall thickness compared to those without LGE in our study. HCM patients with higher LV mass index had a lower global longitudinal strain. These findings suggest that GLS could be a promising tool for sudden death risk stratification as the LGE extent.