
Figure 1
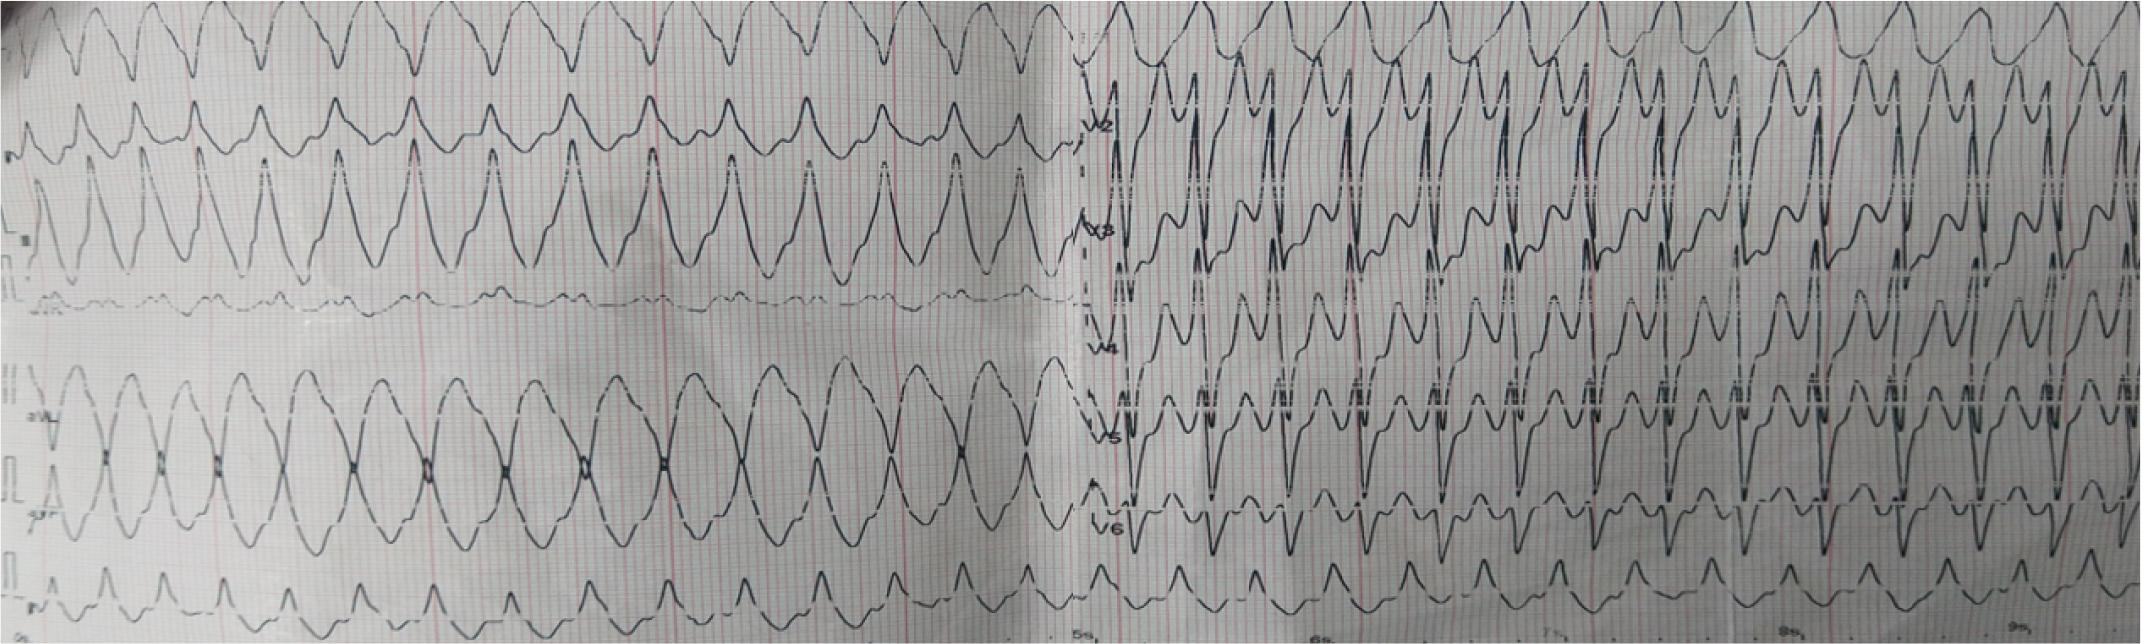
Figure 2A
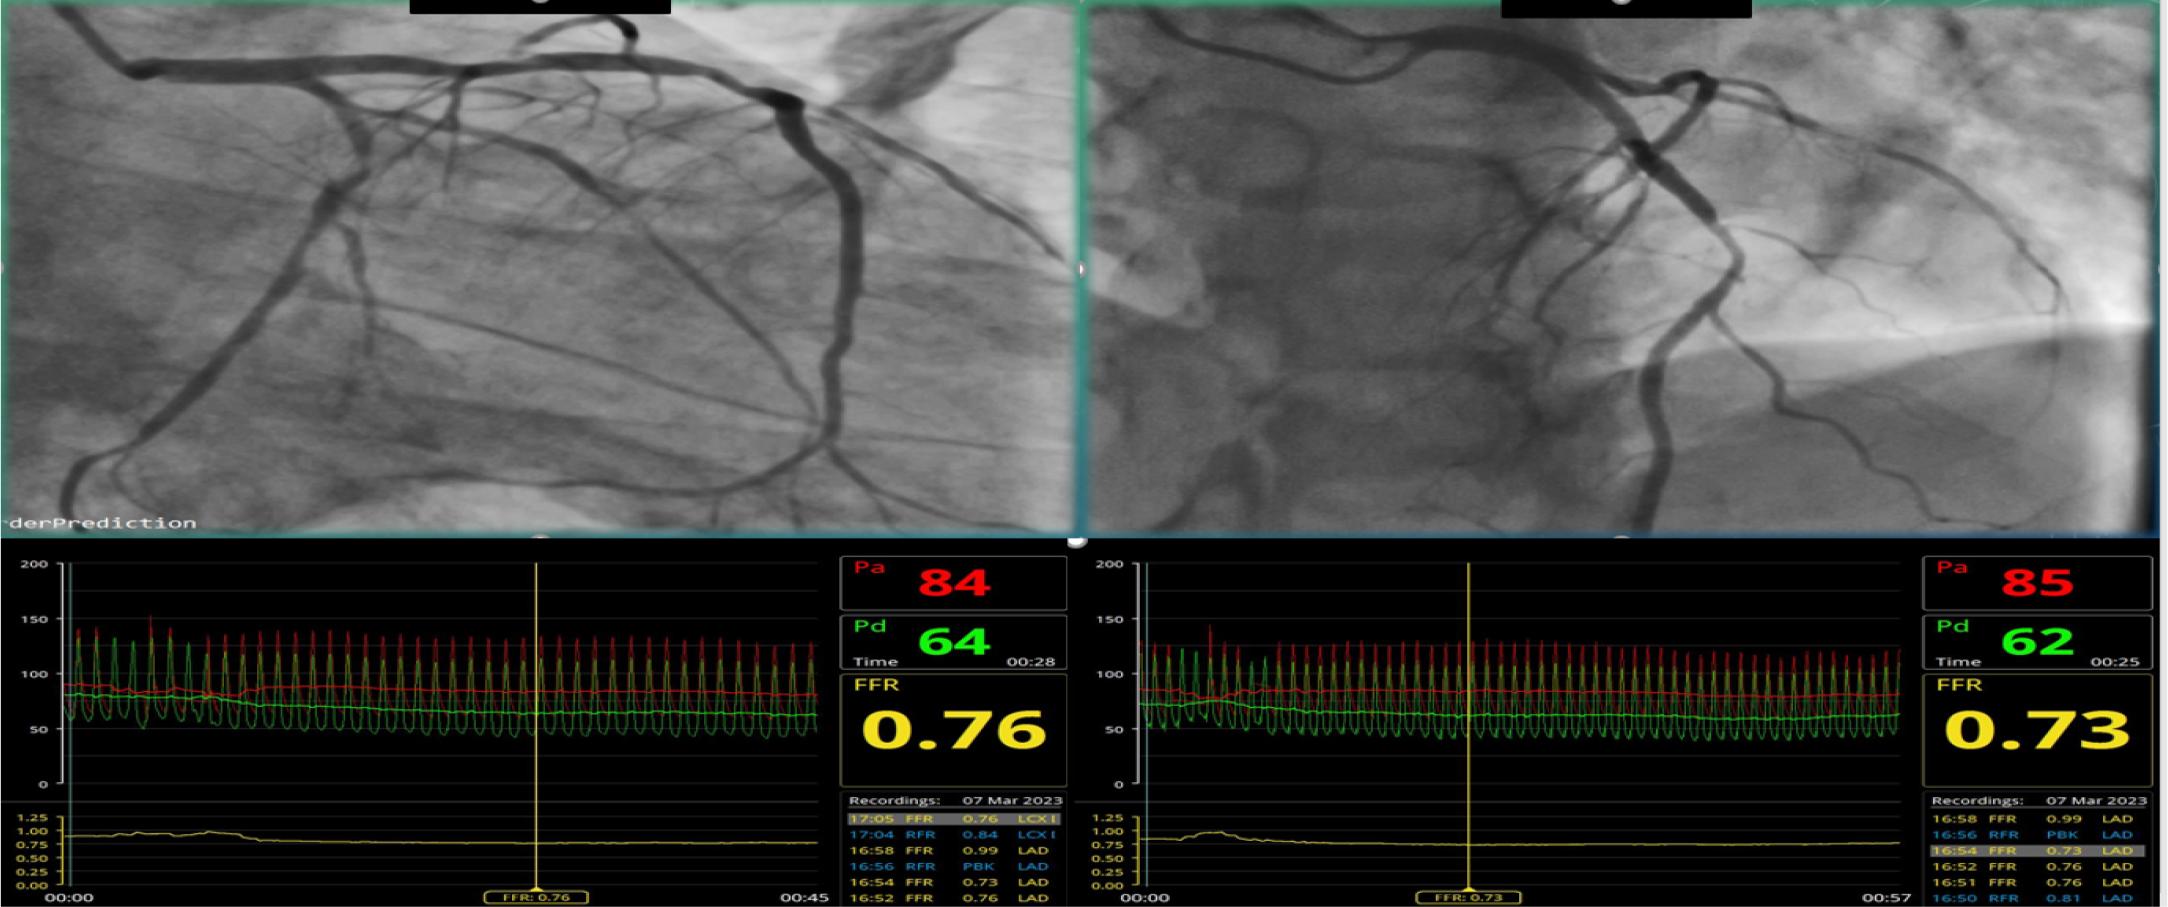
Figure 2B
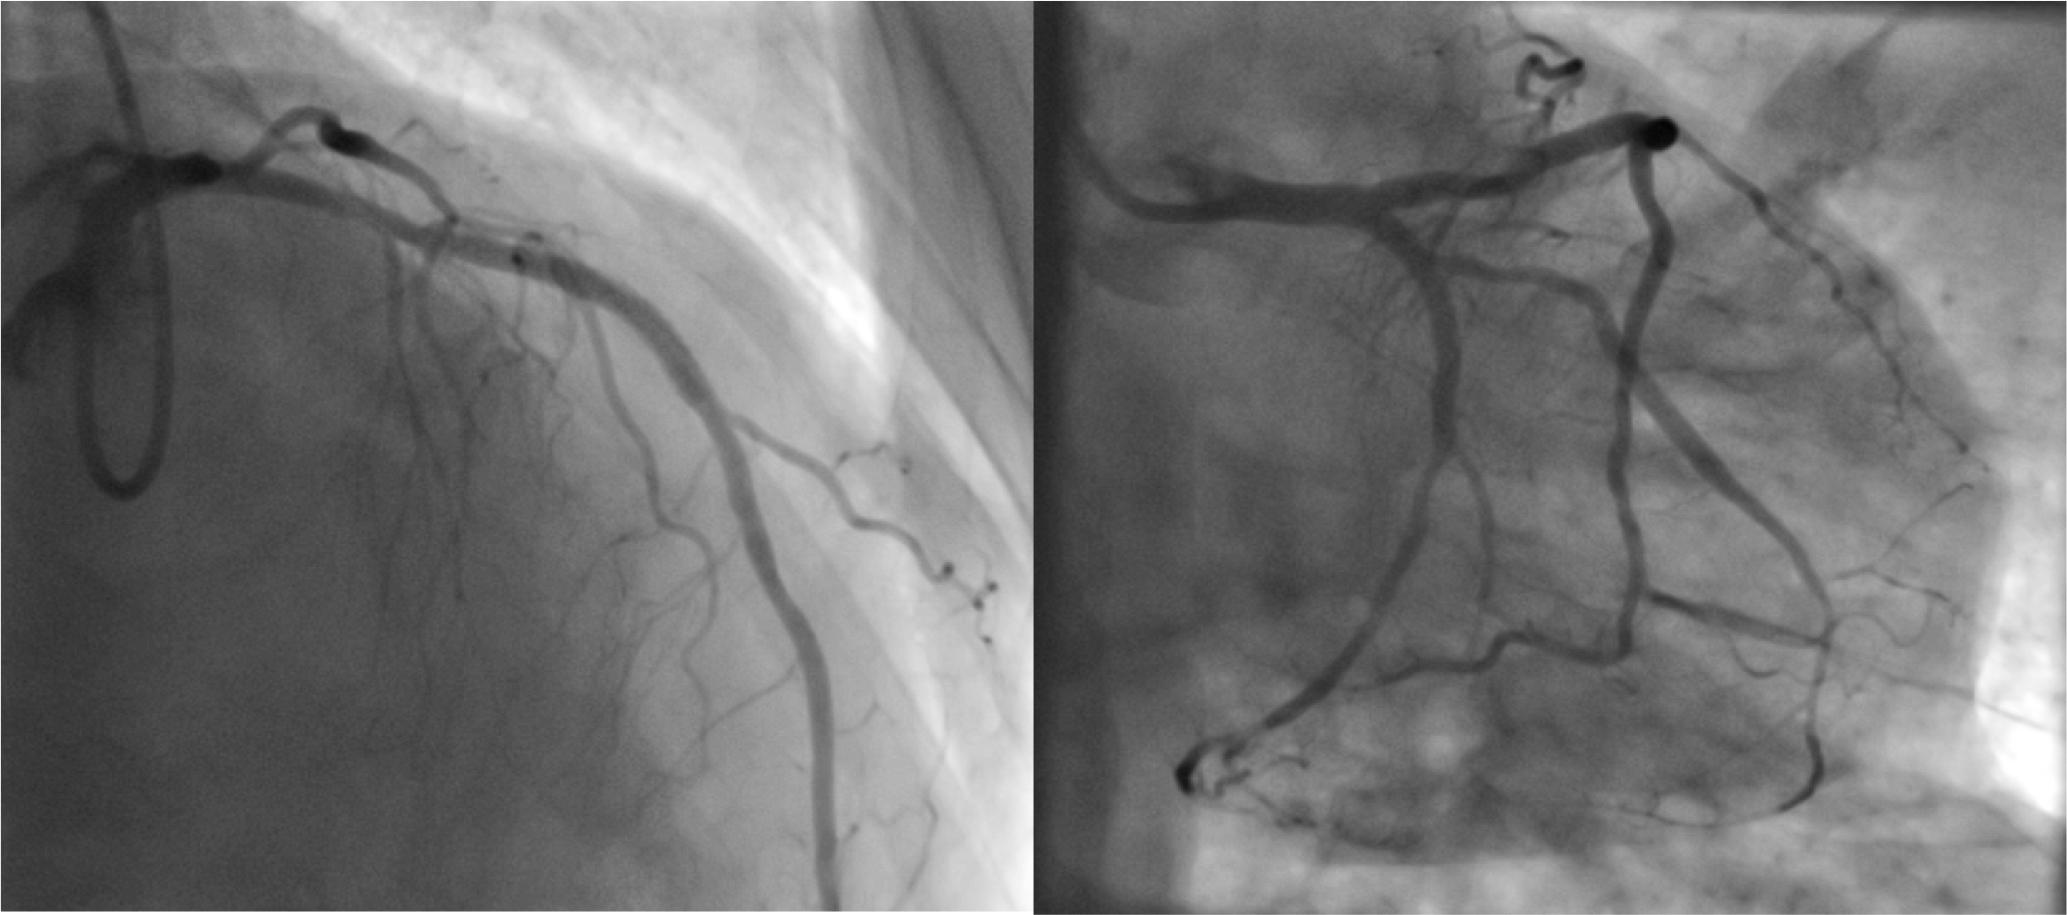
Figure 3
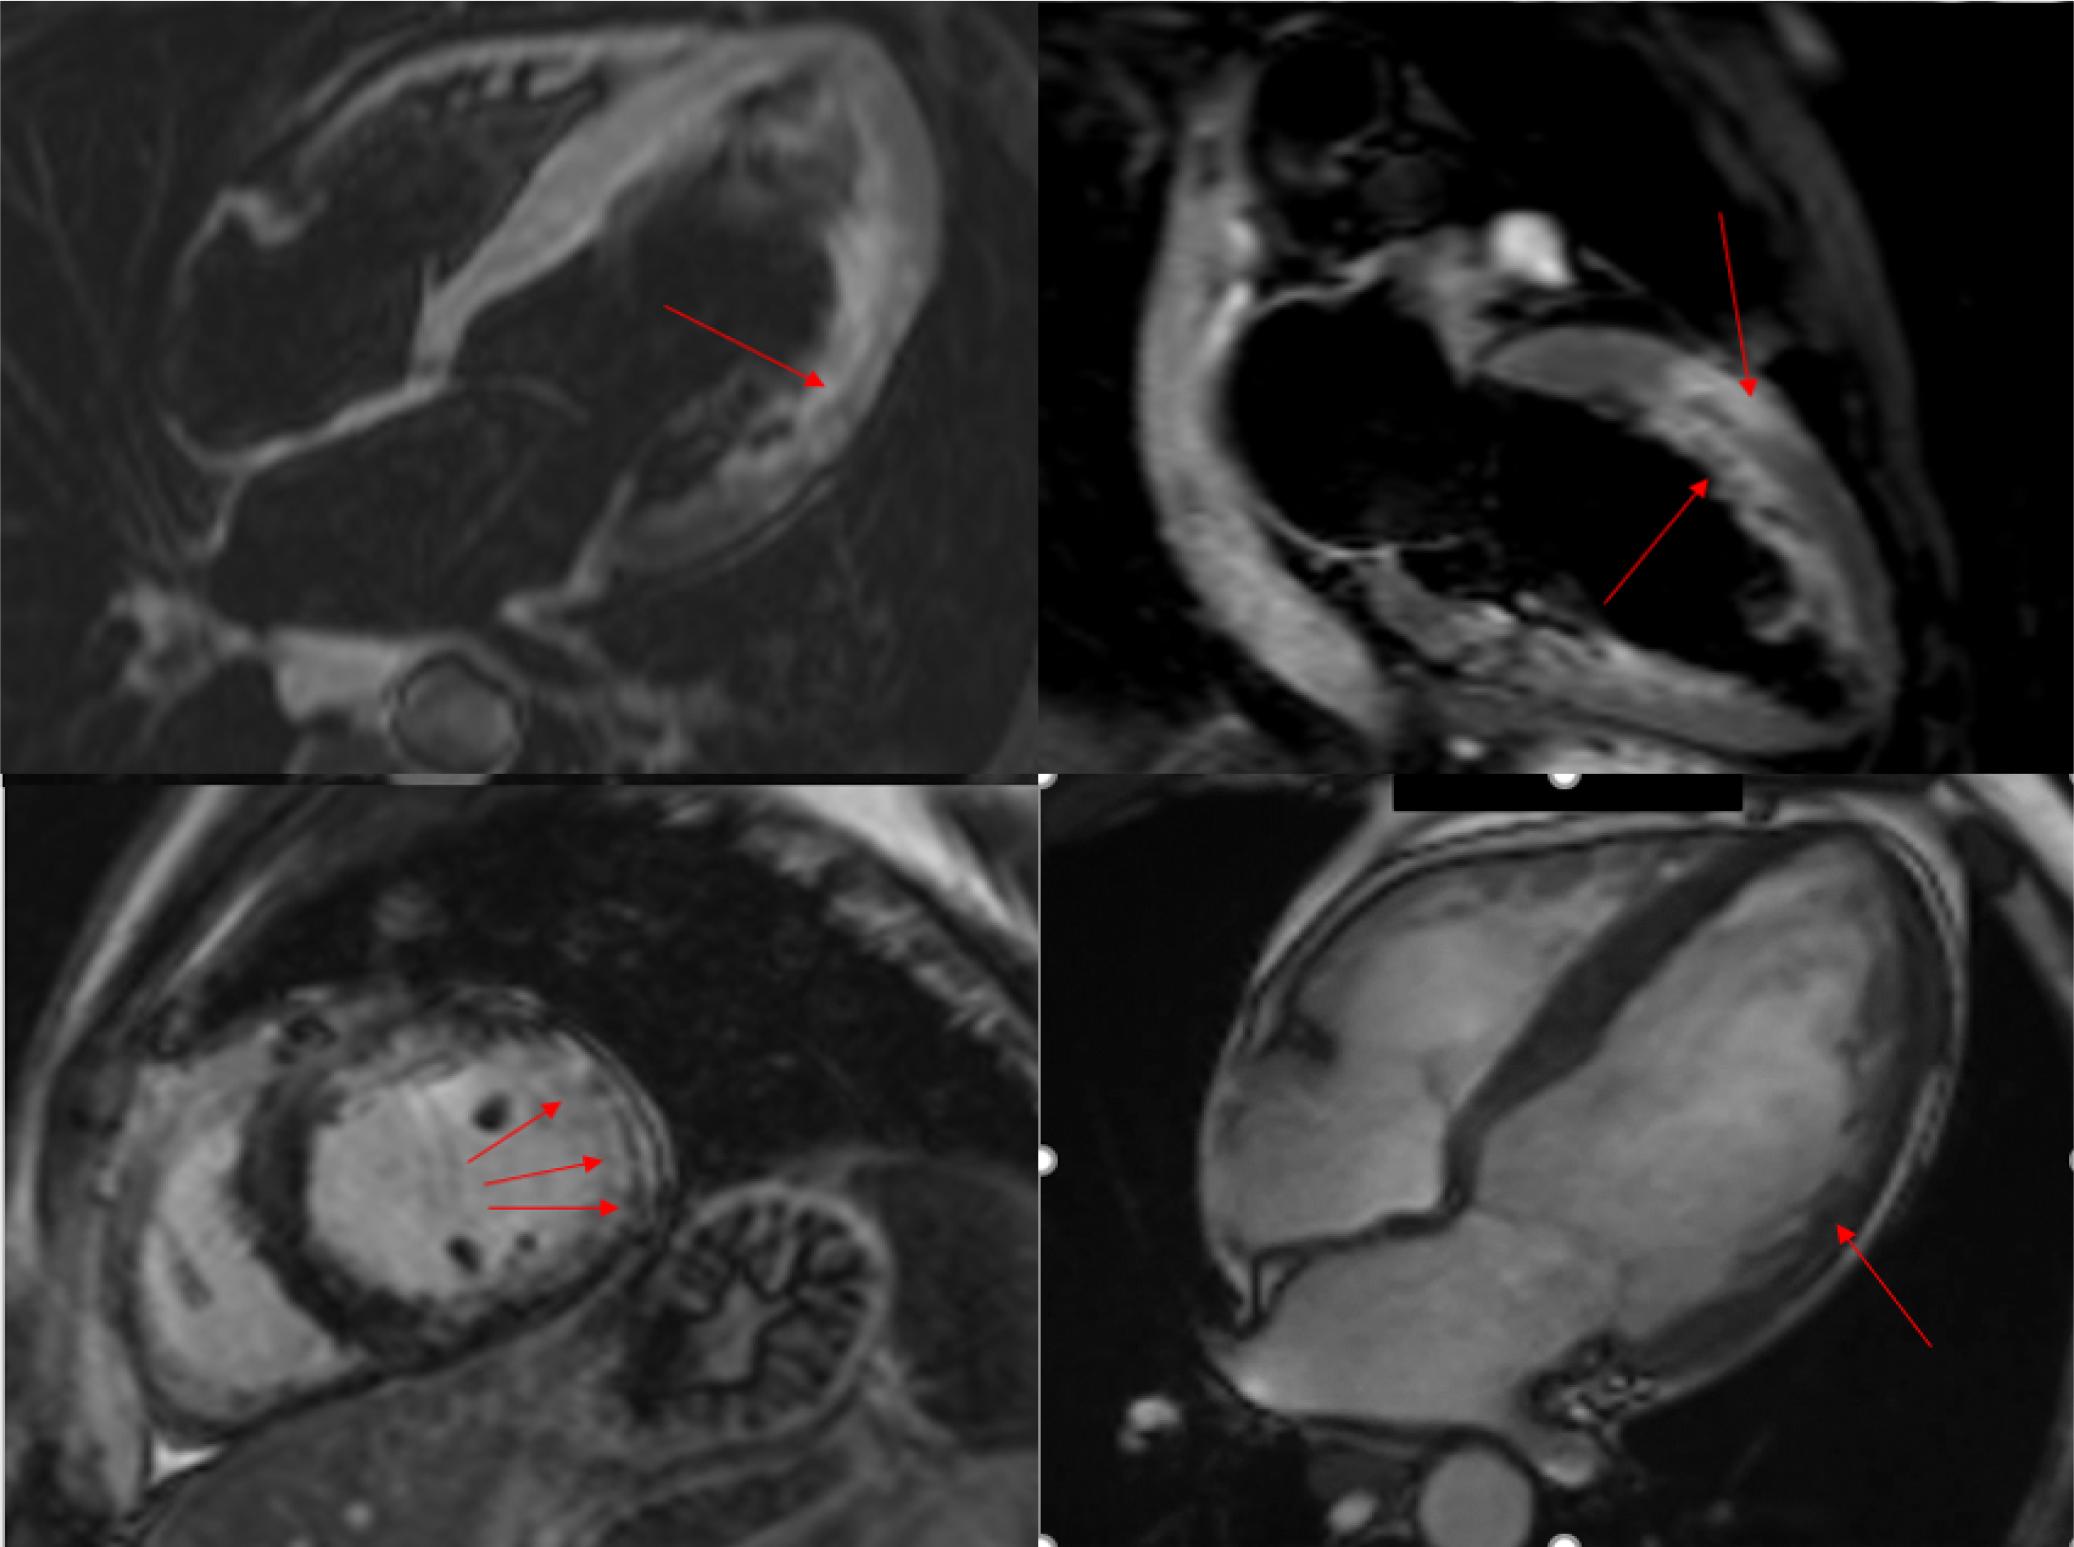
Figure 4
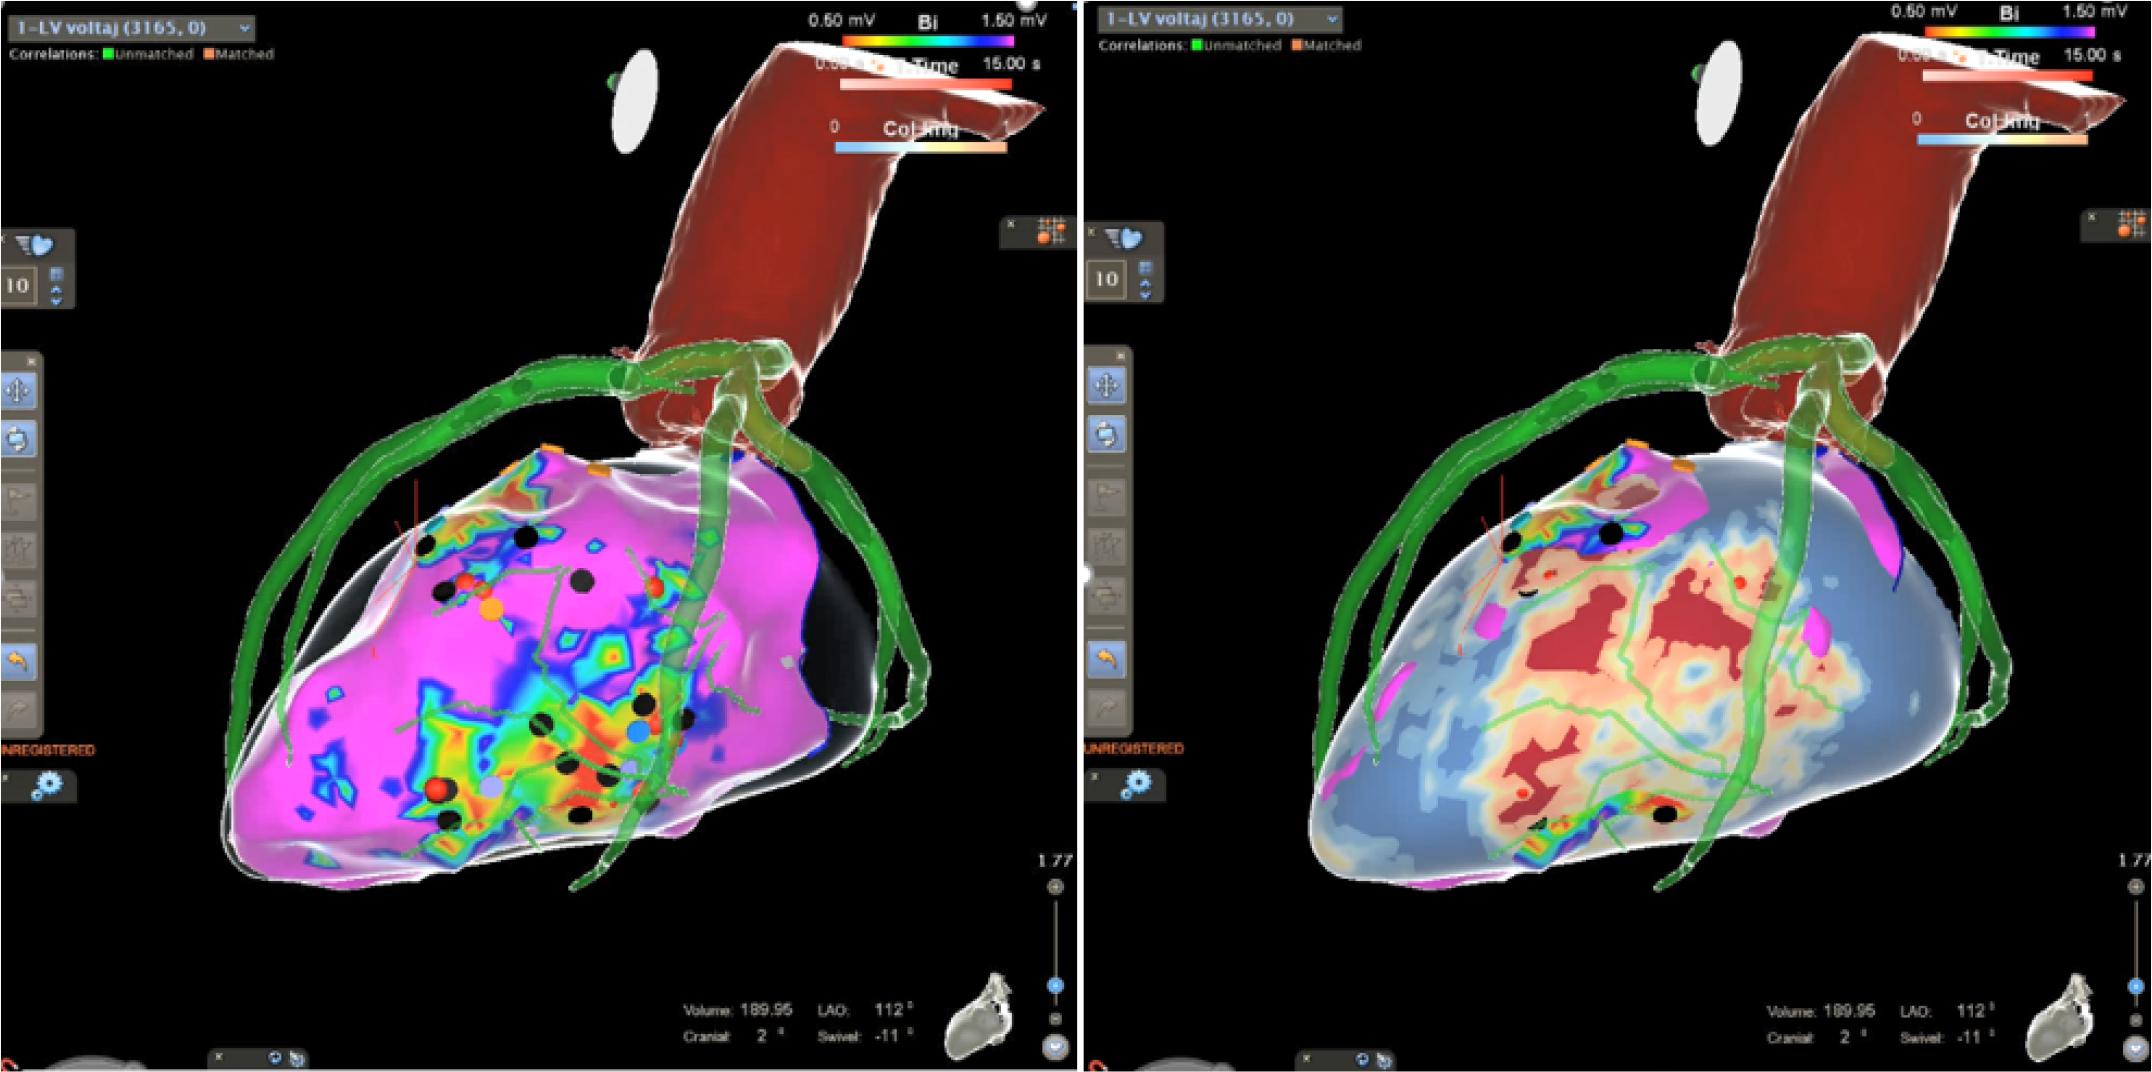
Figure 5
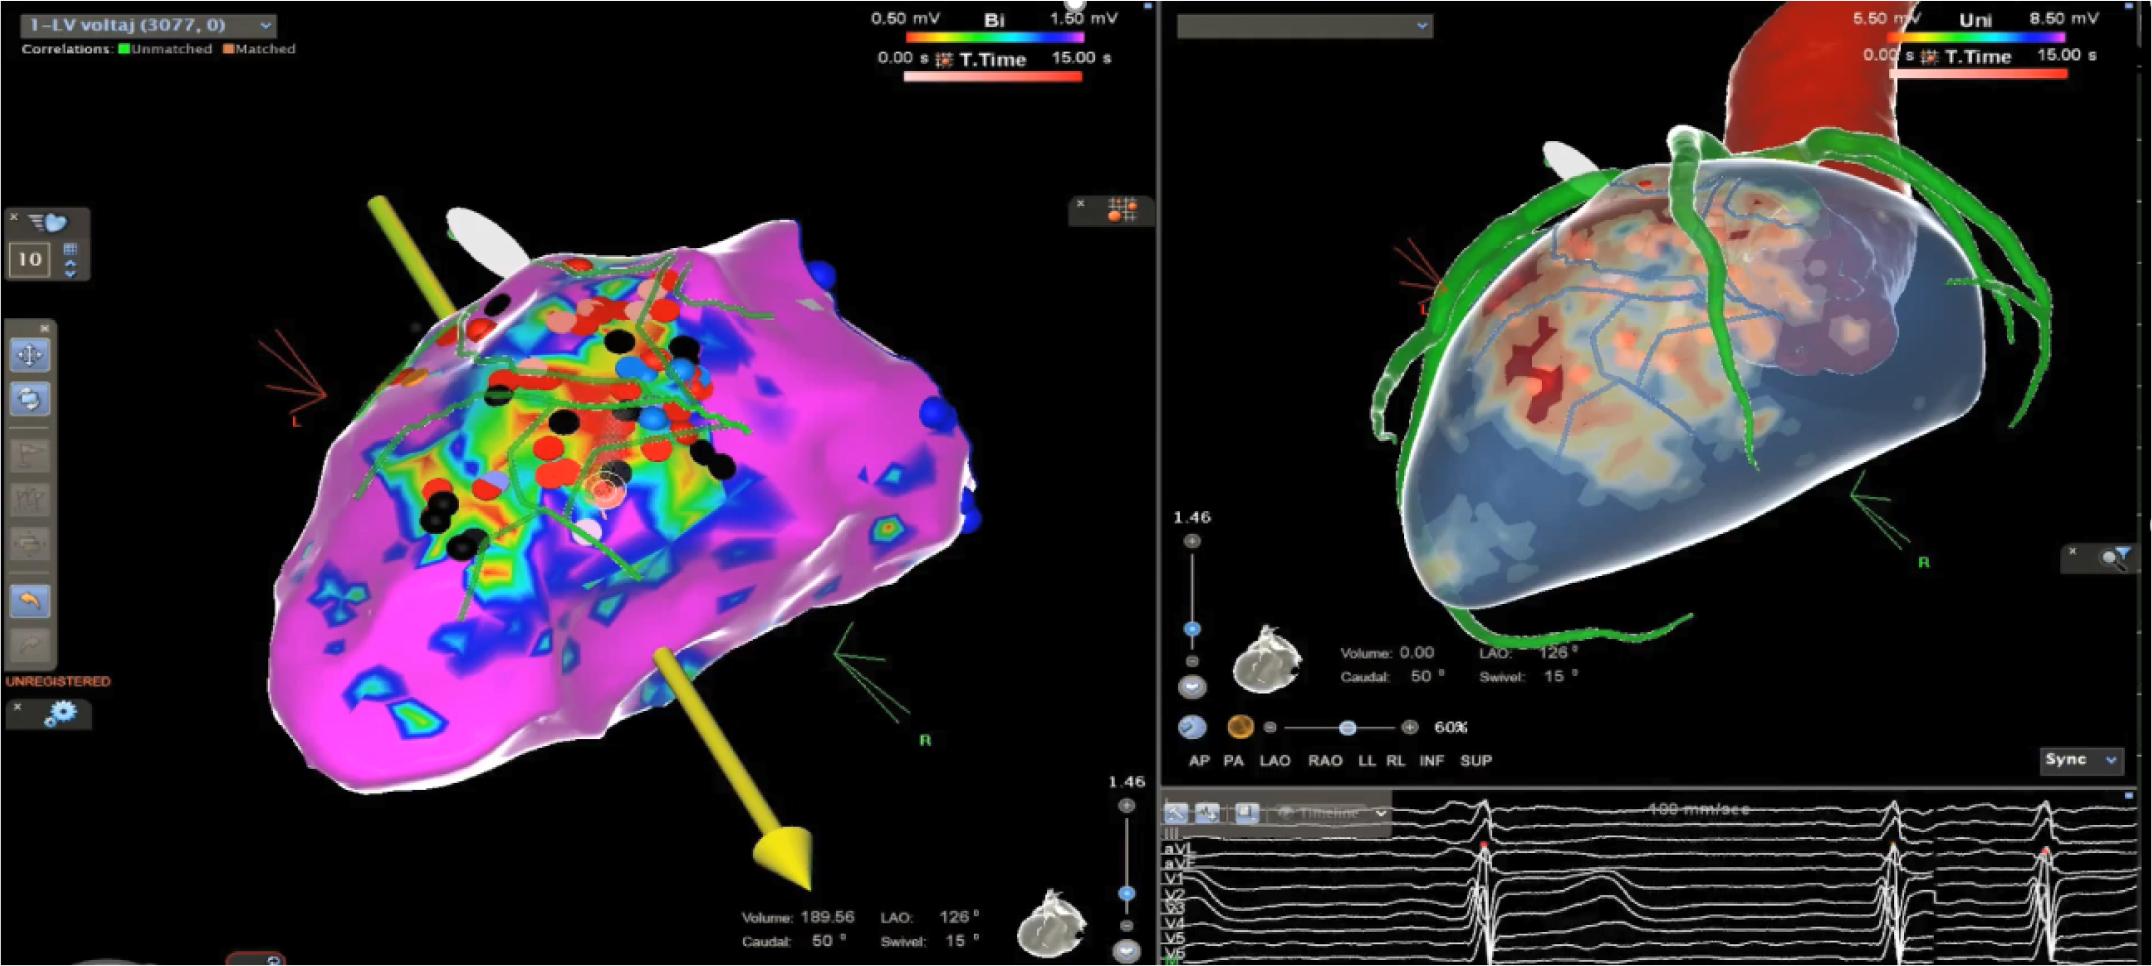
Figure 6
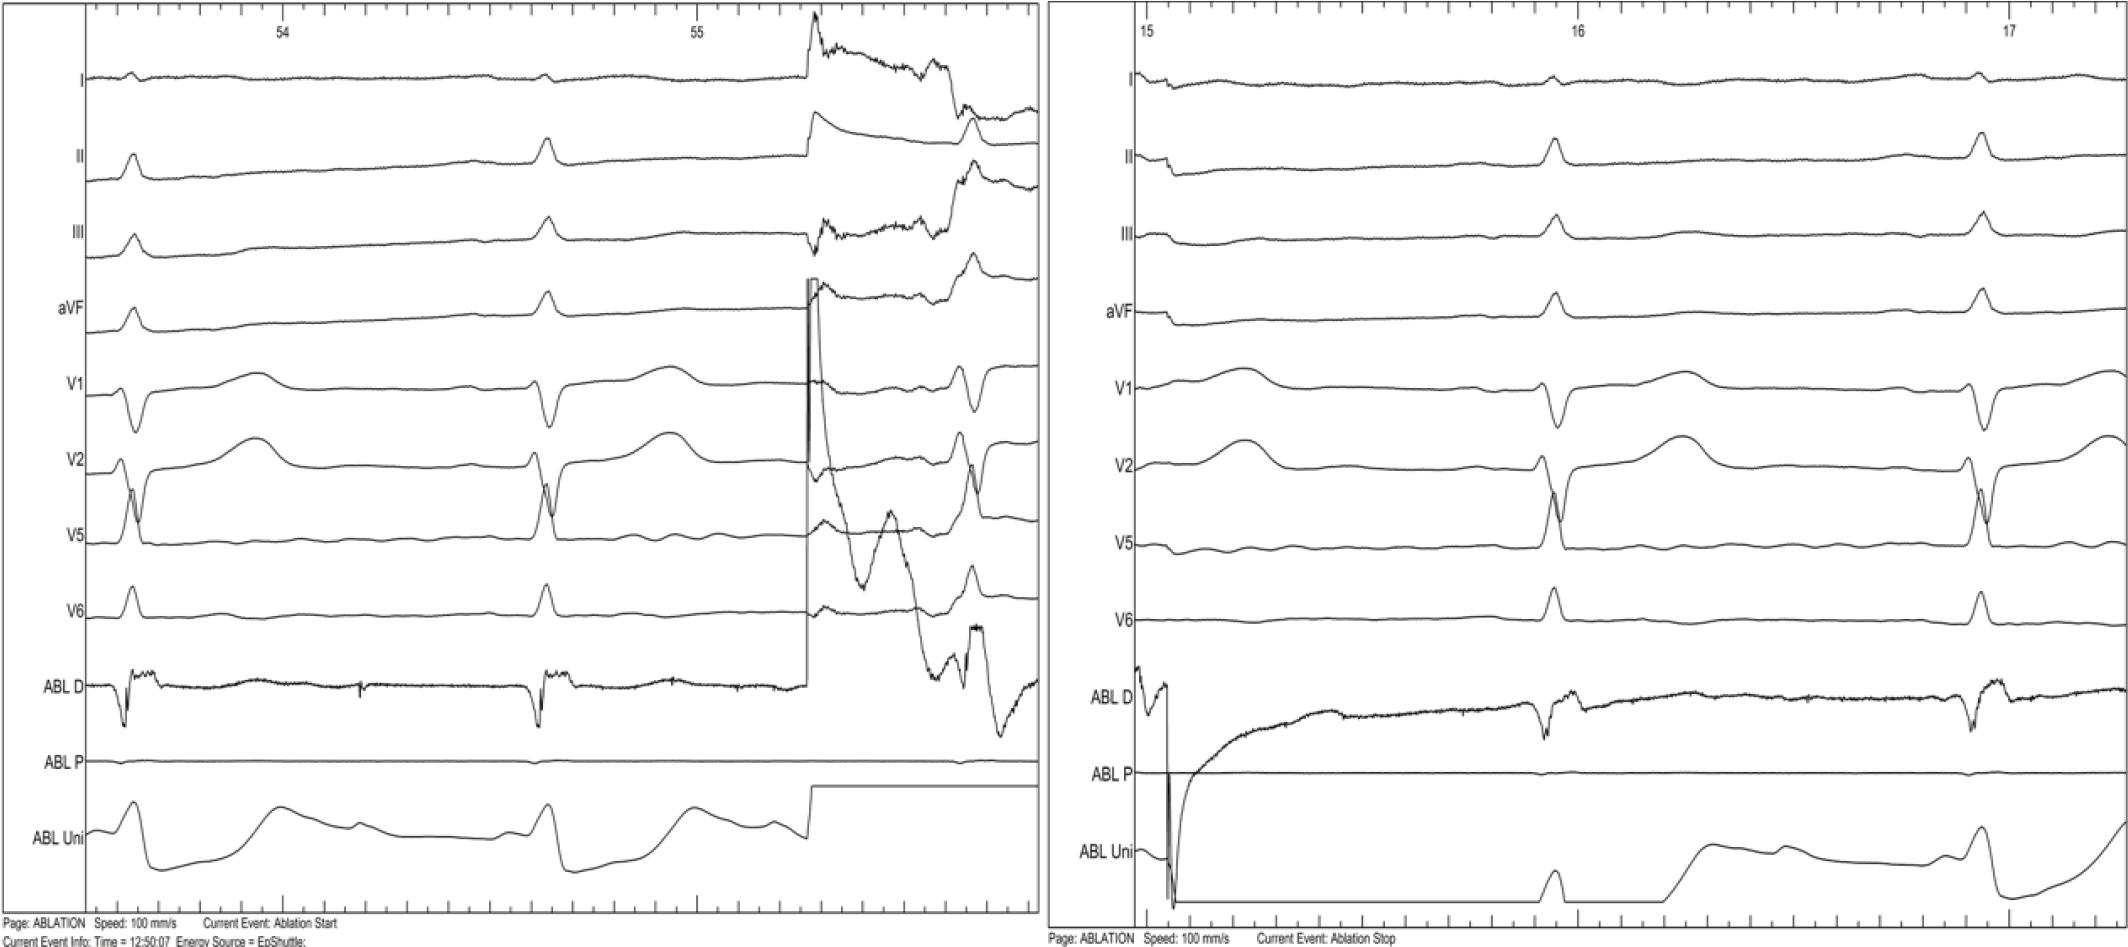
Figure 7
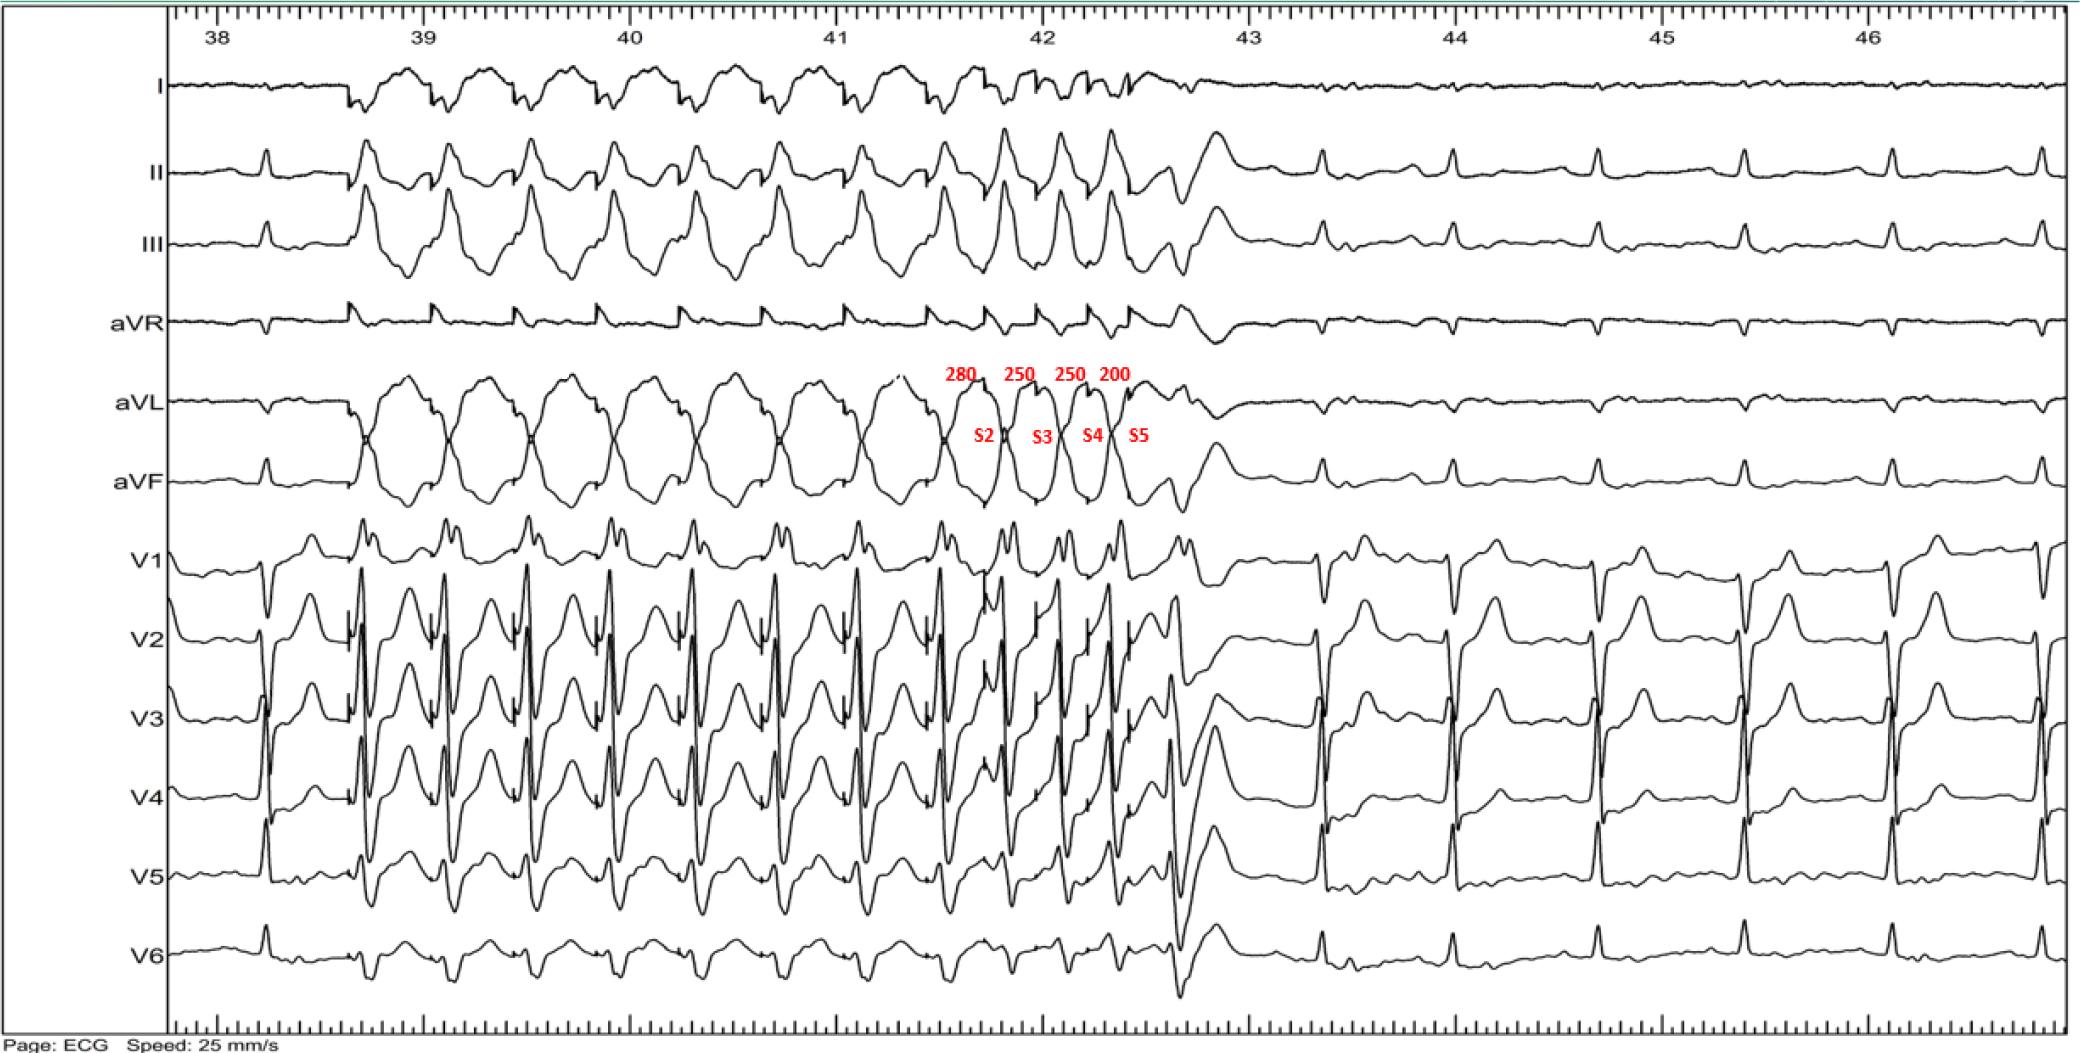
Image integration-guided VT ablation studies_ Adapted from Kowalewski C et al - Advanced Imaging Integration for Catheter Ablation of Ventricular Tachycardia
| Publication | Number of patients | Age | Recurrence rate | Follow-up duration (months) |
|---|---|---|---|---|
| Njeim et al. [12] | 20 | 59 ± 17 | 20% | 17 ± 22 |
| Yamashita et al. [13] | 116 | 58 ± 15 | 30% | 17.4 |
| Andreu et al. [14] | 54 | 64 ± 11 | 18.5% | 20 ± 19 |
| Soto-Iglesias et al. [15] | 56 | 65 ± 12 | 5% | 12 |
| Berte B. et al. [16] | 49 | 62 ± 15 | 27% | 19 ± 8 |