
Figure 1
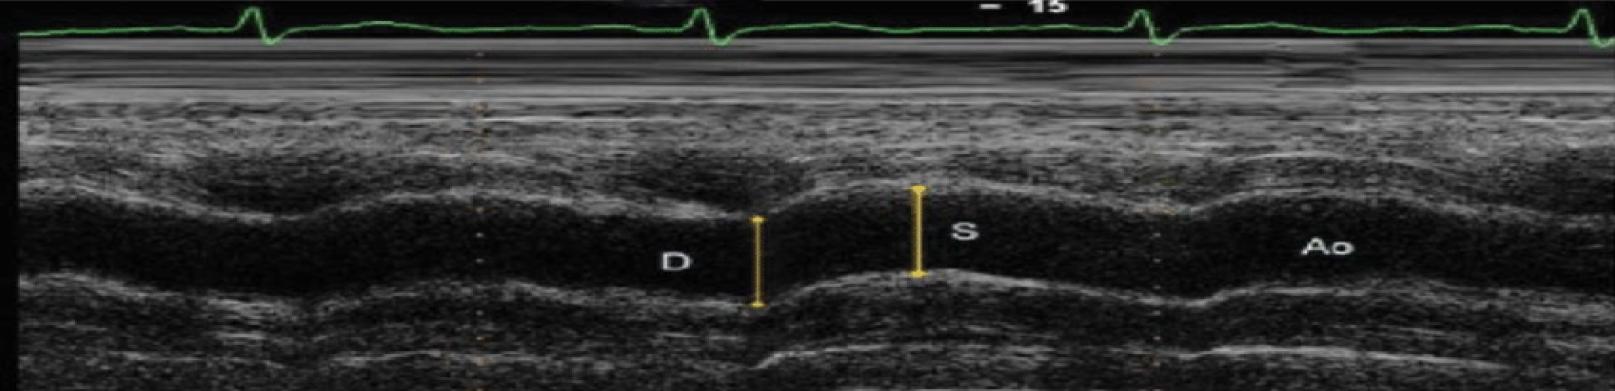
Figure 2
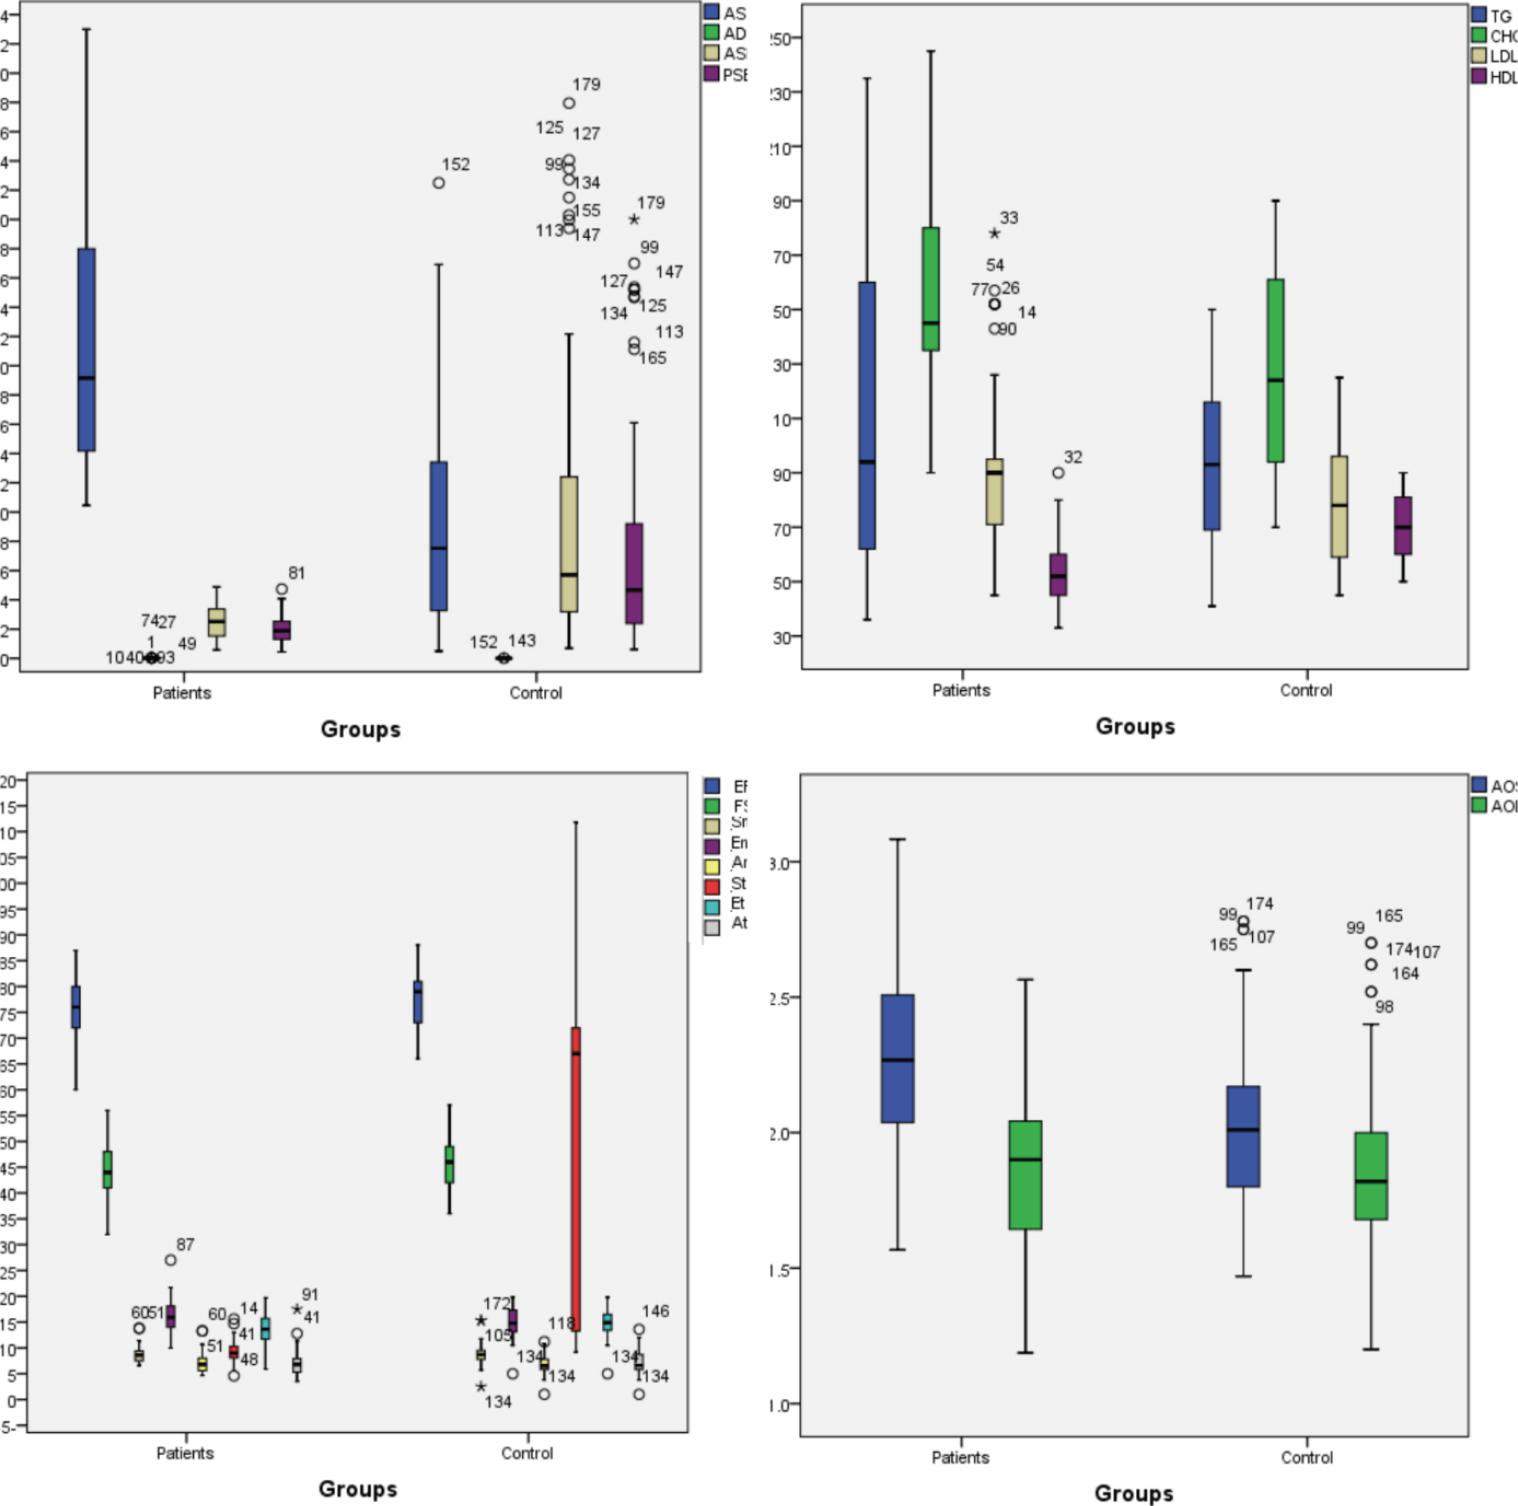
Comparing Doppler tissue imaging, aortic stiffness, and lipid profile levels in children with diabetes and in controls
| Variab. | Groups | Mean | SD | Mean rank | Test value | P value | Variab.s | Mean | SD | Mean rank | Test value | P value |
|---|---|---|---|---|---|---|---|---|---|---|---|---|
| Age | Case | 10.84 | 3.43 | 95.2 | 4166 | 0.665 | LDL | 90.61 | 23.93 | 105.82 | 3179 | 0.002 |
| Control | 10.8 | 2.85 | 91.8 | 78.55 | 21.48 | 81.18 | ||||||
| Height | Case | 136.8 | 18.9 | 69.55 | 2097 | <0.001 | HDL | 54.29 | 11.86 | 63.39 | 1524.5 | <0.001 |
| Control | 153.7 | 12.63 | 117.45 | 69.71 | 11.73 | 123.61 | ||||||
| Weight | Case | 32.92 | 11.81 | 70.42 | 2178 | 0.001 | SBP | 97.8 | 10.39 | 82.14 | 3268 | 0.003 |
| Control | 44.38 | 12.31 | 116.58 | 101.49 | 9.8 | 104.86 | ||||||
| EF | Case | 75.55 | 5.93 | 84.02 | 3442.5 | 0.016 | DBP | 62.04 | 7.45 | 78.15 | 2897 | <0.001 |
| Control | 77.57 | 4.93 | 102.98 | 66.46 | 7.67 | 108.85 | ||||||
| FS | Case | 43.96 | 5.4 | 83.22 | -2.58 | 0.011 | AOS | 2.27 | 0.32 | 114.88 | 2336.5 | <0.001 |
| Control | 45.87 | 4.68 | 103.78 | 2.01 | 0.31 | 72.12 | ||||||
| LVM | Case | 47.62 | 20.43 | 90.42 | 4038.500 | 0.436 | AOD | 1.87 | 0.29 | 96.6 | 4036.5 | 0.433 |
| Control | 40.24 | 21.38 | 96.58 | 1.85 | 0.32 | 90.4 | ||||||
| Left MPI | Case | 0.79 | 0.1 | 134.06 | 552 | <0.001 | ASBI | 10.76 | 15.66 | 122.99 | 1582.00 | <0.001 |
| Control | 0.52 | 0.13 | 52.94 | 2.52 | 1.13 | 64.01 | ||||||
| Right MPI | Case | 0.76 | 0.12 | 121.12 | 8.01 | <0.001 | AS | 9.35 | 7.00 | 59.95 | 1204.00 | <0.001 |
| Control | 0.63 | 0.11 | 65.88 | 22.40 | 11.70 | 127.05 | ||||||
| TG | Case | 124.52 | 76.17 | 100.3 | 3692 | 0.085 | AD | 0.005 | 0.006 | 64.98 | 1672.50 | <0.001 |
| Control | 94.39 | 30.07 | 86.7 | 0.014 | 0.008 | 122.02 | ||||||
| CHO | Case | 155.54 | 37.52 | 112.67 | 5.46 | <0.001 | PSEM | 8.80 | 13.24 | 125.15 | 1381.50 | <0.001 |
| Control | 125.78 | 36.83 | 74.33 | 1.96 | 0.90 | 61.85 |
Correlation between aortic stiffness parameters and Doppler tissue imaging, as well lipid profiles before and after controlling for age in patients_
| Before controlling for age | |||||||||
|---|---|---|---|---|---|---|---|---|---|
| Variables | Statistics | SBP | DBP | AOS | AOD | AS | AD | ASβl | PSEM |
| Duration | r | 0.073 | -0.002 | 0.085 | 0.087 | -.160- | -.197- | 0.223 | 0.255 |
| p | 0.489 | 0.984 | 0.419 | 0.407 | 0.126 | 0.058 | 0.032 | 0.014 | |
| HbA1c | r | 0.274 | 0.265 | -.004- | -.091- | -.008- | 0.031 | -0.063 | -0.058 |
| p | 0.008 | 0.01 | 0.97 | 0.384 | 0.939 | 0.766 | 0.548 | 0.578 | |
| EF | r | -0.254 | -0.224 | -.056- | 0.036 | 0.012 | 0.051 | -.066- | -.110- |
| p | 0.014 | 0.031 | 0.597 | 0.735 | 0.909 | 0.625 | 0.532 | 0.295 | |
| FS | r | -0.241 | -0.203 | 0.01 | 0.089 | 0.026 | 0.062 | -.059- | -.098- |
| p | 0.02 | 0.051 | 0.924 | 0.394 | 0.802 | 0.557 | 0.574 | 0.35 | |
| Left MPI | r | 0.148 | 0.186 | -.014- | -.050- | 0.158 | 0.177 | -.059- | 0.003 |
| p | 0.156 | 0.074 | 0.897 | 0.635 | 0.131 | 0.09 | 0.576 | 0.978 | |
| Right MPI | r | 0.219 | 0.213 | -.057- | -.063- | -.053- | 0.015 | 0.067 | 0.115 |
| p | 0.035 | 0.04 | 0.589 | 0.547 | 0.616 | 0.886 | 0.525 | 0.273 | |
| LVM | r | .055 | -.024 | .047 | .123 | -.131 | -.142 | .108 | .106 |
| p | .454 | .748 | .524 | .093 | .076 | .053 | .142 | .151 | |
| TG | r | -.025- | -.077- | 0.052 | 0.026 | 0.097 | -.007- | 0 | -.013- |
| p | 0.809 | 0.464 | 0.62 | 0.801 | 0.357 | 0.951 | 0.998 | 0.902 | |
| CHO | r | -.050- | -.075- | -.080- | -.038- | -.159- | -.151- | 0.072 | 0.112 |
| p | 0.633 | 0.472 | 0.444 | 0.719 | 0.129 | 0.148 | 0.49 | 0.287 | |
| LDL | r | -.092- | -.060- | -.067- | -.030- | -.077- | -.053- | -.007- | -.005- |
| p | 0.378 | 0.569 | 0.523 | 0.776 | 0.466 | 0.612 | 0.946 | 0.963 | |
| HDL | r | -.067- | -.010- | 0.078 | 0.091 | -.107- | -.082- | 0.115 | 0.109 |
| p | 0.523 | 0.921 | 0.455 | 0.384 | 0.306 | 0.437 | 0.272 | 0.299 | |
| After controlling for age | |||||||||
| duration | r | 0.008 | -0.048 | -0.011 | -0.01 | -0.176 | -0.221 | 0.219 | 0.25 |
| p | 0.942 | 0.649 | 0.915 | 0.922 | 0.094 | 0.034 | 0.036 | 0.016 | |
| HbA1c | r | 0.294 | 0.271 | -0.018 | -0.129 | -0.009 | 0.029 | -0.064 | -0.059 |
| p | 0.004 | 0.009 | 0.864 | 0.22 | 0.929 | 0.781 | 0.545 | 0.574 | |
| EF | r | -0.285 | -0.236 | -0.076 | 0.038 | 0.011 | 0.051 | -0.066 | -0.11 |
| p | 0.006 | 0.024 | 0.469 | 0.719 | 0.915 | 0.632 | 0.531 | 0.295 | |
| FS | r | -0.284 | -0.223 | -0.016 | 0.084 | 0.023 | 0.057 | -0.061 | -0.1 |
| p | 0.006 | 0.033 | 0.88 | 0.426 | 0.826 | 0.587 | 0.566 | 0.341 | |
| Left MPI | r | 0.209 | 0.222 | 0.054 | 0.01 | 0.167 | 0.191 | -0.055 | 0.008 |
| p | 0.046 | 0.033 | 0.607 | 0.925 | 0.111 | 0.068 | 0.602 | 0.938 | |
| Right MPI | r | 0.238 | 0.219 | -0.078 | -0.087 | -0.054 | 0.014 | 0.066 | 0.115 |
| p | 0.022 | 0.036 | 0.461 | 0.411 | 0.612 | 0.894 | 0.53 | 0.277 | |
| LVM | r | .047 | -.029 | .035 | .127 | -.130 | -.139 | .111 | .108 |
| p | .528 | .691 | .640 | .084 | .078 | .059 | .133 | .145 | |
| TG | r | -0.051 | -0.094 | 0.028 | -0.005 | 0.093 | -0.013 | -0.002 | -0.016 |
| p | 0.629 | 0.37 | 0.789 | 0.966 | 0.379 | 0.903 | 0.986 | 0.882 | |
| CHO | r | -0.012 | -0.052 | -0.031 | 0.024 | -0.152 | -0.141 | 0.077 | 0.117 |
| p | 0.909 | 0.624 | 0.771 | 0.82 | 0.148 | 0.179 | 0.467 | 0.265 | |
| LDL | r | -0.019 | -0.01 | 0.052 | 0.102 | -0.063 | -0.031 | 0.001 | 0.005 |
| p | 0.861 | 0.924 | 0.621 | 0.331 | 0.553 | 0.767 | 0.996 | 0.96 | |
| HDL | r | -0.187 | -0.081 | -0.078 | -0.065 | -0.131 | -0.115 | 0.108 | 0.099 |
| p | 0.074 | 0.445 | 0.457 | 0.537 | 0.214 | 0.276 | 0.304 | 0.349 | |