
FIGURE 1
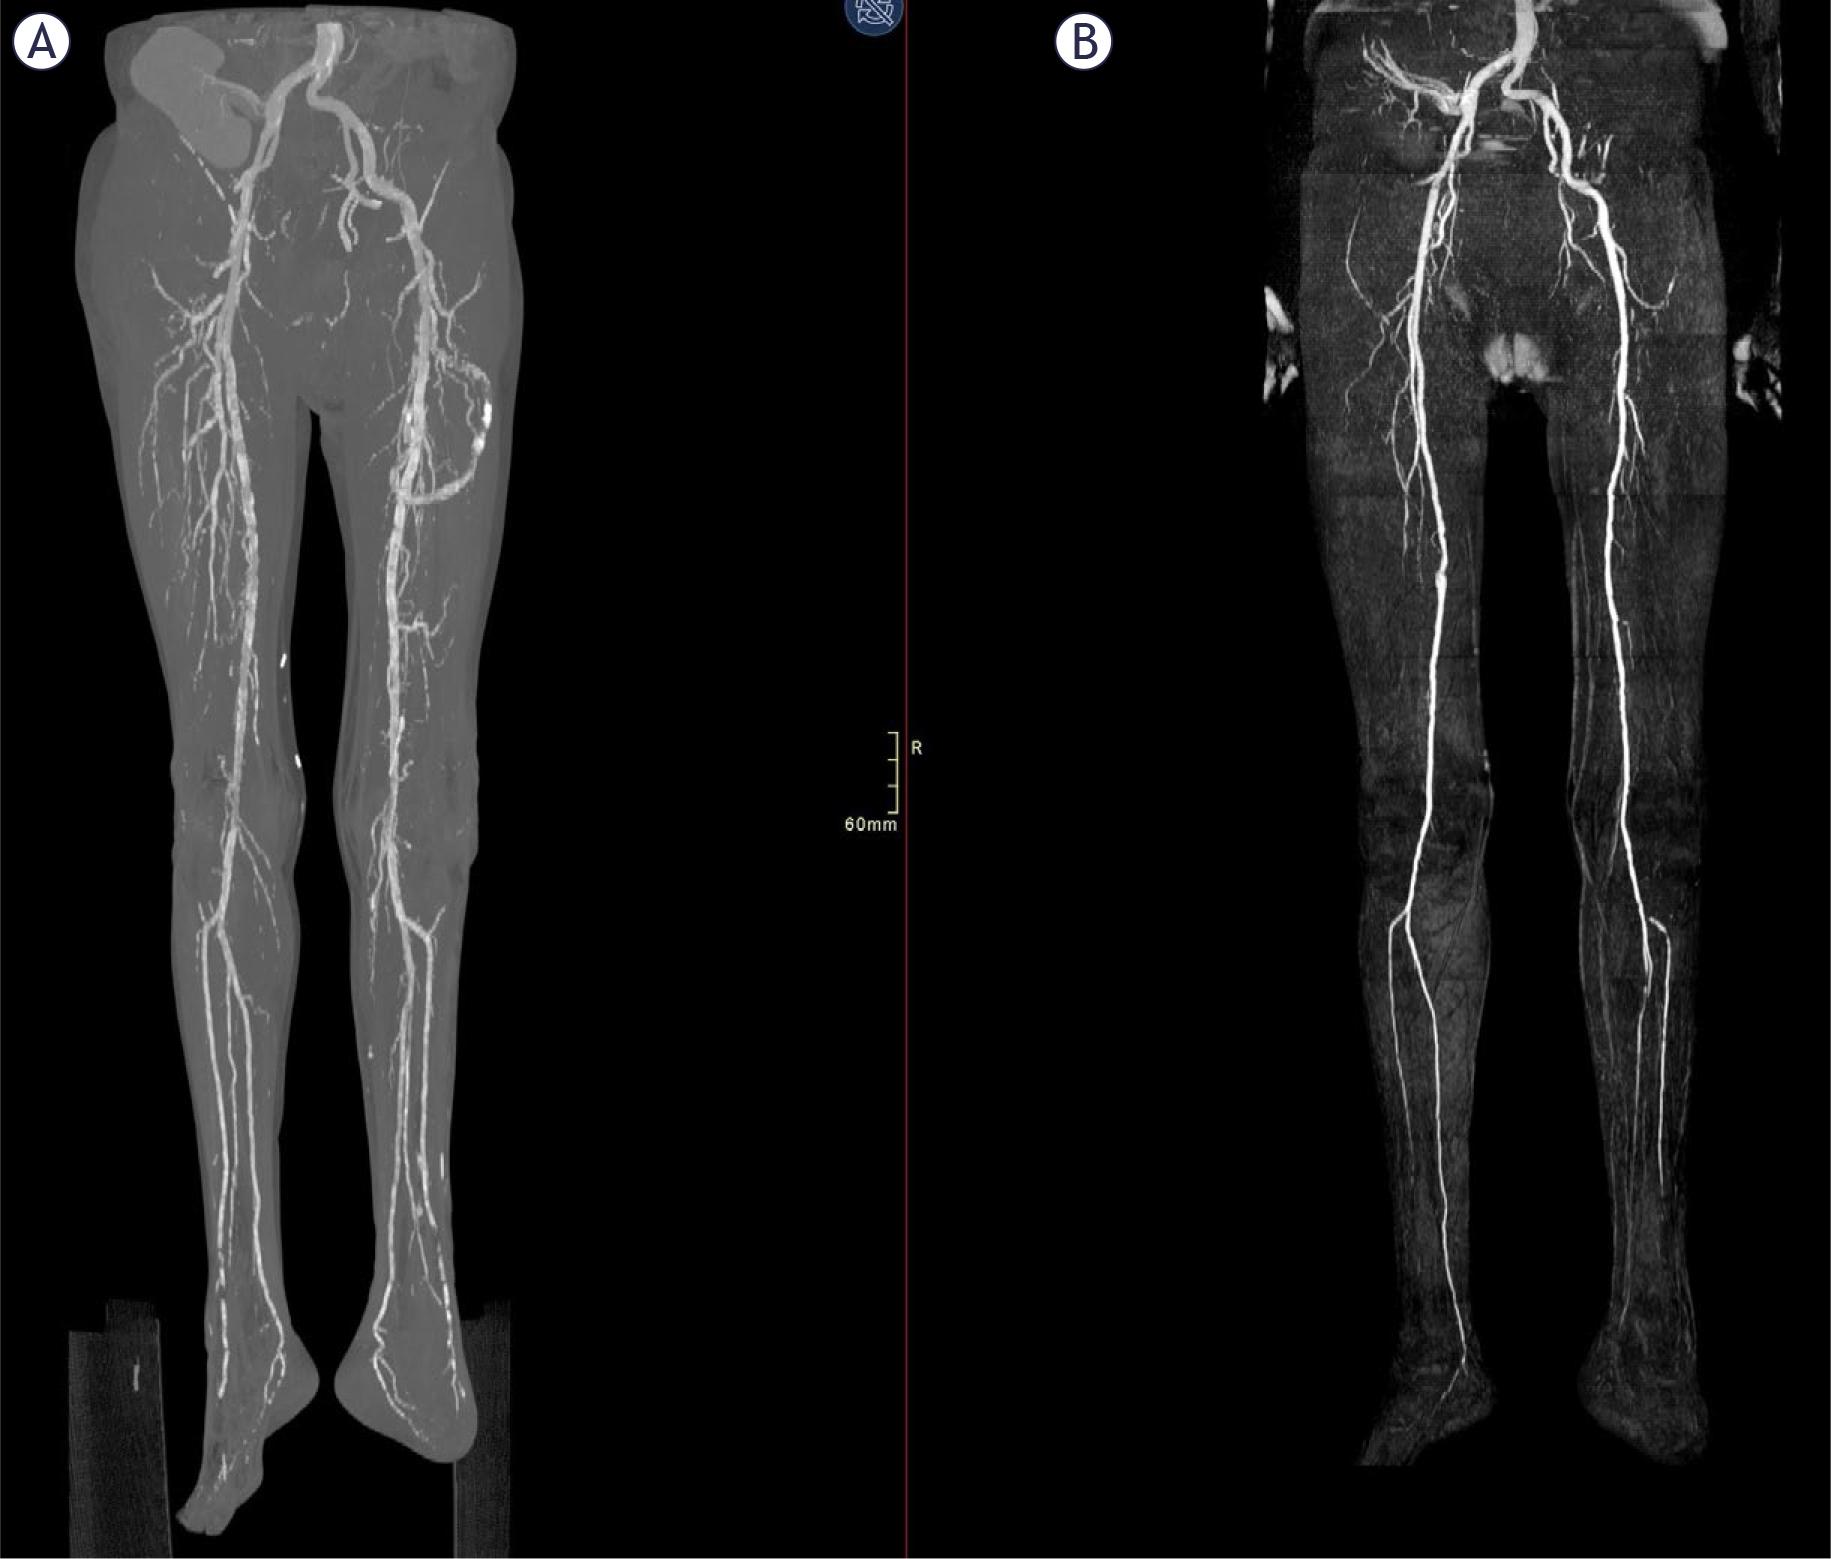
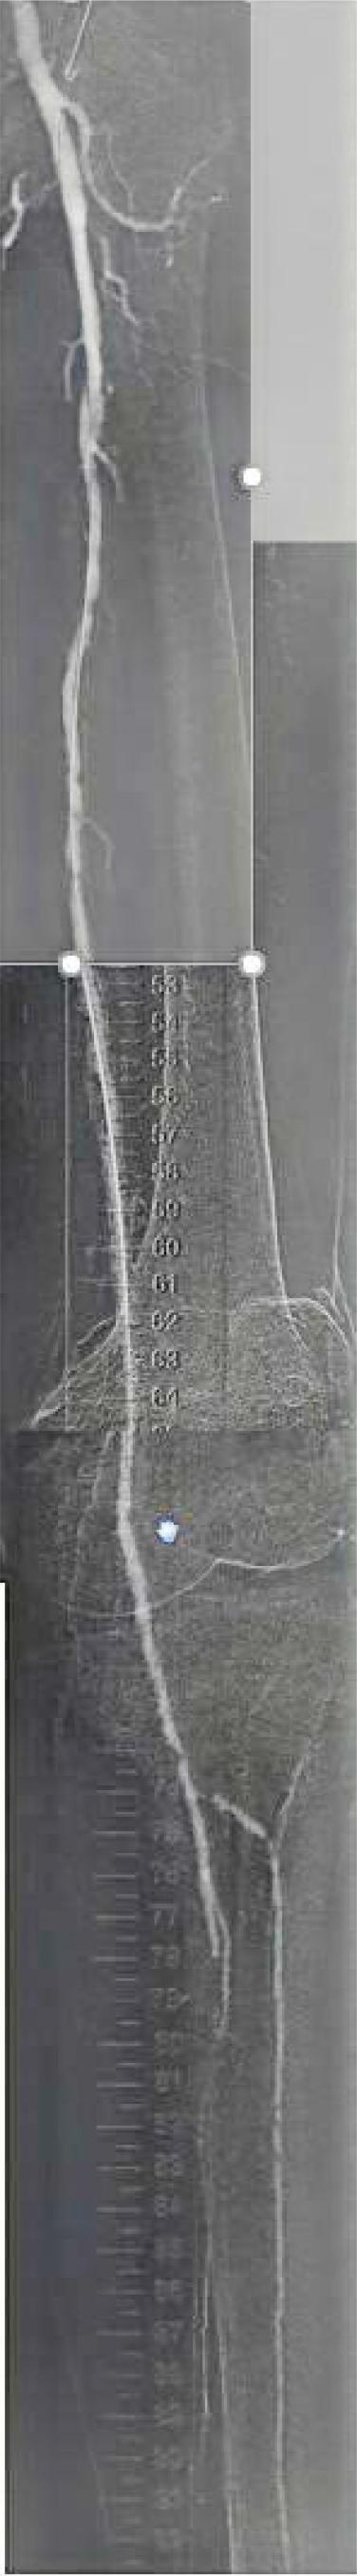
FIGURE 2.
Kappa values by arterial segment
| Arterial segment | QISS MRA vs. CTA κ | QISS MRA vs. DSA κ | CTA vs. DSA κ |
|---|---|---|---|
| Pelvic arteries | 0.40 | 0.51 | NA |
| Femoropopliteal arteries | 0.29 | 0.23 | 0.55 |
| Below-the-knee arteries | 0.42 | 0.61 | 0.32 |
Results of agreement quiescent-interval slice-selective magnetic resonance angiography (QISS MRA), computer tomography angiography (CTA) and digital subtraction angiography (DSA)
| Comparison | κ Value | 95% CI | p-value | Agreement level |
|---|---|---|---|---|
| QISS MRA vs. CTA | 0.41 | 0.31–0.52 | < 0.001 | Moderate |
| QISS MRA vs. DSA | 0.49 | 0.37–0.60 | < 0.001 | Moderate |
| CTA vs. DSA | 0.57 | 0.34–0.80 | < 0.001 | MODERATE |
Segment-based diagnostic performance of QISS MRA and CTA for detection of significant (≥ 50%) stenosis/occlusion using DSA as the reference standard
| Modality / territory | Paired segments (n) | TP | TN | FP | FN | Sensitivity (%) | Specificity (%) | PPV (%) | NPV (%) | Accuracy (%) |
|---|---|---|---|---|---|---|---|---|---|---|
| QISS MRA – all segments | 121 | 37 | 64 | 13 | 7 | 84.1 | 83.1 | 74.0 | 90.1 | 83.5 |
| QISS MRA – below-the-knee | 72 | 25 | 36 | 7 | 4 | 86.2 | 83.7 | 78.1 | 90.0 | 84.7 |
| CTA – all segments | 39 | 3 | 31 | 3 | 2 | 60.0 | 91.2 | 50.0 | 93.9 | 87.2 |
| CTA – below-the-knee | 16 | 0 | 14 | 1 | 1 | 0.0 | 93.3 | 0.0 | 93.3 | 87.5 |